This post goes out as an email to our subscribers every day and is posted for free here around 2 PM ET. To get your real-time copy, sign up for the free or premium version here: Opening Print Subscribe.
Dead Cat Bounces and War Drums: ES Rips, Fades, and the Pit Knows This Ain’t Over
Follow @MrTopStep on Twitter and please share if you find our work valuable!
Our View
When I did the Claude levels on Saturday morning before I went out to my nephew’s, I also sent it off to Laura, the editor. I did this because I didn’t know what time I was going to get home, and I didn’t want to have to do it at 9:00 pm or 10:00 pm.
I swear I didn’t even know how much the markets were down until PitBull called me around 6:30 or 7:00. I have an old saying about Sunday nights — I call it the Sunday night blues. I started saying that over 30 years ago, knowing I had to go back to the CME floor and battle it for another week.
As I have said many times since the war started, Iran is not going to buckle, and Trump’s assumptions are off base.
Iranian Foreign Minister Abbas Araghchi said yesterday that negotiations with the U.S. are “off the table,” citing the recent U.S. and Israeli strikes as proof that American promises of non-aggression cannot be trusted.
Following the death of Ayatollah Ali Khamenei, his son and successor, Mojtaba Khamenei, has taken a hardline stance, with state media projecting a “long fight” and a refusal to back down under international pressure.
Our Lean
After the ES made its late high, I said the next 50 to 60 points were going to be down, and the ES just traded down to 6762.25 at 8:10 pm. That’s 57 points off the ES 6918.25 high.
If I knew exactly when and where the ES and NQ were going, I would make a big bet and retire because all you need is one day of getting this right. But like I have always said, I don’t bet big because it’s too hard to replace lost money.
Our lean: Yesterday’s low was 6584.50, and my Claude level was 6583.00 at the dataset low, Fib 100%, and Nov 21 swing low. Before @HandleStats said the gaps were going to fill yesterday morning, I said most of the gaps are tradable, and they were, but there was some shake and back after the initial rip.
I still think it doesn’t matter if it’s a 100-point, 150-point, a 200-point or 250-point rally — they will all be dead cats until the fighting stops. I can’t rule out another pop, but there is big resistance between 6820 and 6850.
Remember, the gaps are tradable and don’t forget Trump is famous for coming to the rescue when the shit hits the fan.
S/R LEVELS — Close: 6,801.00 | 03/09/2026
═══════════════════════════════════════════
RESISTANCE LEVELS
═══════════════════════════════════════════
7,043.00 Swing High All-Time (01/28/26)
7,036.25 Swing High (01/13/26)
7,014.00 Swing High (10/30/25)
7,011.50 Swing High (02/11/26)
6,983.75 Recent 30-bar High / Stoch Hi
6,964.83 Pivot R3
6,962.50 Swing High (11/12/25)
6,934.79 Fib 23.6% (Recent Swing)
6,909.42 Pivot R2
6,903.90 Stoch = 80
6,867.85 Fib 38.2% (Recent Swing)
6,853.90 Fib 23.6% (Full Range)
6,826.58 Pivot R1
6,813.75 Fib 50.0% (Recent Swing)
═══════════════════════════════════════════
NEUTRAL / PIVOT
═══════════════════════════════════════════
6,882.74 20-bar Mean Close
6,876.58 HLC Mean Typical Price
6,813.75 Fib 50% Recent Swing
6,801.00 ◄ CURRENT CLOSE
6,771.17 Pivot PP
═══════════════════════════════════════════
SUPPORT LEVELS
═══════════════════════════════════════════
6,759.65 Fib 61.8% (Recent Swing)
6,763.82 StdDev -2σ Close
6,751.57 HLC -2σ Typical Price
6,736.92 Fib 38.2% (Full Range)
6,688.33 Pivot S1
6,682.62 Fib 78.6% (Recent Swing)
6,667.22 RSI = 30 Projection
6,664.35 Stoch = 20
6,642.38 Fib 50.0% (Full Range)
6,632.92 Pivot S2
6,584.50 Recent 30-bar Low
6,583.00 Swing Low (11/21/25)
6,595.25 Swing Low (10/10/25)
6,550.08 Pivot S3
6,547.83 Fib 61.8% (Full Range)
6,413.22 Fib 78.6% (Full Range)
6,349.50 Swing Low (08/01/25)
6,353.50 Swing Low (07/16/25)
6,241.75 Swing Low All-Time (06/26/25)
═══════════════════════════════════════════
FIBONACCI EXTENSIONS (Upside)
═══════════════════════════════════════════
7,167.71 127.2% Extension
7,232.82 141.4% Extension
7,326.35 161.8% Extension
7,501.50 200.0% Extension

Guest Posts:
Manny Payano – @manny_trends
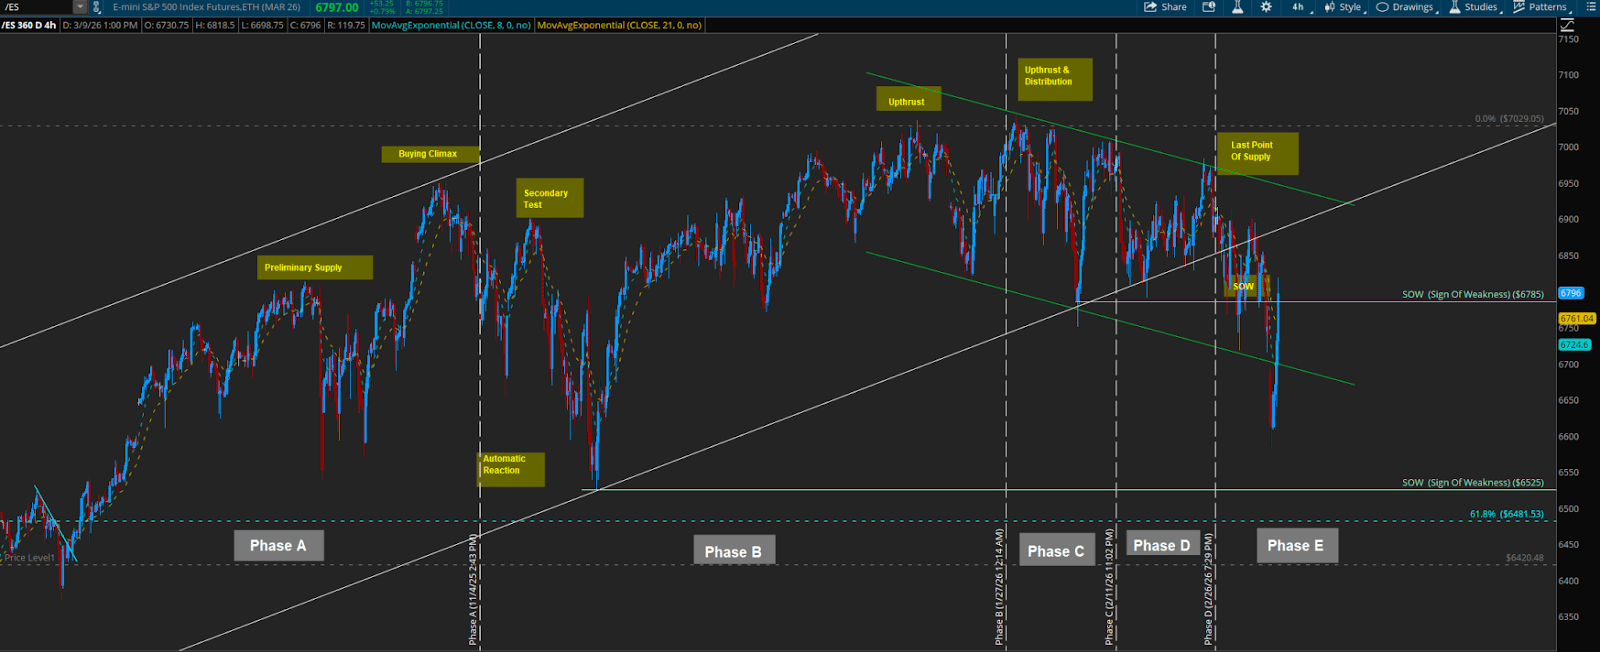
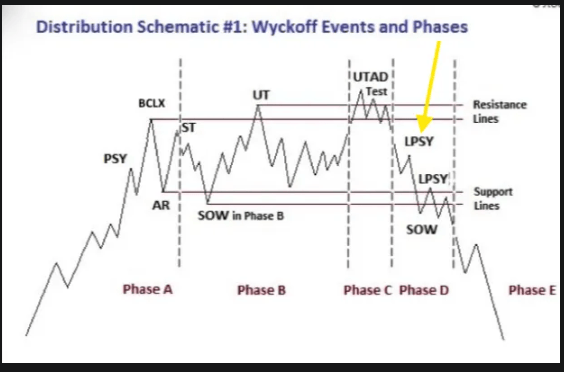
Wyckoff Distribution Check-In: The LPSY Call and What Comes Next
In the last Opening Print, I framed the market with a simple risk box:
Range High: 7000
Range Low: 6600
7000 was the ceiling until proven otherwise, and 6600 was the floor that would tell us whether the market was still balancing or starting a real markdown.
The goal was never to play fortune teller. It was to stay objective, define the risk, and let the market show its hand.
What I needed to see for Phase D
I said Phase D would begin when weakness became repeatable:
-
A clear Sign of Weakness driving price toward 6600 with urgency
-
A bounce that stalls below prior supply, creating a Last Point of Supply
-
Follow through lower after that failed bounce
That last part was the whole deal. Anybody can label a chart after the fact. The real question is whether price actually follows the script.
February 25: The LPSY call
On February 25, I raised the possibility that the market had just printed its Last Point of Supply.
The logic was straightforward. The bounce looked constructive on the surface, but it could not reclaim the upper part of the range with real authority. In Wyckoff terms, that kind of rally can become the final reload point for sellers before markdown starts to speed up.
At the time, I framed it the right way: as a question, not a victory lap. LPSY is not confirmed by the bounce itself. It is confirmed by what happens after the bounce fails.
What has happened since
Since that February 25 note, the market has largely done what a distribution structure is supposed to do.
Weakness became repeatable. Rallies struggled to regain meaningful ground. Price rotated lower, and the downside objective from that distribution framework has, for the most part, played itself out.
Today’s session added an interesting wrinkle. After pushing lower into the key support zone, ES spent the day recovering and retracing a large portion of the decline. That is exactly the kind of response I start paying attention to once a markdown phase begins to mature. Markets rarely ring a bell at the exact low, but strong recoveries after extended weakness are usually worth noting.
That matters because once a move starts achieving its objective, the conversation has to change.
The question is no longer whether distribution was in play. The market already answered that.
The question now is whether the bulk of the downside move has already been expressed and whether the market is beginning the process of stabilizing after that markdown.
What matters now
This is where traders need to be careful.
After a decline of this size, it gets very easy to get fully bearish. That is usually right about the time everybody starts sounding smartest, which is also when the trade often gets harder.
That does not mean the market cannot go lower. It means the easy part of the bearish thesis may no longer be in front of us.
When a distribution move starts to fulfill its purpose, risk has to be recalibrated.
Game plan
I am still letting the same levels do the work.
Bull path
Bulls need continued recovery and eventual acceptance back toward 7000. If price can reclaim the upper portion of the range with authority, the market moves back toward balance and the distribution thesis weakens.
Bear path
Bears want this rally to stall out in the upper half of the range and fail, leading to another rotation back toward 6600.
If 6600 breaks and cannot be reclaimed, markdown risk increases again.
Until then, the best approach remains the same: treat the range as a risk framework, not a debate. In a distribution environment, patience gets paid and opinions get charged rent.
If this bigger picture is the map, my daily setups are the execution plan. You can find them posted each day on my X feed, @manny_trends. Members of IMPRO are often the beneficiaries of that work. Last week alone, the daily setups identified the low of the day three times and the high of the day once.
In my next write-up, I will make the case for ES 7450-7500 as a potential upside target.
For readers new to my work, I have been trading S&P futures since 2012. Before going full-time, I spent nearly a decade at Bloomberg in analytics and have appeared as a guest on the Power Players YouTube trading program. Last year my trading generated over $175,000 in prop firm payouts, so the frameworks I share here are grounded in real execution.
Market Recap
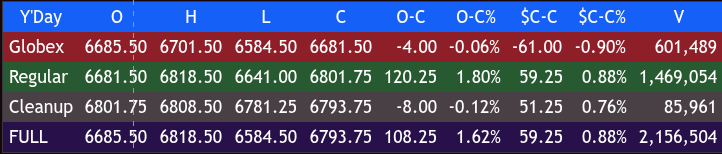
Things were already on a down note, but after Israel’s strikes on 30 Iranian fuel depots on Saturday, things went from bad to worse for the ES during Sunday night’s Globex session. The ES traded all the way down to 6584.50, down 159 points at 10:15 pm. The ES then rallied 117.25 points up to 6701.75 at 5:30 am and opened Monday’s regular session at 6681.50 with 826k contracts traded overnight.
After the open, the ES traded 6689.50, rallied up to 6694.00, sold off down to 6644.25, just under the VWAP at 9:50, rallied up to 6677.75, sold off down to a new low at 6641.00 at 10:10, rallied up to 6741 at 12:45, sold off down to 6698.50 at 1:40, rallied back up to a lower high at 6731.25 at 2:35, pulled back to 6719.75 at 3:05, and traded back up to 6818.25 at 3:38 after Trump told CBS that the war is “very complete” and the US is “very far” ahead of schedule, as Iran now has “no navy, no communications and no air force.”
After the pop, the ES sold off down to 6788.00 at 3:42 and traded 6798.75 as the 3:50 imbalance showed $3.3 billion to sell. It then sold off down to 6783.00, rallied back up to 6800.00, and traded 6801.75 on the 4:00 cash close.
After 4:00, the ES traded 6808.50 and then sold off down to 6781.50, rallied up to 6792.50 at 4:20, and settled at 6787.75 on the 5:00 futures close, up 44.00 points or +0.65%. The NQ settled at 24,905.50, up 235.25 points or +0.95%, the YM settled at 47,620, up 431 points or +0.91%, and the RTY settled at 2537.60, up 25.20 points or +1.00% on the day.
In the end, it was a highly volatile, high-volume session with hundreds of buy and sell programs. In terms of the ES’s overall tone, it firmed up, but it really looked like the NQ was the leader. In terms of the ES’s overall trade, 2.3 million contracts traded, with 826k of that coming from Globex.
Welcome to the world of CNW (Crazy Nuts & Wild).
Everything was moving…
Crude oil (CLJ26) settled at 94.77, which was 24.71 points or 20.68% off its high, after trading as high as 119.48 and selling off down to a low of 81.19.
Gold (GCH26) settled at 5091.50, down 54.60 points or -1.06%, after selling off from a high of 5160.60.
Bitcoin (BTH26) settled at 69,205, up 910 points or +1.33%, after trading between a high of 69,750 and a low of 65,685, leaving it 545 points or 0.78% off its high of the session.
The Dollar Index ($DXY) settled at 99.18, up 0.19% on the day, after trading between a high of 99.69 and a low of 98.70, while marking its ninth positive close in 15 sessions for a total gain of 2.03 points (+2.09%).
The 10-year U.S. Treasury note futures (ZNM26) made a high of 112’21 and settled at 112’115, down -0’025 (-0.07%).
The 30-year U.S. Treasury bond futures closed at 115’19, down -0’19 (-0.51%) in some instances.
Live cattle futures (LE APR-2026) closed around 230.125 to 230.725, down -3.85 to -4.90 (-1.64% to -2.09%). Lean hogs futures (HE APR-2026) closed around 94.825 to 95, down -0.80 (-0.84%). Soybean meal futures were up +1.60 (+0.50%), while others were down -2.9 (-0.91%).
I think this is just a small glimpse of how the markets are moving, and despite Trump’s many statements about the successes of the war in Iran:
-
Military efforts are “very far ahead of schedule.”
-
The Iran war is a “short-term excursion.”
-
Iran’s naval power has been largely destroyed.
-
Iran’s air defenses have been “wiped out.”
-
The U.S. and Israel have “more to do” to achieve ultimate victory.
-
If Iran attempts to block the Strait of Hormuz, the U.S. would hit them “twenty times harder.”
-
Potential targeting of Iran’s electricity production.
-
A one-hour call with Vladimir Putin about the Middle East and Ukraine conflicts. where both expressed interest in a “swift political and diplomatic resolution” to the Iranian situation.
I think this is just another round of Trump’s imagination getting away from him.
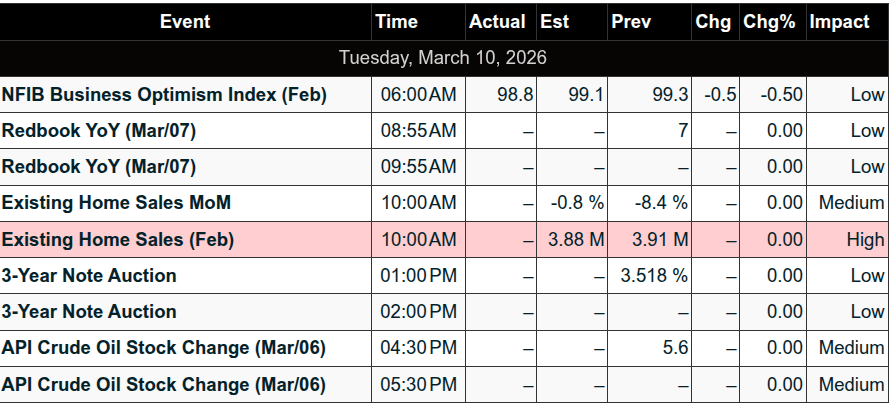
On Tap Today
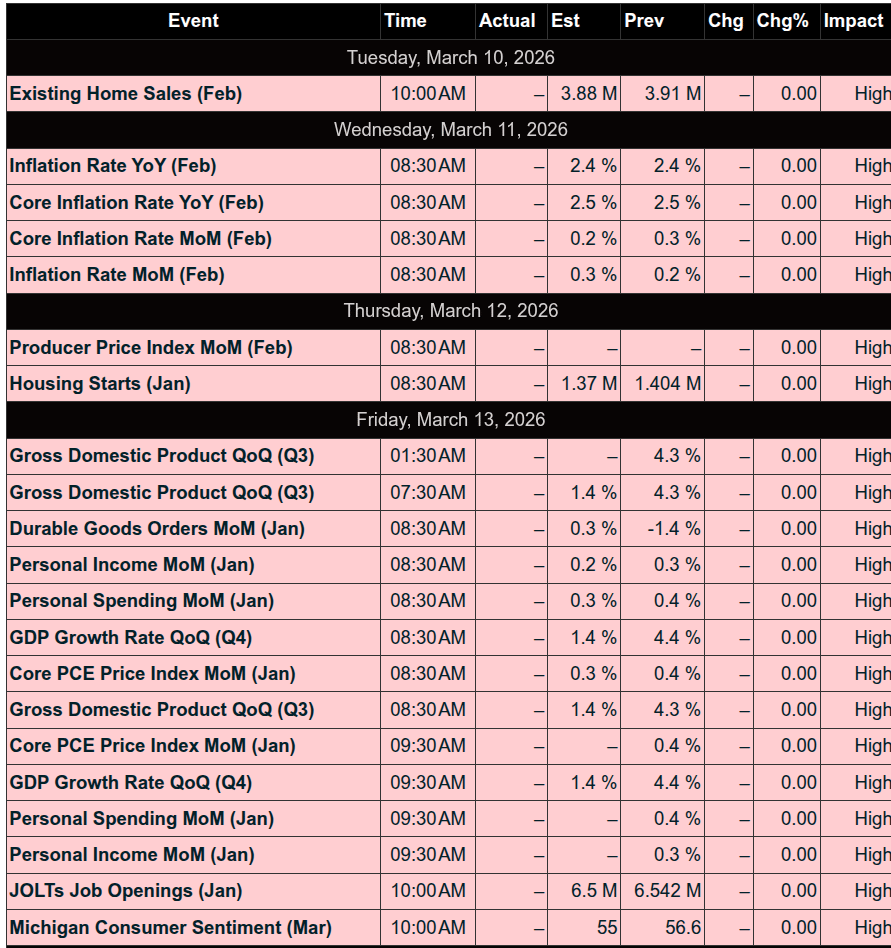
6:00 am: NFIB optimism index (Feb)
10:00 am: Existing home sales (Feb)
MiM
Market-on-Close Recap – MiM
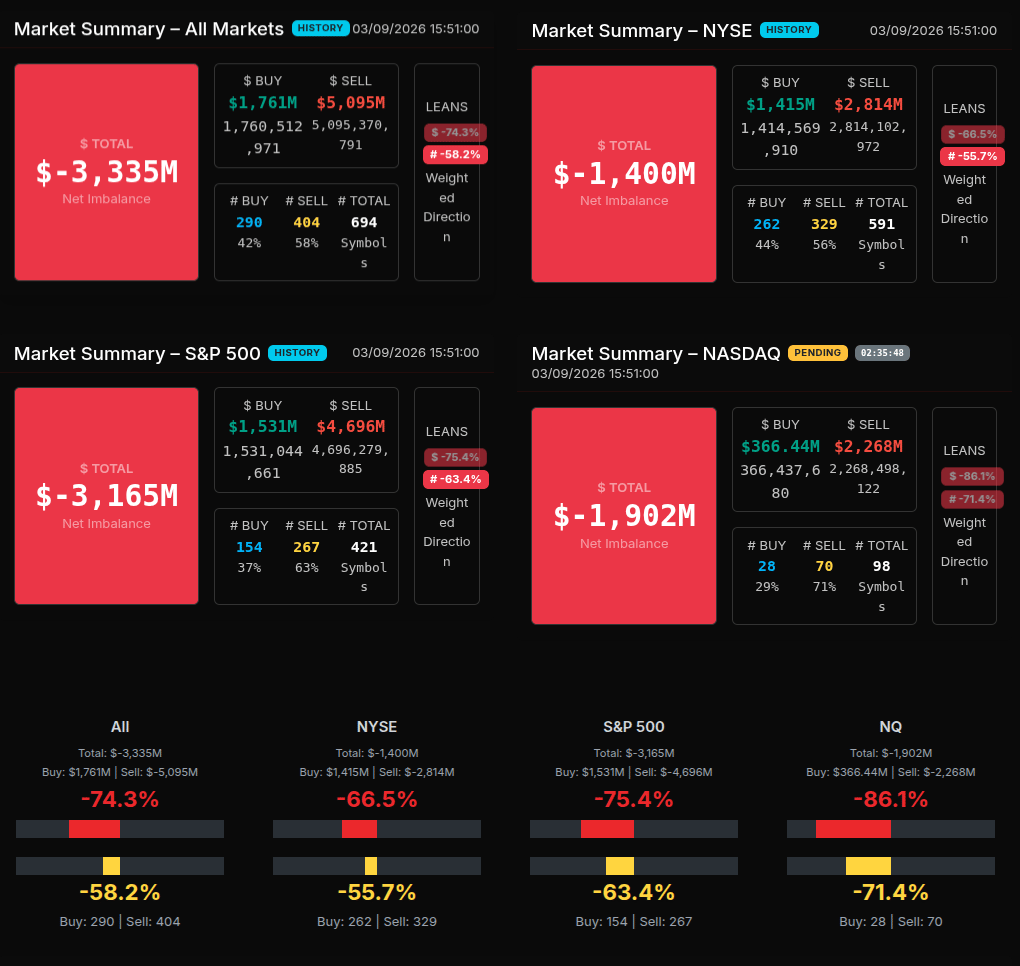
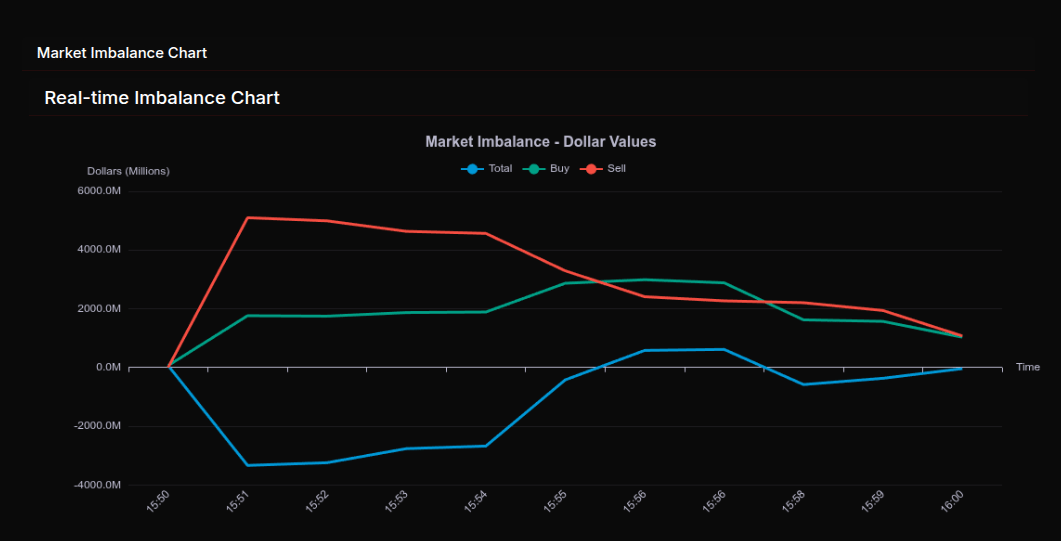
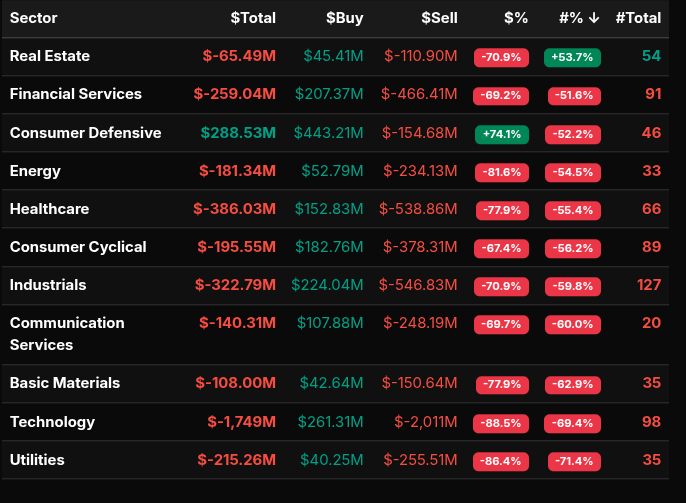
The closing auction developed with a clear sell-side bias that dominated most of the imbalance window before stabilizing into the final print. At 15:50, the market began with a modest $64M buy imbalance, but the tone shifted immediately as large sell programs entered the market. By 15:51, the imbalance flipped aggressively to -$3.33B with sell orders of $5.1B overwhelming $1.76B in buys. This established a strong sell-dominated environment that persisted through much of the auction process.
Through the middle of the window, the market showed persistent institutional liquidation. Between 15:51 and 15:54, the imbalance remained near -$2.6B to -$3.3B with dollar lean readings around -71% to -74%. Symbol breadth confirmed the selling pressure as roughly 58% of stocks leaned to the sell side. These readings fall into the wholesale category, indicating broad market distribution rather than simple rotational flows.
Around 15:55, the pressure began to moderate. Sell orders contracted and buyers stepped in, shrinking the net imbalance to -$423M. A brief flip to a buy imbalance occurred at 15:56 when buy orders surged to $5.86B versus $4.67B in sells, producing a +$1.19B net imbalance. However, this buy-side push proved temporary as the auction rotated back to the sell side into the final minutes, ultimately closing with a modest -$40M imbalance and a -51% dollar lean.
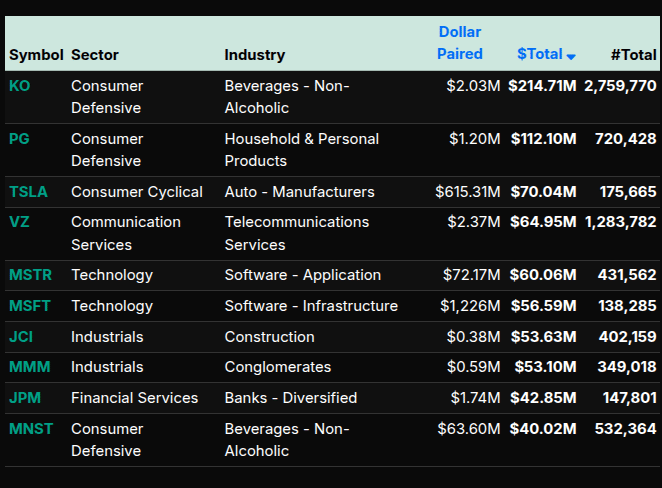
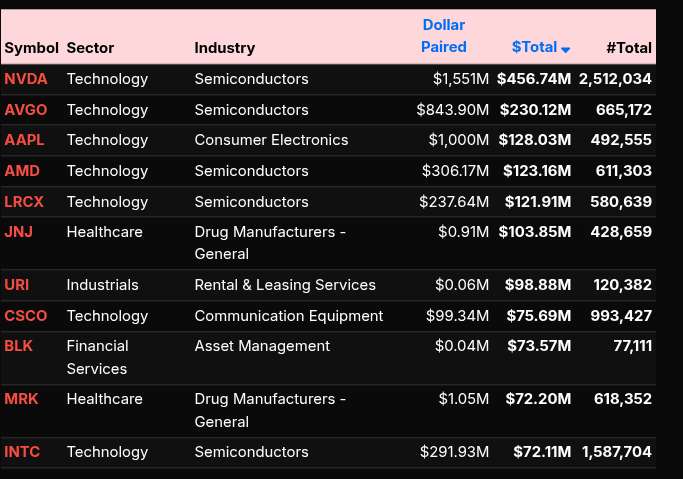
Sector participation showed broad institutional selling across the tape. Technology led the pressure with -$1.75B in net selling and an extreme -88.5% lean, highlighting heavy liquidation in semiconductor names. Healthcare (-$386M), Industrials (-$322M), Financials (-$259M), and Utilities (-$215M) all registered strong sell-side dominance with leans well beyond the -66% wholesale threshold.
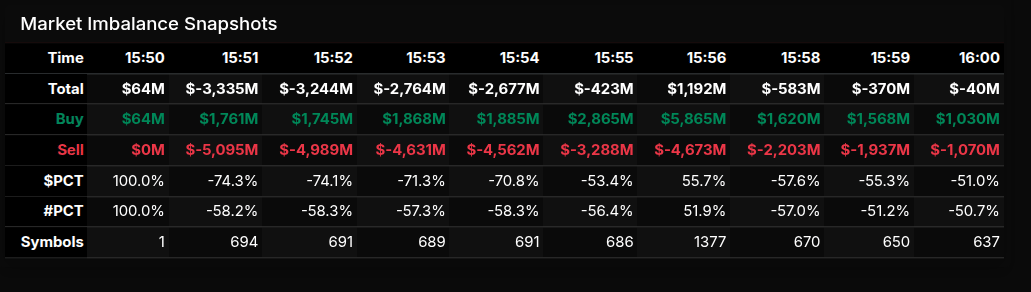
Consumer Defensive was the lone sector showing notable demand with +$288M and a +74% buy lean, suggesting defensive rotation late in the day.
On the symbol level, the selling pressure concentrated heavily in mega-cap technology. NVDA (-$456M), AVGO (-$230M), AAPL (-$128M), AMD (-$123M), and LRCX (-$122M) were among the largest sell imbalances. On the buy side, defensive and staple names stood out, including KO ($215M) and PG ($112M).
Overall, the MOC reflected broad risk reduction with institutions trimming exposure across cyclical and growth sectors while selectively rotating capital toward defensive names.
Technical Edge
Fair Values for March 10, 2026:
-
SP: 5.59
-
NQ: 25.59
-
Dow: 35.6
Daily Market Recap 📊
For Monday, March 9, 2026
• NYSE Breadth: 58% Upside Volume
• Nasdaq Breadth: 72% Upside Volume
• Total Breadth: 66% Upside Volume
• NYSE Advance/Decline: 45% Advance
• Nasdaq Advance/Decline: 55% Advance
• Total Advance/Decline: 51% Advance
• NYSE New Highs/New Lows: 53 / 125
• Nasdaq New Highs/New Lows: 79 / 283
• NYSE TRIN: 0.57
• Nasdaq TRIN: 0.48
Weekly Breadth Data 📈
For Week Ending Friday, March 6, 2026
• NYSE Breadth: 39% Upside Volume
• Nasdaq Breadth: 54% Upside Volume
• Total Breadth: 48% Upside Volume
• NYSE Advance/Decline: 26% Advance
• Nasdaq Advance/Decline: 32% Advance
• Total Advance/Decline: 30% Advance
• NYSE New Highs/New Lows: 320 / 160
• Nasdaq New Highs/New Lows: 318 / 550
• NYSE TRIN: 0.54
• Nasdaq TRIN: 0.39
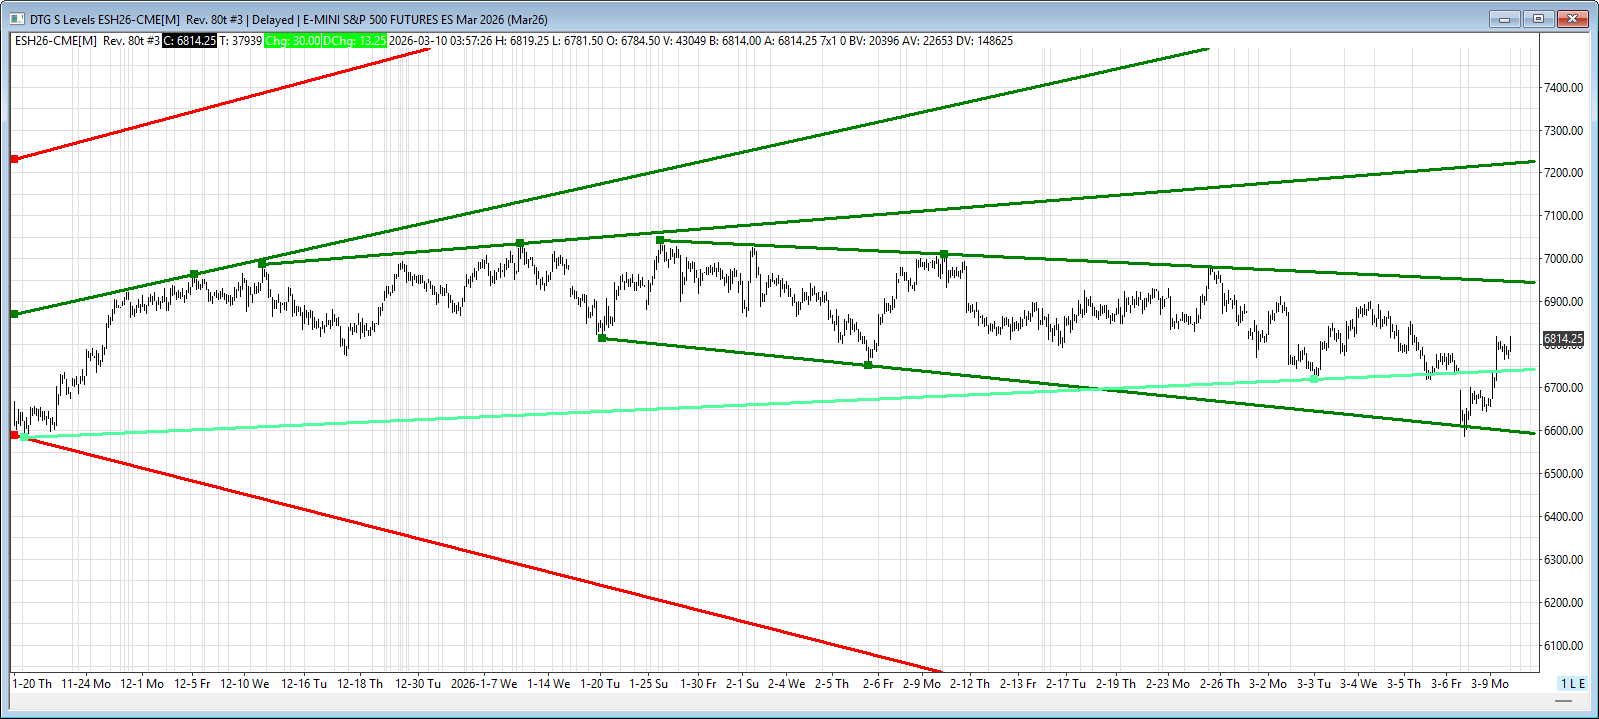
ES & NQ Levels (Premium only)

ES – H26 Levels
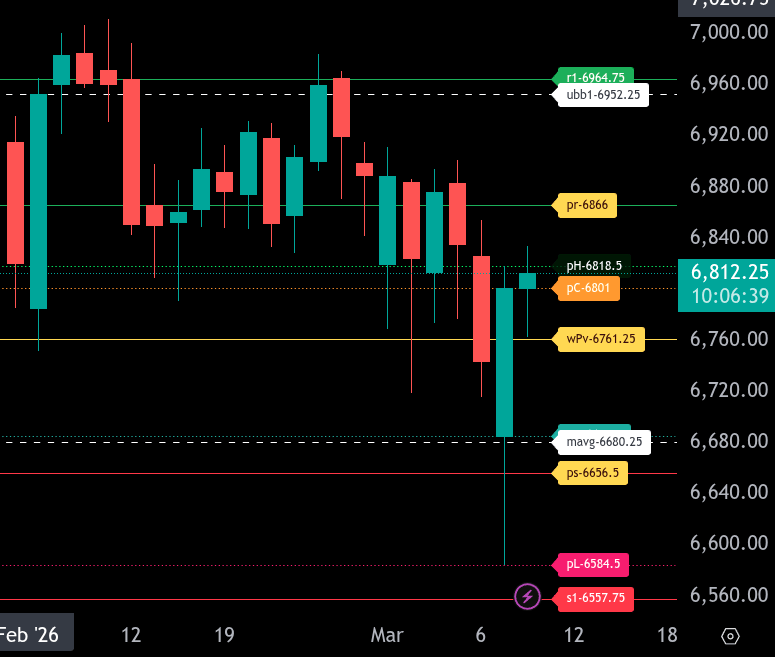
The bull/bear line for NQ is at 6761.25. This remains the key level that separates bullish and bearish conditions. As long as price holds above this level, the market maintains a constructive tone and buyers are likely to defend pullbacks toward it.
NQ is currently trading around 6812.75 after a sharp rebound from the overnight lows. Immediate resistance sits near 6818.50, followed by 6866.00, which represents today’s upper range target. If buyers can push through 6818.50 and sustain momentum, a move toward 6866.00 is likely. Beyond that, additional resistance levels come in at 6952.25 and 6964.75.
On the downside, initial support sits near 6801.00. A failure to hold this level could bring price back toward the 6761.25 bull/bear line. If the market loses this key level, downside pressure could accelerate toward 6685.50 and the moving average near 6680.25.
The lower range target for today sits at 6656.50. A break below that level would signal deeper weakness and open the door for a move toward 6584.50 and potentially 6557.75.
Overall, the market is attempting to stabilize after a strong downside move. Holding above 6761.25 keeps the recovery intact, while rejection below that level would shift momentum back to the bears and increase the probability of testing the lower support levels.
NQ – H26 – Levels
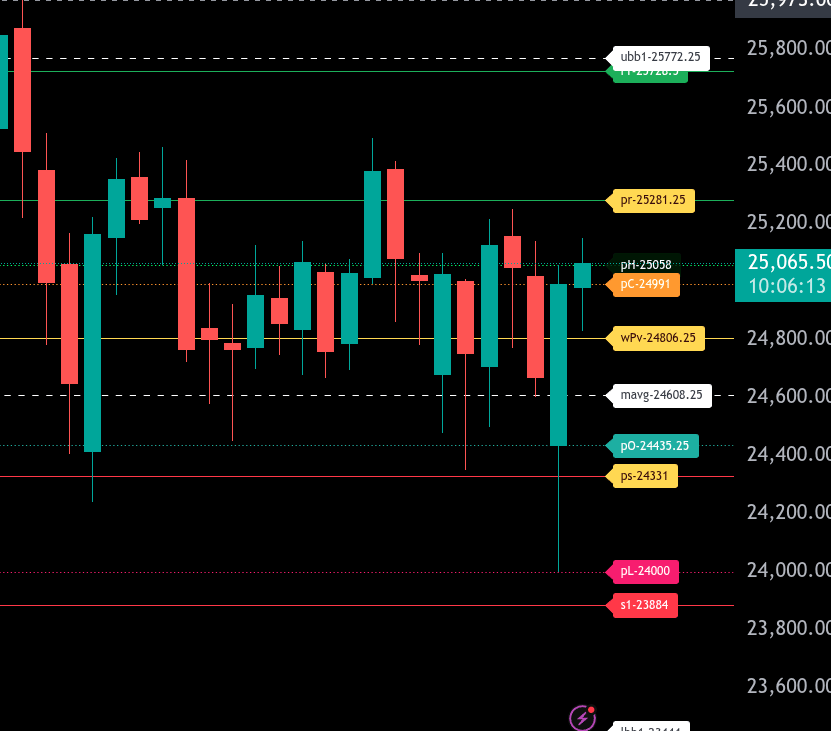
The bull/bear line for the NQ is at 24806.25. This level is the key pivot for today and will determine whether buyers can regain control after the recent volatility.
NQ is currently trading around 25062.25, which places price above the bull/bear line and suggests short-term strength. As long as the market holds above 24806.25, buyers may look for continuation toward higher resistance levels.
Initial resistance sits near the prior high at 25058.00, which the market is currently testing. A sustained move above this area opens the door to 25281.25, our upper intraday range target. If momentum builds above that level, the market could extend toward 25728.50.
On the downside, the first support remains the bull/bear line at 24806.25. A failure back below this level would shift the tone back to bearish and could lead to a move toward 24608.25 and then 24435.25. Our lower intraday range target sits at 24331.00, and a break below that level would expose deeper downside toward 24000.00.
Overall, the market holds a constructive tone while above 24806.25, but traders should be aware that losing this level could quickly accelerate selling pressure toward the lower range targets.
Calendars
Economic Calendar
Today
Important Upcoming
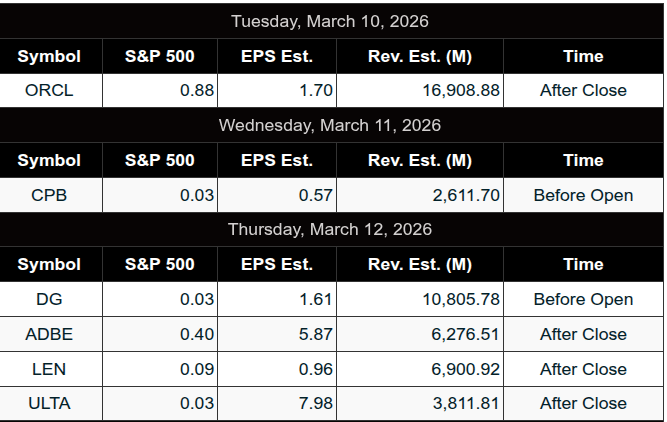
Earnings
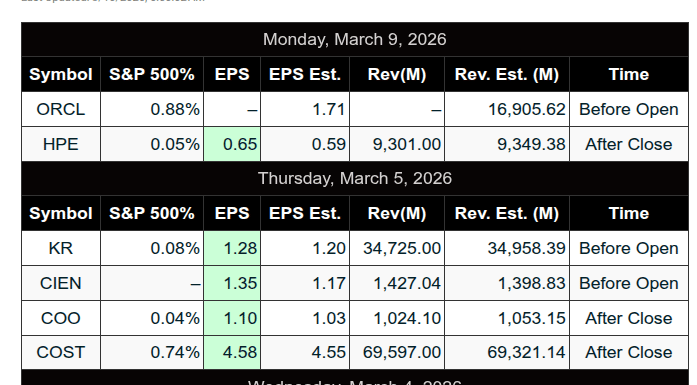
Recent
Trading Room Summaries
Polaris Trading Group Summary – Monday, March 9, 2026
The trading day unfolded as a textbook execution of the PTG Three-Day Cycle framework, with the morning structure and key levels identified in advance during the DTS briefing playing out almost precisely as anticipated.
Pre-Market Context
David highlighted 6585 as the key structural level coming into the session. The market quickly tested that level early and reversed higher (“tagged, bagged, and gagged”), confirming buyer support and setting the tone for the day.
The early framework established that traders should observe acceptance vs. rejection around key structure rather than anticipate direction prematurely.
Early Session Trades
The room saw immediate opportunity across several markets:
-
CL (Crude Oil) Open Range Short at $100 triggered early and quickly reached its downside targets, providing a clean early win.
-
ES and NQ Open Range trades also performed well, with Target 1 reached and stops moved to breakeven, reinforcing disciplined trade management.
David defined the early ES “sandbox” between 6665–6695, helping traders frame short-term rotational behavior.
Meanwhile, members highlighted that trend conditions favored A3-style continuation trades, particularly on MES, emphasizing adapting strategy to market conditions.
Key Structural Pivot
A major focus of the session was the 6650 ±5 pivot (LIS).
David laid out the conditional roadmap clearly:
Bull Case
-
Acceptance above 6650
-
Upside objectives: 6670 → 6680 → 6690
Bear Case
-
Acceptance below 6650
-
Downside rotation targets: 6625 → 6620 → 6610
Buyers ultimately defended the pivot, keeping the bull case intact.
Midday Market Behavior
Price action transitioned into expected consolidation and “back-and-fill” trade, which David noted was consistent with the game plan.
Additional key level:
-
Prior Low (PL): 6715.75
The first test produced expected rejection, reinforcing that markets often need multiple attempts to reclaim major levels.
A key psychological reminder was reinforced: “Panicans ALWAYS lose.”
The room focused on staying aligned with structure rather than reacting emotionally to intraday swings.
Afternoon Breakout – The Squeeze
Following lunch, the market successfully:
-
Backtested the prior high
-
Converted it to support
-
Initiated the anticipated short squeeze
David had already outlined the larger target earlier in the day:
Goal: Reclaim Cycle Day 1 Low – 6777
As the squeeze accelerated late in the afternoon, the market completed the full recovery to 6777, validating the Three-Day Cycle statistical expectation (~92.5%).
David summed it up with:
“BOOM — Cycle Day 1 6777 recovery.”
Key Lessons from the Session
1. Structure First
-
The 6585 reaction and 6650 pivot controlled the entire session.
2. Trust the Cycle
-
The Three-Day Cycle recovery to 6777 played out exactly as anticipated.
3. Let the Market Reveal Control
-
Instead of predicting, the room watched acceptance vs. rejection at key levels.
4. Manage Trades Professionally
-
Early trades locked gains and moved stops to breakeven.
-
Emphasis remained on consistent 5–10 point executions rather than greed.
5. Patience Through Consolidation
-
The midday consolidation was part of the plan, not a reason to abandon the thesis.
End-of-Day Notes
-
Large MOC Sell Imbalance: $3.3B
-
Despite the imbalance, the core thesis had already fully played out.
-
David called it a “Monster Day for the Three-Day Cycle Game Plan.”
Overall Takeaway
This session was a model example of the PTG methodology working from plan to execution:
-
Key level identified pre-market
-
Pivot defended
-
Consolidation respected
-
Short squeeze triggered
-
Cycle target achieved
A strong reminder that structured preparation and patience allow traders to capture the larger move rather than overtrading the noise.
Discovery Trading Group Room Preview – Tuesday, March 10, 2026
Geopolitics Driving Volatility
-
Market Focus: Ongoing Middle East conflict, President Trump’s comments, and oil price volatility remain the primary drivers for markets.
-
Oil & Geopolitics:
-
Monday saw extreme volatility as oil spiked near $120 before plunging to around $88 after Trump suggested the war with Iran is already significantly advanced.
-
Trump warned the U.S. would escalate attacks if Iran disrupts oil supplies and said additional “important targets,” including electricity facilities, could be hit if the conflict continues.
-
The Strait of Hormuz remains largely closed, contributing to global supply concerns.
-
Trump also discussed with Vladimir Putin the possibility of loosening restrictions on Russian oil to help ease shortages.
-
-
Iran Leadership Update:
-
Iranian media named Mojtaba Khamenei, son of Ayatollah Ali Khamenei, as the new supreme leader.
-
The Islamic Revolutionary Guard Corps pledged full support.
-
Trump expressed dissatisfaction with the choice and urged Iran to select leadership willing to pursue peace.
-
-
Washington Developments:
-
Several Democratic senators are attempting to delay Senate business until Secretary of State Marco Rubio and Defense Secretary Pete Hegseth testify about the justification for U.S. strikes on Iran.
-
-
Corporate News:
-
Taiwan Semiconductor (TSMC) reported sales up 30% in the first two months of the year, highlighting continued strength in AI infrastructure demand.
-
-
Earnings:
-
Premarket: NIO, KEP
-
After the close: Oracle (ORCL)
-
Wednesday morning: HMY, KB
-
-
Economic Data Today:
-
8:15 AM ET: ADP Employment Change
-
10:00 AM ET: Existing Home Sales
-
-
Volatility & Flow:
-
Market volatility continues to rise due to Iran-related headlines.
-
ES 5-day average daily range jumped to 157.25 points Monday.
-
Whale bias leaning bearish into the U.S. open with lighter overnight large trader volume.
-
-
Technical Levels (ES):
-
ES rebounded Monday and closed back above the 200-day MA (~6690), which remains key long-term support.
-
Price is currently midway within the short-term downtrend channel, leaving room for both bullish and bearish moves.
-
Resistance: 6944–6949, 7230–7235
-
Support: 6600–6605
-
Affiliate Disclosure: This newsletter may contain affiliate links, which means we may earn a commission if you click through and make a purchase. This comes at no additional cost to you and helps us continue providing valuable content. We only recommend products or services we genuinely believe in. Thank you for your support!
Disclaimer: Charts and analysis are for discussion and education purposes only. I am not a financial advisor, do not give financial advice and am not recommending the buying or selling of any security.
Remember: Not all setups will trigger. Not all setups will be profitable. Not all setups should be taken. These are simply the setups that I have put together for years on my own and what I watch as part of my own “game plan” coming into each day. Good luck!
This post goes out as an email to our subscribers every day and is posted for free here around 2 PM ET. To get your real-time copy, sign up for the free or premium version here: Opening Print Subscribe.
Comments are closed