This post goes out as an email to our subscribers every day and is posted for free here around 2 PM ET. To get your real-time copy, sign up for the free or premium version here: Opening Print Subscribe.
Follow @MrTopStep on Twitter and please share if you find our work valuable!
Our View
With the official start of the rollover today, a much larger economic calendar, the high-pitched war in the Middle East, and the largest quarterly options expiration in the history of the markets on Friday, you may need to keep your Depends handy.
I have stayed away from downside targets, but if the ES keeps going down like it is I have 6350 to 6300 in mind. I know there is a lot of risk in projecting lower prices after the ES has been down so much, but this is where it’s at as of Friday:
Over the last 12 sessions, the ES has closed down in 10 of them, posting positive points of +108.50 and negative points of -417.25 for a net change of -308.75 points and a total percentage loss of 4.49%. The largest daily loss was -102.00 (-1.50%), while the largest daily gain was +57.25 (+0.85%).
Meanwhile, the NQ has closed down in 8 of the last 12 sessions, with positive points of +714.75 and negative points of -1,642.00, resulting in a net change of -927.25 points and a total percentage loss of 3.67%. Its largest daily loss was -423.50 (-1.70%), and the largest daily gain was +372.50 (+1.50%). Geopolitical tensions and oil-driven risk-off flows continue to pressure both indices—ES hovering near the 6,625 area and NQ around 24,335 after recent lows.
The last comparable sell-off of this magnitude for the ES (S&P 500 futures, down ~4.49% net over 12 sessions with 10 down days and a -308.75 point net drop) occurred during the April 2025 tariff-induced turmoil, when the S&P 500/ES saw sharp multi-day declines (including over 12% in just four days in early April 2025, part of a broader ~19% drawdown from February highs). That period featured heavy consecutive losses amid trade/geopolitical fears, similar to the current oil/Middle East-driven risk-off pressure.
For the NQ (Nasdaq-100 futures, down ~3.67% net over 12 sessions with a -927 point net drop), the most recent similar stretch aligns with the same April 2025 event, where tech-heavy indices whipsawed violently (e.g., Nasdaq fell as much as 5.2% intraday in sessions, contributing to steep short-term drawdowns).
Prior to that, notable periods with comparable or larger short-term pressure (e.g., 10–20%+ corrections over weeks/months) include the 2022 bear market lows, the 2020 COVID crash (far steeper, ~34% peak-to-trough), and the 2008 financial crisis, but nothing exactly matched this 12-session pattern recently until the 2025 tariff shock.
The Good, The Bad and the Ugly
Our Lean
I do not want to get ahead of myself, but the recent low is 6584.50, set on 03/05/26, 5 sessions ago. On the 1-year chart, it looks like there is an air pocket down to the 6500 area.
I asked Grok if the ES kept going down over the next 5 sessions, where would it go? It came back with this:
Arithmetic projection (simple average daily loss applied linearly): Expect a further drop of around -128.65 points total. From the recent close/settlement near 6,625–6,636 (e.g., settled ~6,636 on March 13, with last trades in the 6,625 zone), this would put ES around 6,497–6,507 after 5 more down sessions.
Compounded percentage projection (more realistic for ongoing percentage-based moves): At the average daily % loss of ~0.374%, the compounded decline over 5 sessions would be about -1.88%, leading to a level around 6,500–6,510 (starting from ~6,625–6,636).
I came up with 6500 on my own, and then I asked where it would go if it kept going down over the next 10 sessions, and it came up with this:
Linear point projection (simple average daily loss): A further drop of around -257 points total. From the recent settlement/close near 6,625–6,636 (e.g., settled ~6,636 on March 13, with levels trading in the 6,625 zone), this would target roughly 6,368–6,379.
Compounded percentage projection (more accurate for sustained % moves): At ~0.374% average daily loss, the compounded decline over 10 sessions would be about -3.68%, putting ES around 6,381–6,392 (starting from ~6,625–6,636).
I want to make something perfectly clear: I honestly have no idea whether the next 100 to 200 points will down, nor can I rule out the next 100 to 200 going back up. What I do feel strongly about is that the ES acts shitty and the news is shitty.
I also do not think the ES has acted this badly since the AI bubble selloff in October, and then I would have to go back to April. Either way, I think we can all agree that until the war is resolved, the dark cloud of uncertainty will continue to haunt the markets.
I also want to say all of this is my idea, I have not copied anything from anything, but I do use AI to further my point.
Our lean is the same. I can not rule out a big dead cat bounce,Q but I believe it will get sold.
Claude AI ES Market Profile Structural Map: 3/13/2026
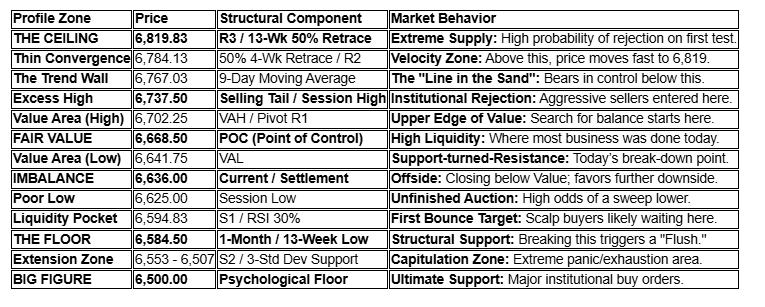
Advanced Profile Insights:
The “b-Shape” Logic: Today’s profile is a classic Long Liquidation (b-shape). The POC at 6,668.50 is significantly higher than the Close at 6,636.00. This tells us that the “fair price” was higher, but the market lacked buyers at the end of the day, causing a “slump.”
The Unfinished Auction (6,625): Because the low at 6,625 is a “Poor Low” (meaning it wasn’t a sharp V-bottom), the auction is considered incomplete. The market “wants” to find a price lower than 6,625 to see where aggressive buyers actually live.
Gap Management: There is a Low Volume Node (LVN) between 6,707 (R1) and 6,737 (High). If price manages to clear 6,710, it will likely “vacuum” up to 6,737 very quickly because there is no volume (support/resistance) in that gap.
Our Lean
If it’s not one thing, it’s another.
Last Friday, BlackRock limited redemptions at a private credit fund as outflows swell. I would not say this is new news, but it is another negative to add to the list of many. @HandleStats told me if March closes lower, it could end up a down year. I continue think the more intense and longer the war in the Middle East drags on, the more it will cast a high level of uncertainty over the ES and NQ.
Our lean: Most of the gaps have been tradable on the open or the first move above or below the gaps. What I do know is that the dead cat rallies continue to get sold, whether or not the US or Iran is willing to call it quits.
Market Recap
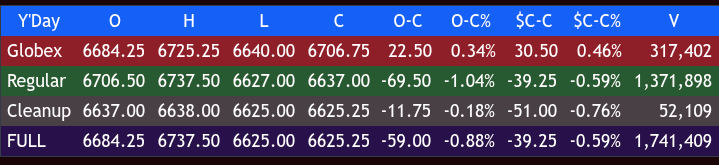
As I said in the LEAN on Friday, when the ES closes weak, like it did Thursday, it tends to rally on Globex. The futures made a low at 6640.00 and rallied all the way up to 6725.25 at 8:45 am and opened FRYday’s regular session at 6706.50, up 30.25 points or +0.45% with 632k contracts traded.
After the open, the ES traded 6703.50, rallied up to 6737.50 at 9:45, made a few lower highs, and sold off down to 6691.00 as crude oil moved higher at 10:15. It then rallied back up to a lower high at 6716.50, flunked down to 6659.00 at 11:00, rallied up to 6683.25 at 11:10 and then flunked again down to 6644.00 at 11:55. This was followed by another rally up to 6663.50 at 12:10, traded sideways to up, traded 6666.50 at 12:35, sold off to 6645.00 at 1:05, rallied up to 6665.00 at 1:15 and then sold off down to a new low at 6634.50 at 1:50.
The ES then rallied up to 6662.00 at 2:50, sold off down to a new low at 6627.00 at 3:40 and traded 6632.50 as the 3:50 cash imbalance showed $1.3 billion to buy. The ES traded 6638.75 at 3:55 and 6637.00 on the 4:00 cash close, down 69.50 points or -1.04%.
After 4:00, the ES sold off down to 6628.00 and settled at 6636.00, down 41.50 points or -0.62%. The NQ settled at 24,394.25, down 165.75 points or -0.67%, the YM settled at 46,592, down 129 points or -0.28%, and the RTY settled at 2480.90, down 10.10 points or -0.41% on the day.
In the end, it was a gap up, a double pump up, and then a big sell for the rest of the day. In terms of the indexes’ overall tone, they were weak and another good example of how the dead cat bounces continue to fail. In terms of the ES’s overall trade, volume was high at 2.272 million contracts traded, but part of the higher volume came from the ESH/ESM rollover.
When I showed the number of days up and down and the total point and % loss, it was about the total weakness that the ES, NQ, YM and RTY have been going through over the past 2+ weeks. Sometimes it doesn’t matter what we think because the “numbers” don’t lie. As you know, I am a bull guy, I like buying the pull-backs, but even before the war started in the Middle East, I started saying I had become a pessimistic bull, but I haven’t said that for a while.
The war has become very destabilizing and the “unknowns” continue to cast dark clouds over both the global stock markets and the sustainability of the US economy. While some US economic indicators are showing inflation has dropped, it is not showing up in food prices.
-
Shelter/housing costs (rent and owners’ equivalent rent): One of the largest CPI components, often “sticky”—up steadily (e.g., around 2.5–4%+ in recent periods), with no deflation.
-
Food away from home (restaurant meals, dining out): Up ~3.9–4.6% year-over-year in recent data, driven by labor and other costs.
-
Utilities and household energy services (electricity, piped natural gas): Electricity up ~4.8–6.7%, natural gas up significantly (e.g., 10%+ in some reports).
-
Motor vehicle insurance: Persistently rising (e.g., 2.8%+), though sometimes moderating.
-
Medical care services and healthcare costs: Sticky and often higher due to structural factors.
-
Certain food items (e.g., nonalcoholic beverages, coffee/tea, meats/poultry/fish in some periods): Up 3–5%+ overall for food categories, with subsets like beverages showing stronger gains.
-
Home insurance and related services: Noted as driving price gains in breakdowns.
-
Car maintenance/repairs and transportation services: Often cited in uneven inflation visuals as upward pressure.
-
Oil — The biggest mover. Brent crude has surged dramatically (from pre-war levels around ~$70–75 to over $103–104 per barrel as of March 13, with intraday highs pushing higher). This reflects the Strait of Hormuz closure, damaged facilities (e.g., in Iran, potential hits to Saudi/Qatar infrastructure), halted LNG/production in places like Qatar, and supply fears. Analysts warn of potential spikes to $120–150+ if prolonged; forecasts for 2026 have been revised upward (e.g., Goldman Sachs/Fitch to ~$70–71 average, but with risks much higher short-term). U.S. gasoline prices are already climbing fast.
-
Natural gas/LNG — Disruptions in the Gulf have halted some output and shipping, pushing prices higher.
-
Other energy/related — Shipping freight rates (e.g., tankers) have exploded due to risk premiums and rerouting.
-
Agricultural commodities — Indirect but notable rises: Corn, soybeans, wheat up several percent (e.g., 2–6%+ in recent sessions) from higher energy/fertilizer costs (Gulf fertilizer production/exports disrupted → urea/phosphate shortages). Palm oil and soybean oil also surged (up to 10% in spots).
-
Gold — Safe-haven demand has driven it higher, with some projections to $5,600–6,200/oz amid geopolitical risks.
Finding a silver lining is difficult when balancing domestic credit concerns against the staggering $2 billion daily cost of the war with Iran, with current projections for Operation Epic Fury now ranging between $25 billion and $30 billion.
Despite assertions that the U.S. has met its primary objectives, the air campaign remains intensive. As of March 13, forces have hit between 6,000 and 7,000 distinct targets, including approximately 4,700 specific missile strikes and nearly 2,000 hits on “regime headquarters” following the opening salvo that assassinated Supreme Leader Ali Khamenei.
While U.S. officials maintain that Iran’s offensive capabilities are 90% degraded, the theater remains volatile as Iran continues to launch sporadic drone and missile counter-attacks against U.S. bases in Bahrain, Qatar, and Kuwait, though intelligence reports indicate this retaliatory momentum has recently begun to slow.
I guess the question is … who do you believe?
Economic Calendar (Week Ahead)
The week ahead has a much larger, more important economic calendar
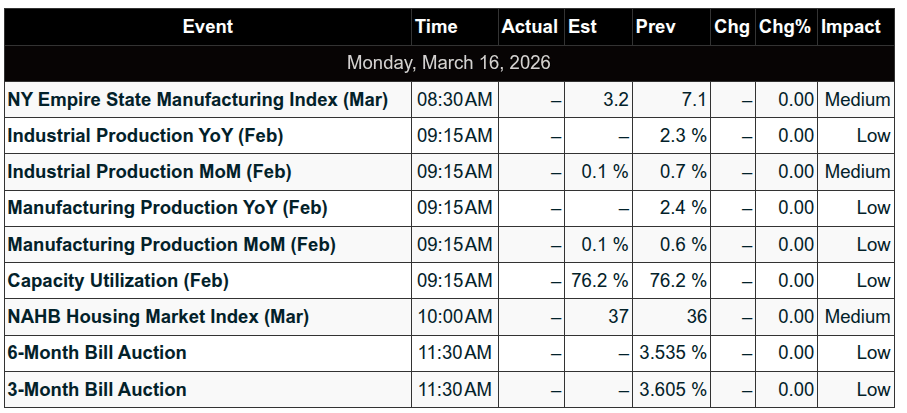
Monday, March 16
8:30 am: Empire State manufacturing survey
9:15 am: Industrial production
9:15 am: Capacity utilization
Tuesday, March 17
10:00 am: Pending home sales
10:00 am: Home builder confidence index
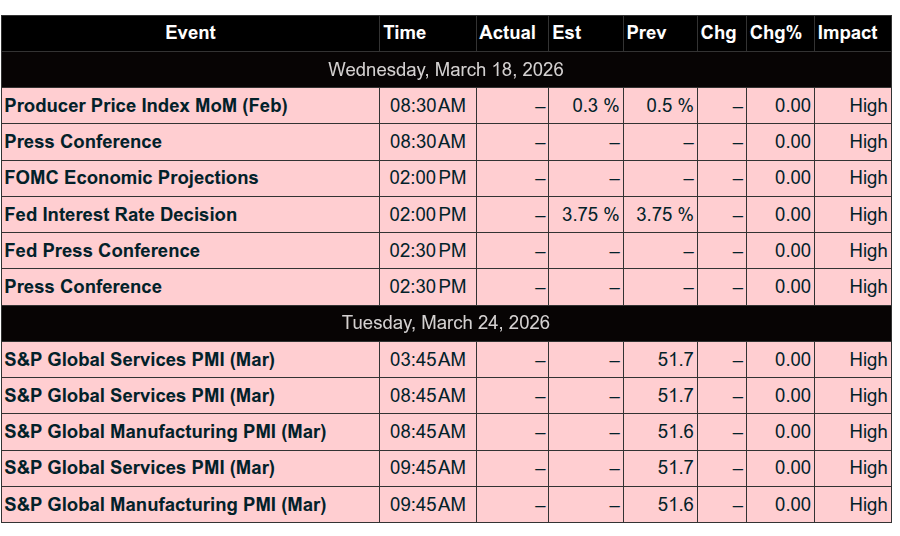
Wednesday, March 18
8:30 am: Producer price index
8:30 am: Core PPI
8:30 am: PPI year over year
8:30 am: Core PPI year over year
10:00 am: Factory orders
2:00 pm: FOMC interest-rate decision
2:30 pm: Fed Chair Powell press conference
Thursday, March 19
8:30 am: Initial jobless claims
8:30 am: Philadelphia Fed manufacturing survey
10:00 am: Wholesale inventories
10:00 am: New home sales
Friday, March 20
$7.1 Trillion March Quarterly Expiration (largest in history)

Guest Posts
Trey Oglesby – Weekly Charts
Goldman Sachs: How the Iran War Impacts the US Economy

Goldman Sachs Research expects the war in Iran and rising oil prices to modestly slow US GDP growth and boost inflation, even as the world’s largest economy is still forecast to avoid recession.
The Middle East conflict will mainly filter through the US economy through higher energy prices, with some additional impact from tighter financial conditions and a drag on hiring and investment from greater geopolitical risk, David Mericle, chief US economist, writes in a report.
History suggests that while conflicts have sometimes led to large spikes in oil prices that lasted for a while, their impact on financial conditions has usually been more limited and briefer, Mericle writes.
-
As of March 11, Goldman Sachs Research commodity strategists expect the price of Brent oil, the international benchmark, to average $98 a barrel in March and April—up from $61 at the end of 2025. They forecast that the price will fall back to $71 by the fourth quarter of this year.
-
In turn, our economists raised their forecast for December headline inflation in 2026 by 0.8 percentage point to 2.9%.
-
Goldman Sachs Research lowered its 2026 GDP growth forecast (fourth quarter over fourth quarter) by 0.3 percentage point to 2.2%. It also raised its estimated risk of recession over the next 12 months by 5 percentage points to 25%. That’s 10 percentage points above the unconditional long-term average risk of recession.
Webinar Replay:

MiM
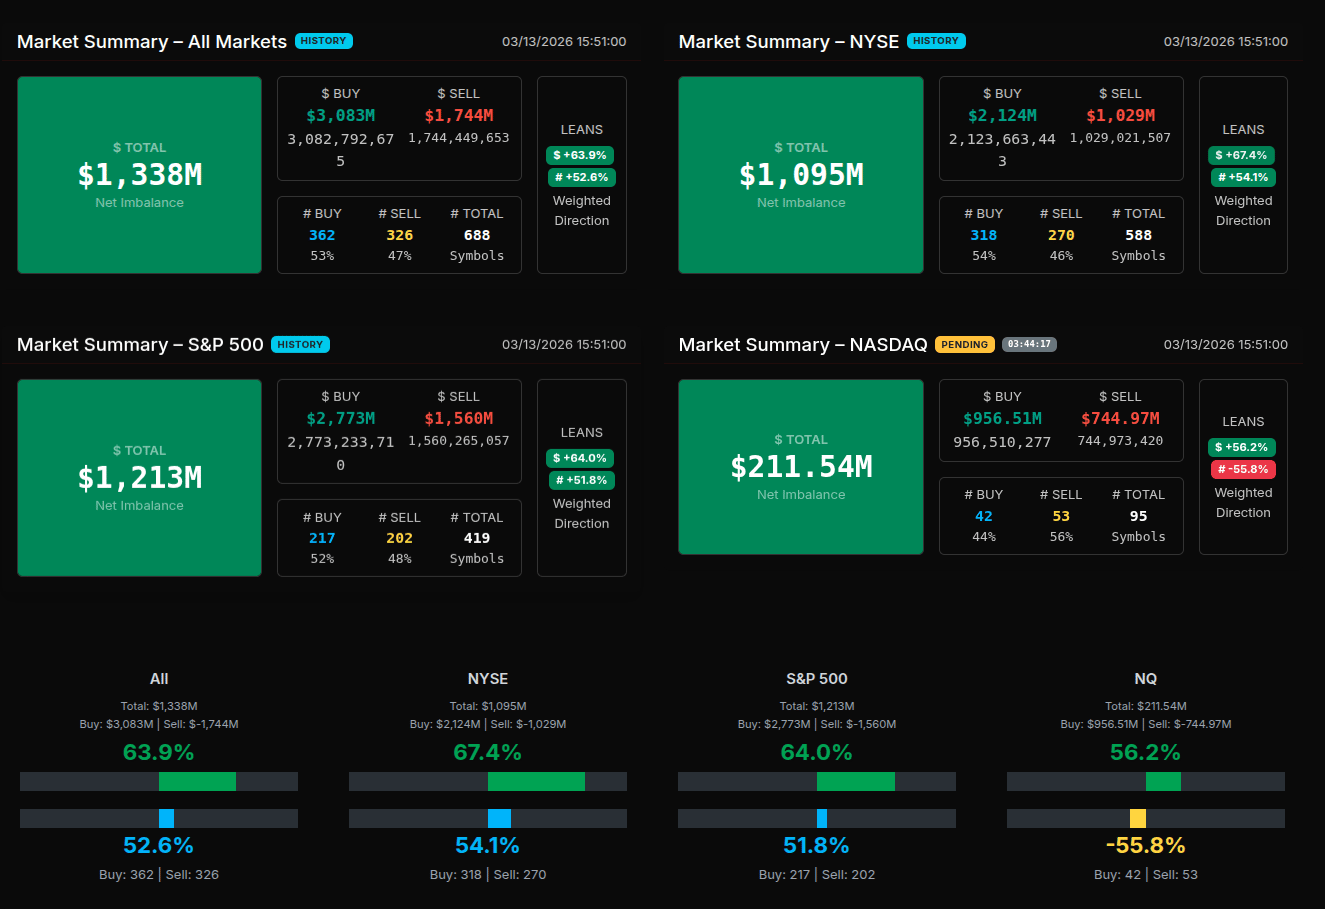
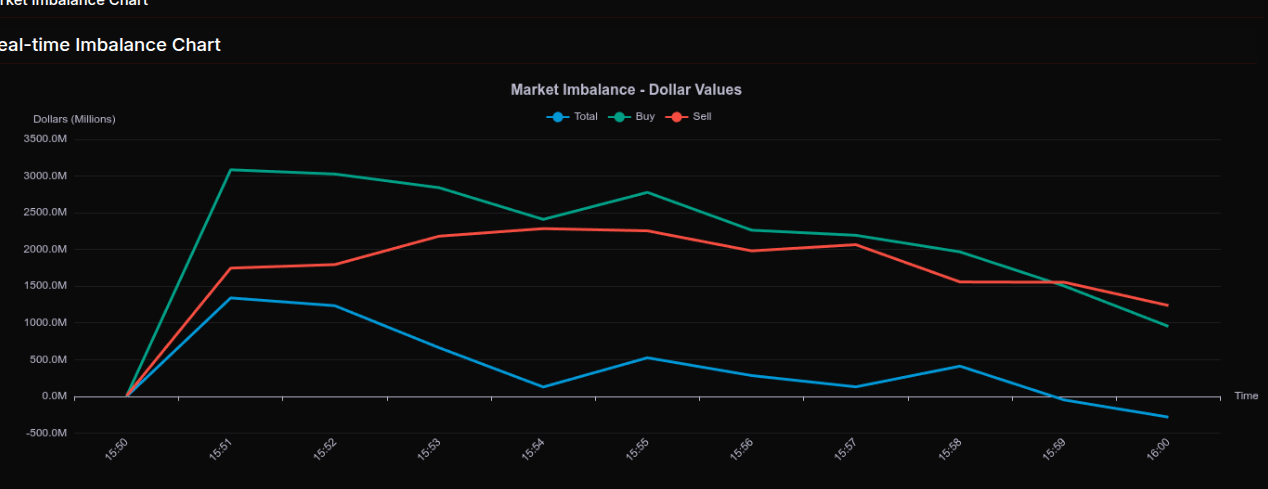
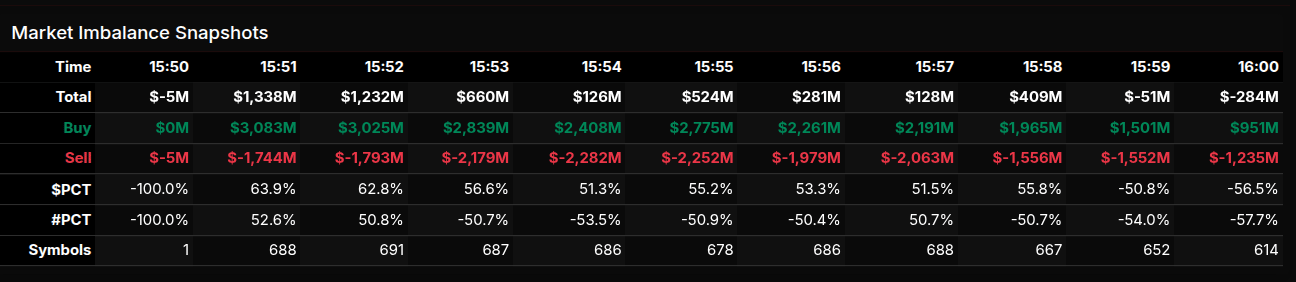
The March 13th Market-on-Close (MOC) auction developed as a strong buy program through most of the imbalance window before fading into a sell skew at the final print. Early indications showed aggressive institutional demand, particularly across cyclical and industrial sectors, before a late rotation pushed the final imbalance negative.
At 15:50, the market opened with only a modest $5M sell imbalance. One minute later, the auction dramatically flipped, with buy orders surging to $3.08B against $1.74B in sells, producing a net buy imbalance of $1.34B. From 15:51 through roughly 15:58, the auction maintained a consistent buy bias, with buy participation running between 51% and 64% of the total flow. During this window, the imbalance steadily compressed as sell interest increased, indicating that liquidity providers and late institutional sellers were gradually absorbing the buy pressure.
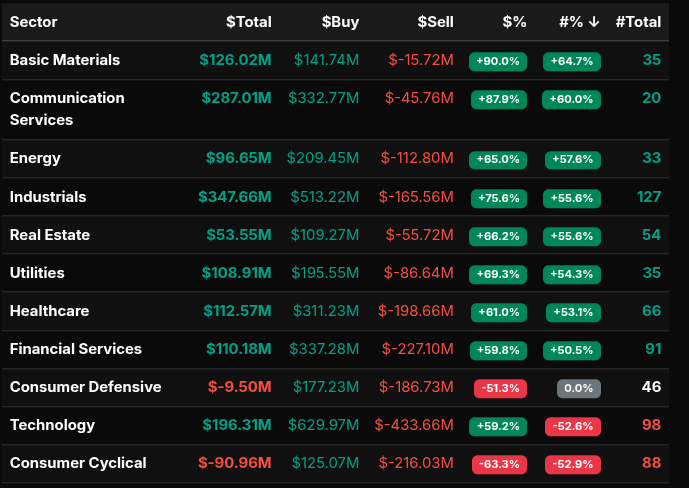
Sector participation confirmed this broad accumulation phase. Industrials led with $347.7M in net buying and a +75.6% directional lean across 127 symbols. Communication Services followed with $287M and an +87.9% lean, while Basic Materials printed the strongest directional reading at +90.9%, indicating near wholesale buying in that group. Energy, Utilities, and Real Estate all showed leans above +65%, reinforcing the view that the bulk of the market was participating in the closing buy program.
Technology flows were more mixed. Although the sector still finished with $196M in net buying, its weighted symbol participation flipped negative (-52.6%), suggesting heavy selling in several large technology names offset broader accumulation elsewhere. Consumer Cyclical also leaned strongly to the sell side at -63.3%, approaching the threshold where flows begin to resemble wholesale liquidation.
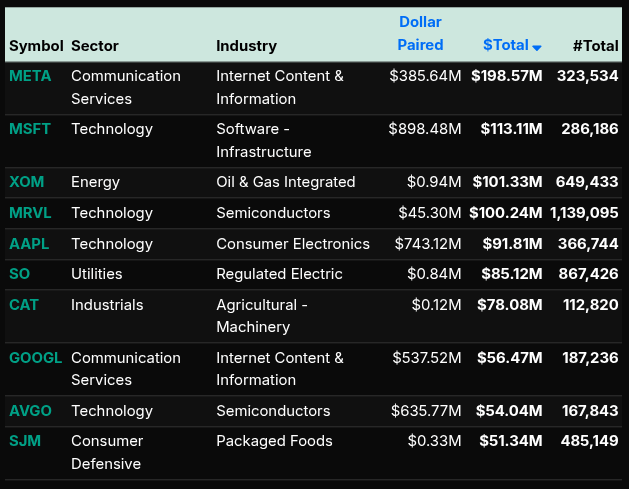
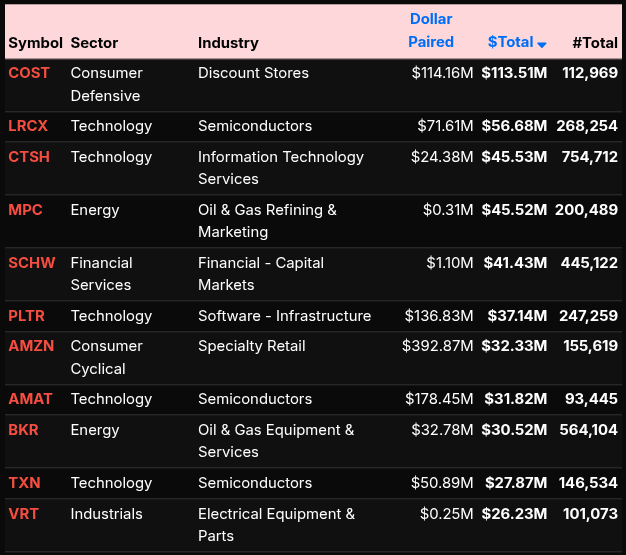
Individual symbol activity highlighted the institutional focus. META ($198.6M), MSFT ($113.1M), XOM ($101.3M), and MRVL ($100.2M) led the buy side, with strong semiconductor participation also appearing in AVGO and AAPL. On the sell side, COST (-$113.5M) and LRCX (-$56.7M) were among the largest imbalances.
Into the final minute, the imbalance abruptly reversed. At 15:59, the market flipped to a $51M sell imbalance and ultimately closed with approximately $284M to sell as sell orders overwhelmed the remaining buy interest. The transition from broad institutional buying to a late sell imbalance illustrates a classic closing rotation, where early demand is absorbed and the final auction clears through supply.
Technical Edge
Fair Values for March 16, 2026
-
SP: 52.97
-
NQ: 227.26
-
Dow: 315.7
Daily Breadth Data 📊
For Friday, March 13, 2026
• NYSE Breadth: 42% Upside Volume
• Nasdaq Breadth: 49% Upside Volume
• Total Breadth: 46% Upside Volume
• NYSE Advance/Decline: 37% Advance
• Nasdaq Advance/Decline: 35% Advance
• Total Advance/Decline: 36% Advance
• NYSE New Highs/New Lows: 42 / 105
• Nasdaq New Highs/New Lows: 53 / 273
• Total New Highs/New Lows: 95 / 378
• NYSE TRIN: 0.82
• Nasdaq TRIN: 0.59
Weekly Breadth Data 📈
For Week Ending March 13, 2026
• NYSE Breadth: 41% Upside Volume
• Nasdaq Breadth: 53% Upside Volume
• Total Breadth: 48% Upside Volume
• NYSE Advance/Decline: 22% Advance
• Nasdaq Advance/Decline: 31% Advance
• Total Advance/Decline: 28% Advance
• NYSE New Highs/New Lows: 151 / 226
• Nasdaq New Highs/New Lows: 226 / 575
• Total New Highs/New Lows: 377 / 801
• NYSE TRIN: 0.39
• Nasdaq TRIN: 0.41

Today’s BTS Levels:
ES H
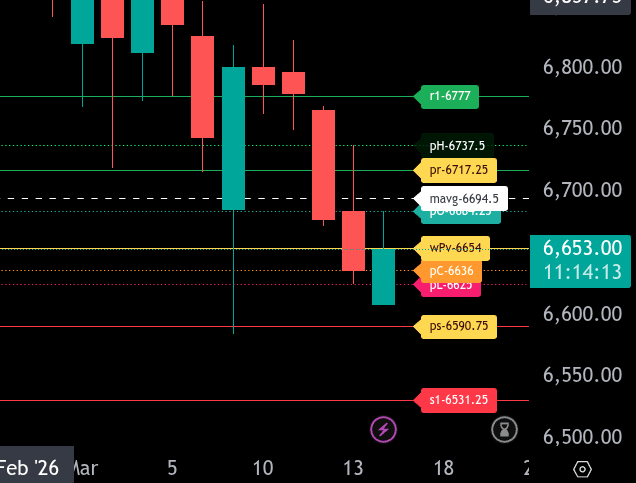
The bull/bear line for the ES is at 6654.00. This level sits almost exactly at the current price and will determine directional bias for the session. Holding above this level favors stabilization and potential recovery, while sustained trading below it keeps the market in a bearish posture.
ES is currently trading around 6653.75, essentially testing the bull/bear line from below. If price fails to reclaim and hold above 6654.00, the downside path opens toward 6636.00 and 6625.00 as the next support levels. A break below 6625.00 would expose 6590.75, which is the lower intraday range target for today. If selling accelerates through that level, the next major support comes in near 6531.25.
On the upside, the first resistance sits at 6684.25, followed by the moving average resistance at 6694.50. If buyers can reclaim 6654.00 and build acceptance above it, the market could rotate higher toward 6717.25, which is the upper intraday range target. Above that level, further resistance is seen at 6737.50 and then 6777.00.
Overall, the market is currently attempting to stabilize after sharp overnight weakness. The key pivot remains 6654.00. Acceptance above this level shifts the focus to recovery toward 6684.25 and 6717.25, while failure to reclaim it keeps pressure on the downside toward 6625.00 and potentially 6590.75.
NQ H
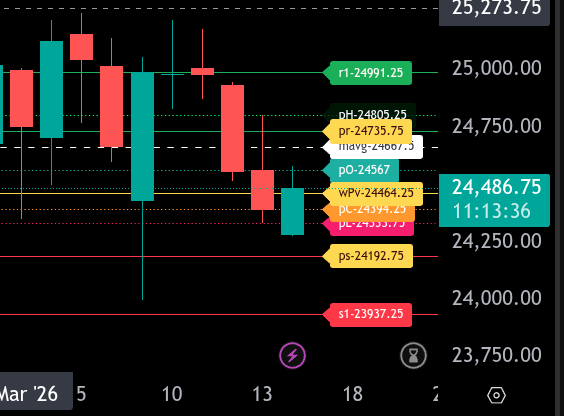
The bull/bear line for the NQ is at 24464.25. This is the key level that will determine directional bias for the session.
NQ is currently trading around 24481.75, slightly above the bull/bear line. Holding above 24464.25 keeps buyers in control and opens the door for a push higher toward 24567.00, followed by 24667.50. If momentum builds above this area, the next resistance to watch is 24735.75, which is the upper intraday range target for today. Above that level, a continuation move could extend toward 24805.25 and potentially 24991.25.
If price falls back below the bull/bear line at 24464.25, the tone shifts bearish. Initial support comes in at 24394.25 and then at 24333.75. A break below these levels would likely trigger further downside rotation toward 24192.75, our lower intraday range target for the session.
Below 24192.75, downside momentum could accelerate toward 23937.25. Traders should watch for acceptance above or below 24464.25 early in the session, as this level will likely dictate whether buyers attempt to expand toward the upper targets or sellers press the market toward the lower range.
Calendars
Today’s Economic Calendar
This Week’s Important Economic Events
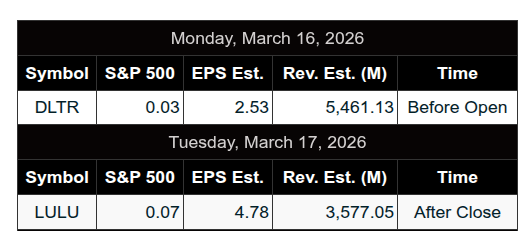
Upcoming Earnings – SP500
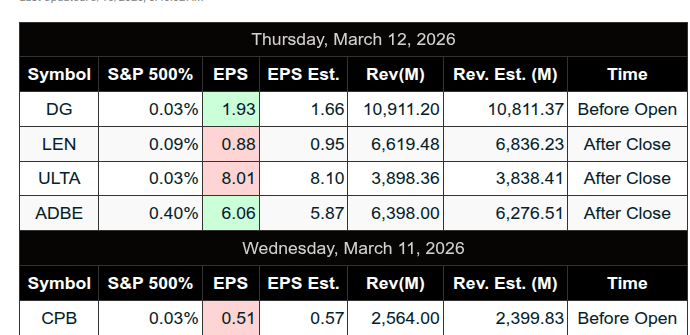
Recent Earnings
Room Summaries:
Polaris Trading Group Summary – Friday, March 13, 2026
The trading day began with PTGDavid identifying an early precision strike at the D-Level Money Box zone, reinforcing the effectiveness of the PTG levels before the main session even developed. The focus for the day was Cycle Day 1, with 6700 identified as the key “Line in the Sand” (LIS) that would determine directional bias.
Morning Strategy and Early Execution
David laid out the Cycle Day 1 scenarios:
-
Bull Case: Acceptance above 6700 ±5 targeting 6715 → 6725 → 6735
-
Bear Case: Acceptance below 6700 ±5 targeting 6685 → 6675 → 6665
Key references included:
-
PVA High Edge: 6717
-
PVA Low Edge: 6690
Early price action quickly validated the plan. The market held above the 6700 level, supporting the bullish case. David emphasized that clearing and converting the 6700 level could open the “skylight” for upside expansion, which is exactly what unfolded.
Targets Hit Quickly
The room saw rapid fulfillment of upside objectives:
-
6725 target fulfilled
-
6735 target fulfilled shortly after
David pointed out how Cycle Day 1 targets were completed very early in the session, again demonstrating the reliability of the DTS framework and structured target planning.
The early guidance was also supported by the observation that price remained above the VWAP midpoint, reinforcing the long-side lean during the morning session.
Late Morning
After the early expansion:
-
Price began balancing around a “whopper zone”, indicating temporary equilibrium.
-
A Dynamic DLMB short zone later triggered and played out successfully, offering traders a rotation opportunity as momentum slowed.
Traders in the room noted the clean technical behavior, including algorithm-driven moves and Fibonacci retracement structure, which helped confirm the rotations.
Midday
-
David highlighted rotation back down toward buyers near the 6665 level, the lowest bear target outlined in the morning briefing.
-
The room remained sell-side focused, anticipating further testing lower.
-
A test of the Overnight Low (ONL) appeared increasingly likely.
-
David characterized the session as a “Range Runner Day” — moving from one Money Box zone to another.
Key Lessons and Takeaways
-
Clear structural levels matter: The 6700 Line in the Sand controlled the early directional bias.
-
Cycle Day targets remain highly dependable: Multiple objectives (6725 and 6735) were achieved early.
-
Money Box zones continue to define rotations, providing both expansion and reversal opportunities.
-
Adaptability is key: After bullish targets completed, traders shifted focus to sell-side rotations as the market balanced and rotated lower.
-
Range environments reward level-to-level trading, rather than chasing momentum.
DTG Room Preview – Monday, March 16, 2026
-
Macro focus: Markets remain centered on the Middle East conflict and rising oil prices, with crude moving back above $100 as flows through the Strait of Hormuz remain near a standstill. The S&P 500 ended last week at its lowest level since November.
-
Geopolitics: The U.S. reportedly struck Iranian oil infrastructure on Kharg Island, which handles most of Iran’s exports. Iran’s leadership says the strait will remain closed if the conflict continues, while the U.S. is seeking international support to secure shipping routes. U.S. naval escorts may not begin until late March.
-
Oil supply adjustments: Storage in the Gulf is filling, forcing producers to reduce pumping. Saudi Arabia is increasing flows through its cross-country pipeline to the Red Sea, allowing exports of roughly 5M barrels/day.
-
Political developments: Trump criticized U.S. media coverage of the conflict and suggested potential FCC scrutiny of broadcaster licenses, a move that would likely face legal challenges.
-
Earnings: Premarket reports include Dollar Tree (DLTR), BEKE, KT, and SBS. ESLT reports Tuesday morning.
-
Economic calendar:
-
8:30 ET: Empire State Manufacturing Index
-
9:15 ET: Industrial Production, Capacity Utilization
-
10:00 ET: NAHB Housing Market Index
-
-
Volatility: Remains elevated. ES 5-day average daily range: ~123.25 points.
-
Flow: No whale bias overnight; large trader volume was light and mixed.
-
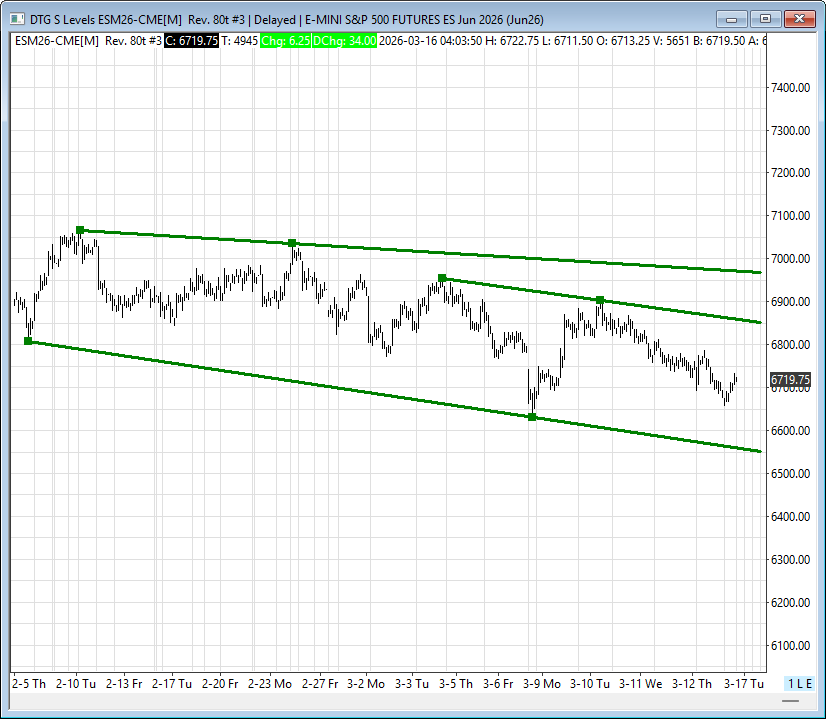
Technical picture (ES):
-
New June ES contract continues to trade within a downtrend channel.
-
Overnight bounce moved price toward the middle of the channel, leaving room both directions.
-
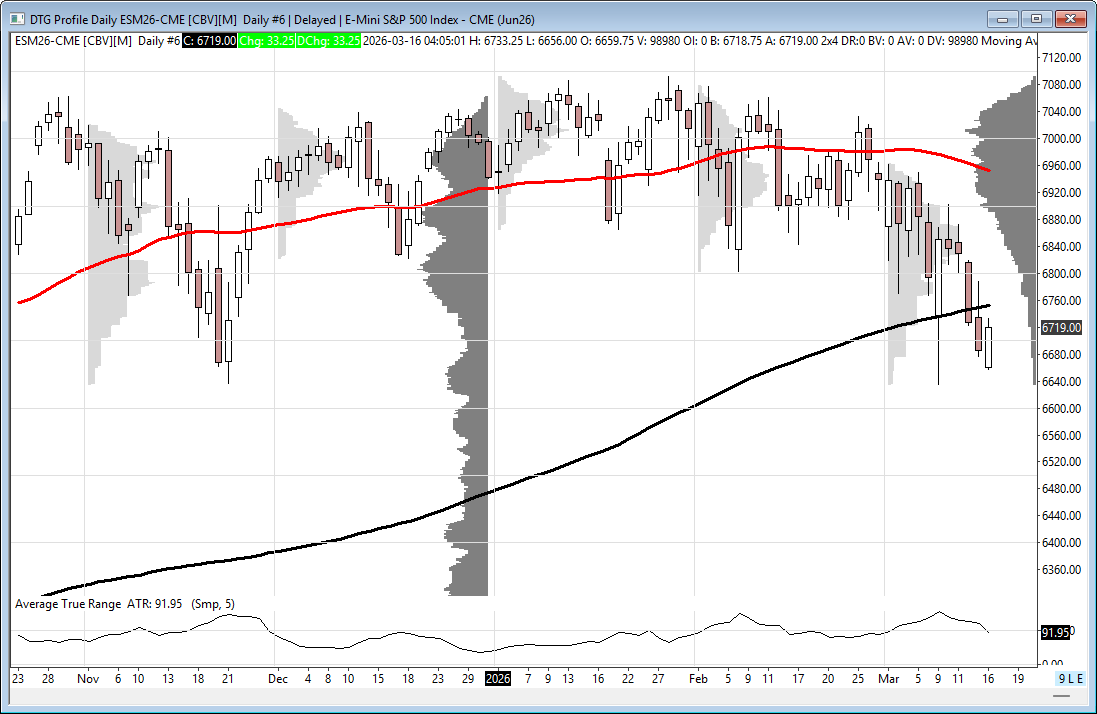
ES has now closed below the 200-day MA (6752) for two consecutive sessions — long-term bearish signal, though holding above last Monday’s low provides short-term support.
-
-
Key ES levels:
-
Resistance: 6855/50s, 6965/70s
-
Support: 6551/46s
-
Affiliate Disclosure: This newsletter may contain affiliate links, which means we may earn a commission if you click through and make a purchase. This comes at no additional cost to you and helps us continue providing valuable content. We only recommend products or services we genuinely believe in. Thank you for your support!
Disclaimer: Charts and analysis are for discussion and education purposes only. I am not a financial advisor, do not give financial advice and am not recommending the buying or selling of any security.
Remember: Not all setups will trigger. Not all setups will be profitable. Not all setups should be taken. These are simply the setups that I have put together for years on my own and what I watch as part of my own “game plan” coming into each day. Good luck!
This post goes out as an email to our subscribers every day and is posted for free here around 2 PM ET. To get your real-time copy, sign up for the free or premium version here: Opening Print Subscribe.
Comments are closed