This post goes out as an email to our subscribers every day and is posted for free here around 2 PM ET. To get your real-time copy, sign up for the free or premium version here: Opening Print Subscribe.
Dollar on Watch, Gold on Fire, and the S&P Caught Between 6850 and a Hard Place
Follow @MrTopStep on Twitter and please share if you find our work valuable!
Our View
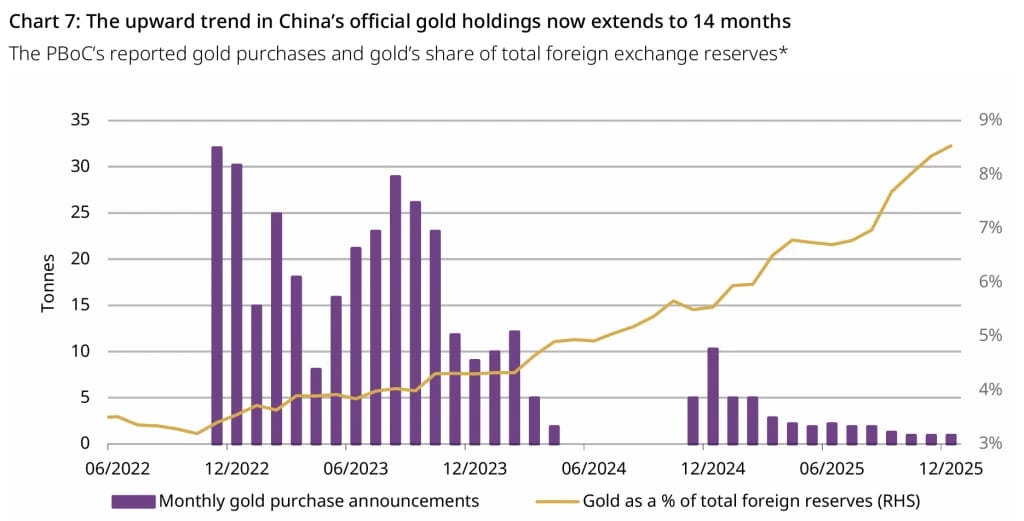
China Gold Reserves and the US Dollar
It was just a crappy day for the stock market in general. Bitcoin futures (BTG26) traded down to 64,200 and settled at 64,755, down 3,325 or -4.88%. Gold (GCH26) traded up to 5,236.70 and settled at 5,207.50, up 144.70 points or +2.86%.
I think the main story behind gold’s continuous move higher is simple: China has been selling the dollar and buying gold since 2000, and it is now one of the largest holders in the world. China’s intent is to replace the dollar as the world’s number one currency with the Chinese yuan. I have said for a long time that if China dumped all its US Treasuries, it could cause panic selling in the dollar. At the end of 2025, it is estimated that China holds 2,400 tons of gold and ranks 6th behind Russia, France, Italy, Germany, and the US, but some think that it currently holds 5,400 tons. I do not think this is going to happen soon, but one sign that it wants to replace the dollar was when it told regional banks not to buy any more US Treasuries and to start to scale back.
On Tap Today
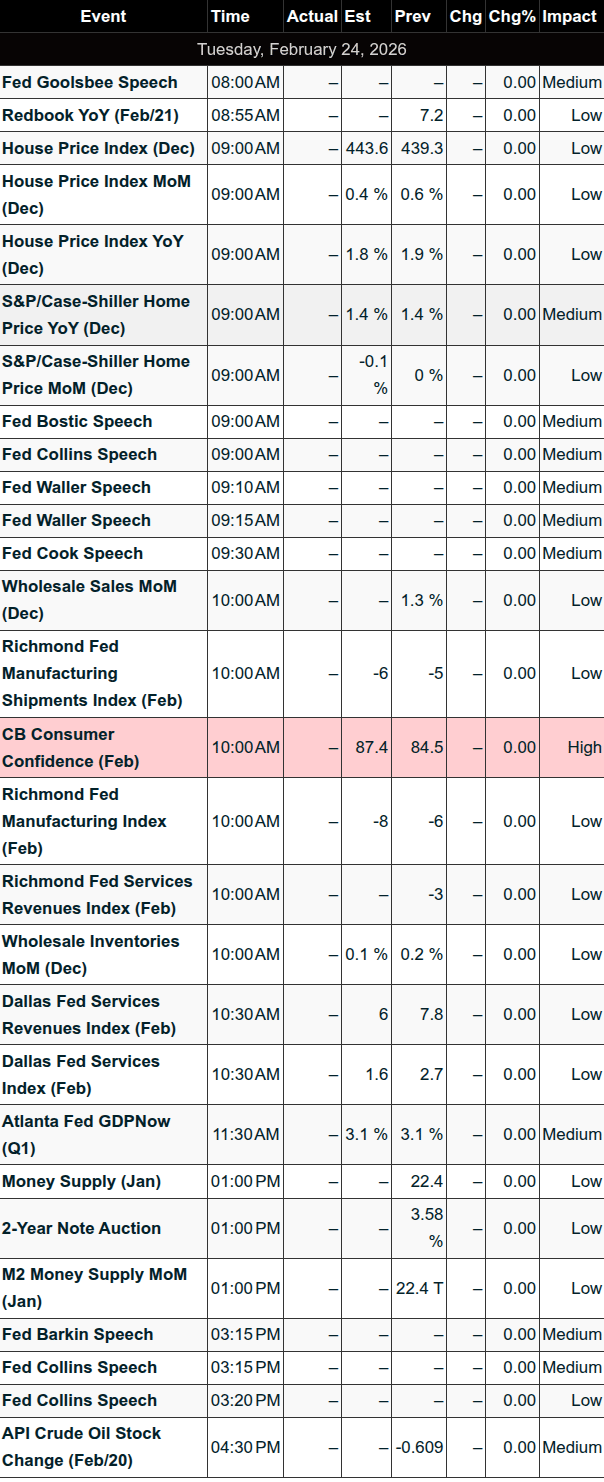
08:00 Goolsbee (Fed)
09:00 Case-Shiller | Bostic (Fed)
09:15 Waller (Fed)
09:30 Cook (Fed)
10:00 Wholesale Inventories + Consumer Confidence
Home Depot (HD) earnings
2Y Note auction ($69B)
Our View
I guess you can have two views: either that the ES is looking like it could continue to break down, or that it’s still back and filling. Based on the level of news, one would think it’s setting up for another selloff, but based on the 5-day chart, it still looks like the latter.
This morning, Home Depot reports earnings. After HD reported a miss on its Q3 earnings, the ES extended its multi-day losing streak, closing down 0.31%, and was noted as a laggard or one of the worst performers in the index. Yesterday, HD closed down 5.26 points or -1.38% on the day. Over the last 8 sessions, HD has been up a day, down a day, down 1.29% on 2/19/2026, up 0.79% on 2/20/2026, and down 1.38% yesterday. I am not sure that HD will play a role in today’s price action, but it does look like it’s been getting sold over the last few days.
Our Lean
I am usually more specific about the direction of the ES, but it’s really all over the place. In yesterday’s lean, I pointed out the MrTopStep rule that the ES tends to go sideways to down after a big up day (last Friday) and tends to go sideways to up after a big down day (yesterday).
Our lean: I think we can see a bounce and can’t rule out trading a gap in either direction, but I think any larger rally could fail despite all the back and fill.
Key Resistance Levels
6931.65 — Strong overhead resistance / recent swing high
6924.39 — High cluster resistance
6917.68 / 6917.40 — Tight resistance zone (failed breakout area)
6914.71 — Minor resistance
6910.25 — Psychological / prior high pivot
6901.24 — Key resistance flip (recent consolidation high)
6897.25 / 6892.11 — Dense overhead supply cluster
6889.38 / 6888.77 / 6887.75 — Minor resistance / pivot area
Key Support Levels
6883.56 / 6880.22 — Moderate support / prior defense
6871.50 — Support cluster
6864.00 / 6863.00 / 6862.85 — High-confluence support (tight levels, recent battleground)
6853.00 / 6851.50 / 6851.11 — Very strong support zone (multiple touches / potential floor)
6845.47 — Lower support extension
6834.23 — Deeper support
6822.78 / 6812.75 — Pullback support targets
6810.89 / 6806.65 / 6804.79 / 6801.76 — Minor to moderate support cluster
6774.00 — Major deeper support
6751.50 — Extended / major downside target (if breakdown continues)
Quick Notes on Usage
Overhead resistance starts heavy at 6900–6931 (needs a strong catalyst to reclaim for upside).
Current focus around 6850–6863 (pivotal; hold for bounce potential toward 6880–6900; break lower accelerates to 6810–6774).

Guest Posts: @Manny_Trends
SPX closed at 6837, and that close does two important things heading into today.
First, it confirms acceptance below 6875, breaking the lower end of the recent 6875–6905 distribution range.
Second, it closes below 6860, which negates the S&P daily-cycle bounce.
That shifts the framework from a short-term bounce narrative into a more defensive, post-breakdown posture.
Market Structure and Volatility Outlook
Volatility should remain elevated this week, and recent price action continues to fit a broader distribution environment.
The core distribution range sits at 6875–6905, with an upper defense / squeeze band at 6915–6925.
If SPX trades inside 6875–6905, it suggests dealers are suppressing volatility and focusing on premium collection. That type of environment often produces two-way trade, chop, and failed moves.
At today’s open, ES pushed to 6916, tagging the 6915–6925 squeeze / defense zone and confirming that area as active. The market has already shown where sellers may defend upside attempts — unless price can reclaim and hold above that band.
A sustained break above 6915–6925, followed by a break of 6950, would be required to reopen a stronger upside continuation scenario.
With SPX closing at 6837, price is currently below the core distribution zone. The focus now shifts to whether the market can reclaim lost structure or continue lower.
Distribution Flow Map
Inside 6875–6905
Dealers likely suppress volatility and collect premium. Expect chop and failed breakouts.
6915–6925
Active squeeze / defense zone. ES traded to 6916 at the open, confirming this as a likely sell / defense area unless accepted above it.
Break and hold above 6915–6925
Improves odds of a repair move, with 6950 as the next key upside level.
Break above 6950
Higher prints come back into play.
Break below 6875
Eyes move to 6825, then 6800.
6800
Major put wall. If 6800 breaks, volatility can spike and the selloff can accelerate.
Cycle and Signal Context
The cycle notes now carry a defensive tilt:
S&P: A close below 6860 negates the bounce. SPX closed 6837.
Nasdaq: A close below 24,750 cancels the bounce. NDX closed 24,708.
Dow Jones: A close below 49,200 cancels the bounce. DJI closed 48,804.
Broader cycle backdrop:
Weekly cycles remain down.
Downside risk remains in play.
The longer-term posture continues to favor defense over aggression.
VIX Context
The VIX weekly cycle is up.
A prior VIX buy signal was canceled below 19.30. VIX closed 21.01.
A close above 19.90 would trigger a new VIX buy signal and increase volatility risk. With VIX already at 21.01, that volatility trigger is active.
This threshold matters if the market begins leaning on lower support and volatility expands further.
What I’m Watching Today
Reclaim 6875 and build a base
First sign of repair. Buyers need acceptance back into the broken range.
Reject 6875
Keeps downside continuation pressure in control.
Reclaim 6905
Opens the door back into the upper distribution / squeeze zone.
6915–6925
Confirmed defense zone after ES tagged 6916 at the open. Watch for seller response unless price is accepted above it.
Break and hold above 6915–6925
Improves odds of a push toward 6950.
Break 6950
Stronger upside continuation and higher prints back in play.
Below 6875
Eyes on 6825, then 6800.
6800
Major downside decision point.
Break 6800
Increases odds of volatility expansion and accelerated downside.
Tactical Read
The market has broken structure and invalidated the S&P daily-cycle bounce threshold. In this type of tape, traders often get trapped trying to force reversals too early.
Inside 6875–6905, expect more dealer-driven volatility suppression and premium collection behavior. The market has already tested the 6915–6925 squeeze / defense band, giving us a confirmed upper response level.
Outside these zones, focus on confirmation and follow-through.
The better approach is tactical patience:
Reclaim and hold for repair.
Failed reclaims for continuation.
Execution Reminder
Trade the engagement, not the hope.
No base, no trade.
Read the open. Respect the risk. Let the market confirm first.
You can follow Manny at @manny_trends and at @pitbulltraders
Market Recap
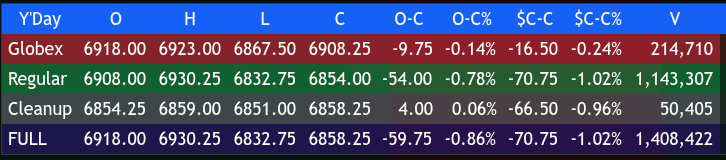
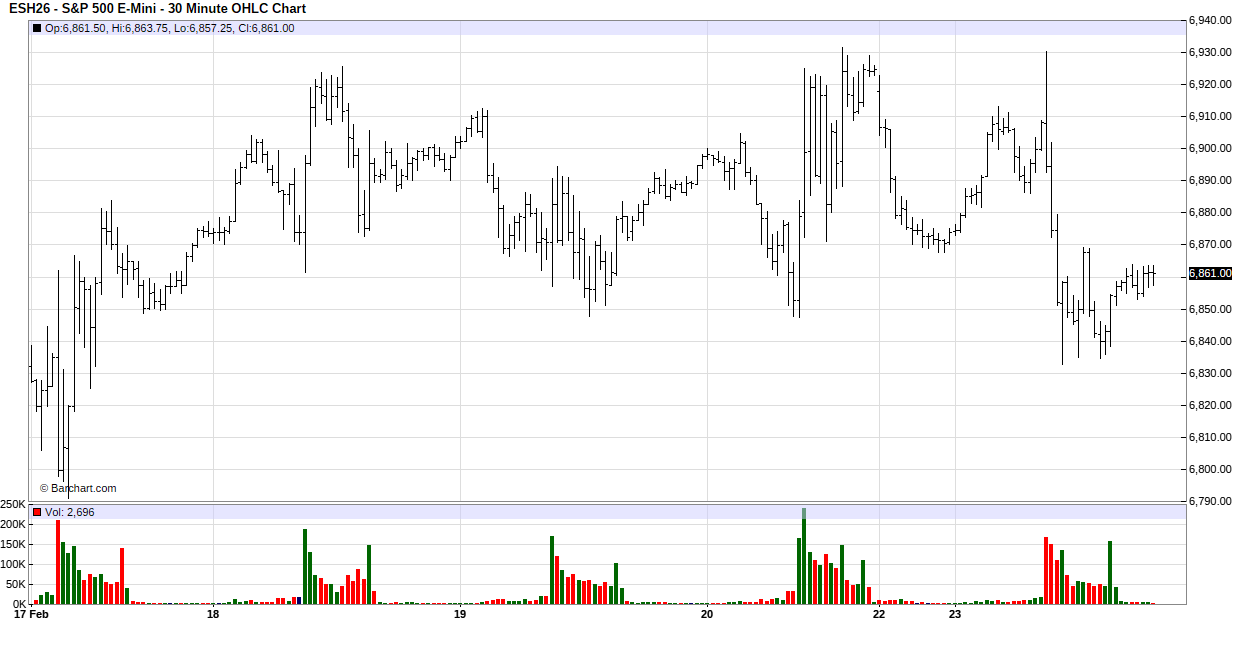
The ES traded down to 6867.50, rallied up to 6923.00, and opened Monday’s regular session at 6908.25, down 9.75 points or -0.24% — and that is when the fun began!
After the open, the ES traded 6906.75, rallied up to 6930.50, sold off down to 6897.25 at 9:45, and rallied up to 6911.50 at 9:50. It then tanked 97.50 points, all the way down to 6833.00 at 11:15, rallied back up to 6860.50 at 11:30, and sold off down to a new low at 6835.25 at 12:39.
The ES rallied up to 6869.25 at 1:25, sold off down to 6834.75 at 2:20, rallied up to 6844.75 at 2:55, and sold off down to a higher low at 6835.75 at 3:10. It then rallied up to 6852.00 at 3:30 and traded 6849.00 as the 3:50 imbalance showed $3.4 billion to buy, sold off down to 6838.50, started going bid, and traded 6854.00 on the 4:00 cash close.
After 4:00, the ES traded up to 6859.00 at 4:34 and settled at 6851.50, down 71.75 points or -1.04%. The NQ settled at 24,762.75, down 304.75 points or -1.22%. The YM settled at 48,849, down 1.66%, and the RTY was down 42.50 points or -1.59% on the day.
In the end, I think it’s simple — expect the unexpected. In terms of the ES and NQ’s overall tone, there was an early rally and failure, but the real weakness was in the YM and RTY. In terms of the ES’s overall trade, volume was steady but lower at 1.411 million contracts traded.
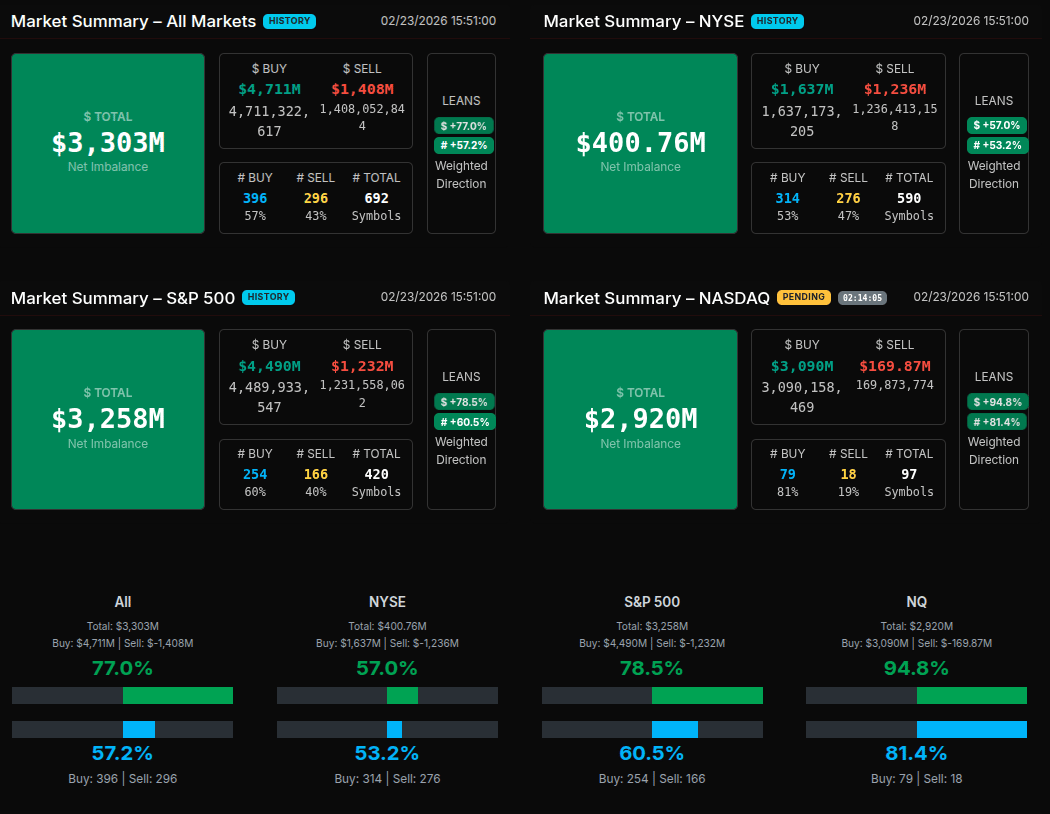
MiM
Market-on-Close Recap – MiM
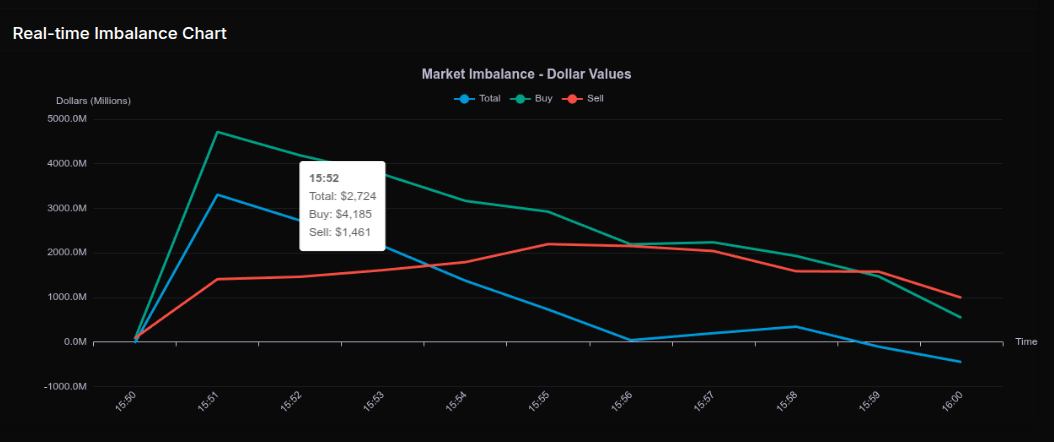
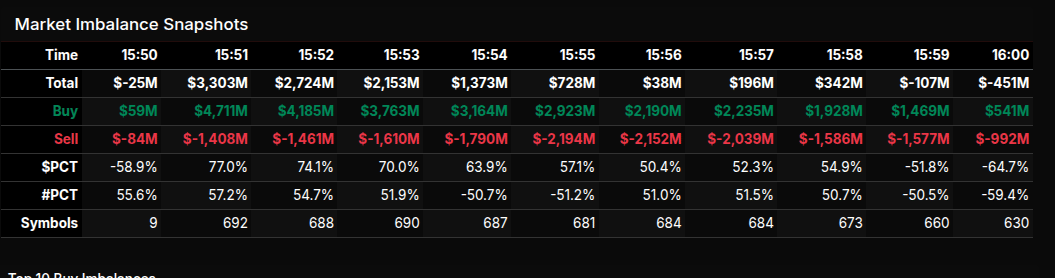
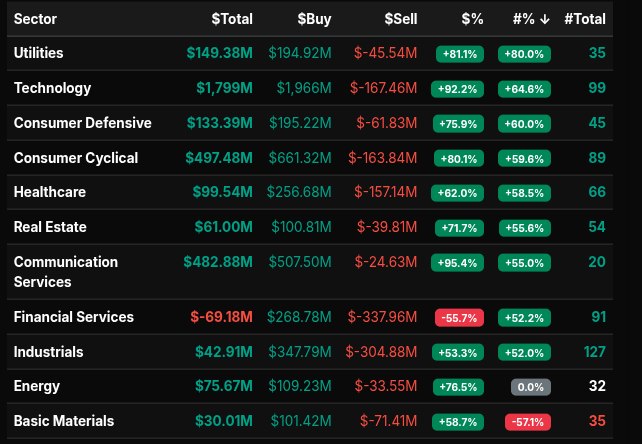
The February 23rd MOC session opened with an early sell imbalance of -$25M at 15:50, showing a -58.9% lean as sell programs initially controlled the tape. That weakness was immediately reversed. By 15:51, total imbalance surged to $3.3B to buy, with $4.7B in buy orders versus $1.4B for sale, producing a strong +77% dollar lean and +57% symbol participation. The auction quickly shifted from defensive selling into broad institutional demand.
Buy pressure peaked between 15:51 and 15:53, holding above $2.1B net to buy. Lean percentages remained firmly above +70%, signaling wholesale market accumulation rather than simple rotation. By 15:55, the imbalance moderated to +57%, and by 15:56 it cooled further toward +50%, reflecting more two-sided rotation as paired volume increased. Into the bell, however, the tone flipped again. At 15:59, the market showed -51.8%, and the 16:00 print closed with a -$451M sell imbalance and a -64.7% lean, a notable late supply shift just shy of the -66% wholesale threshold.
Sector flows were decisively risk-on for most of the session. Technology (+92%), Communication Services (+95%), Utilities (+81%), Consumer Cyclical (+80%), and Energy (+76%) all displayed strong buy-side control. Industrials (+53%) and Consumer Defensive (+75%) also leaned higher. Financials stood out as the clear outlier at -55%, reflecting rotation and persistent sell programs. Basic Materials showed internal divergence with negative symbol breadth despite a positive dollar skew.
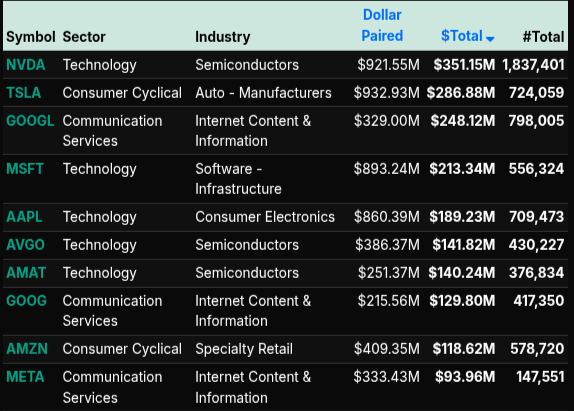
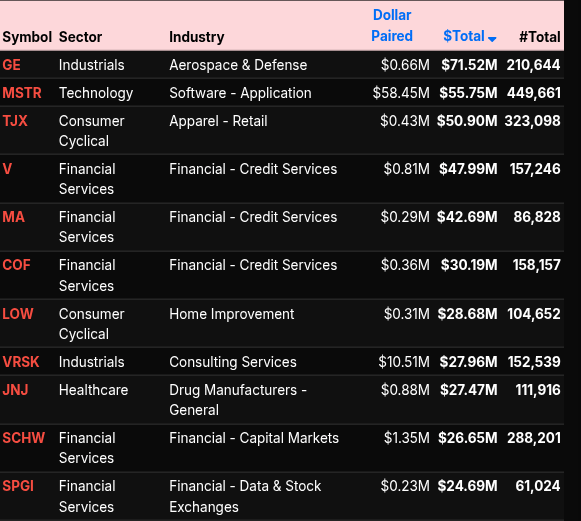
On the symbol level, leadership was concentrated in mega-cap growth and beta. NVDA posted $351M to buy, TSLA $286M, MSFT $213M, AAPL $189M, AVGO and AMAT both above $140M. Communication names GOOGL and META also saw heavy demand. Cyclical participation included GE, TJX, and LOW, while financial names such as V, MA, COF, SCHW, and SPGI saw mixed to negative pressure.
Overall, the MOC reflected aggressive institutional accumulation early, broad risk participation, late rotation, and a closing sell imbalance that trimmed—but did not erase—the session’s strong buy-side dominance.
Technical Edge
Fair Values for February 24, 2026:
-
SP: 12.13
-
NQ: 50.58
-
Dow: 40.25
Daily Market Recap 📊
For Monday, February 23, 2026
• NYSE Breadth: 30% Upside Volume
• Nasdaq Breadth: 42% Upside Volume
• Total Breadth: 37% Upside Volume
• NYSE Advance/Decline: 26% Advance
• Nasdaq Advance/Decline: 31% Advance
• Total Advance/Decline: 29% Advance
• NYSE New Highs/New Lows: 172 / 104
• Nasdaq New Highs/New Lows: 183 / 331
• NYSE TRIN: 0.85
• Nasdaq TRIN: 0.61
Weekly Breadth Data 📈
For Week Ending Friday, February 20, 2026
• NYSE Breadth: 55% Upside Volume
• Nasdaq Breadth: 56% Upside Volume
• Total Breadth: 55% Upside Volume
• NYSE Advance/Decline: 59% Advance
• Nasdaq Advance/Decline: 56% Advance
• Total Advance/Decline: 57% Advance
• NYSE New Highs/New Lows: 404 / 116
• Nasdaq New Highs/New Lows: 407 / 492
• NYSE TRIN: 1.19
• Nasdaq TRIN: 1.00
ES & NQ Levels (Premium only)

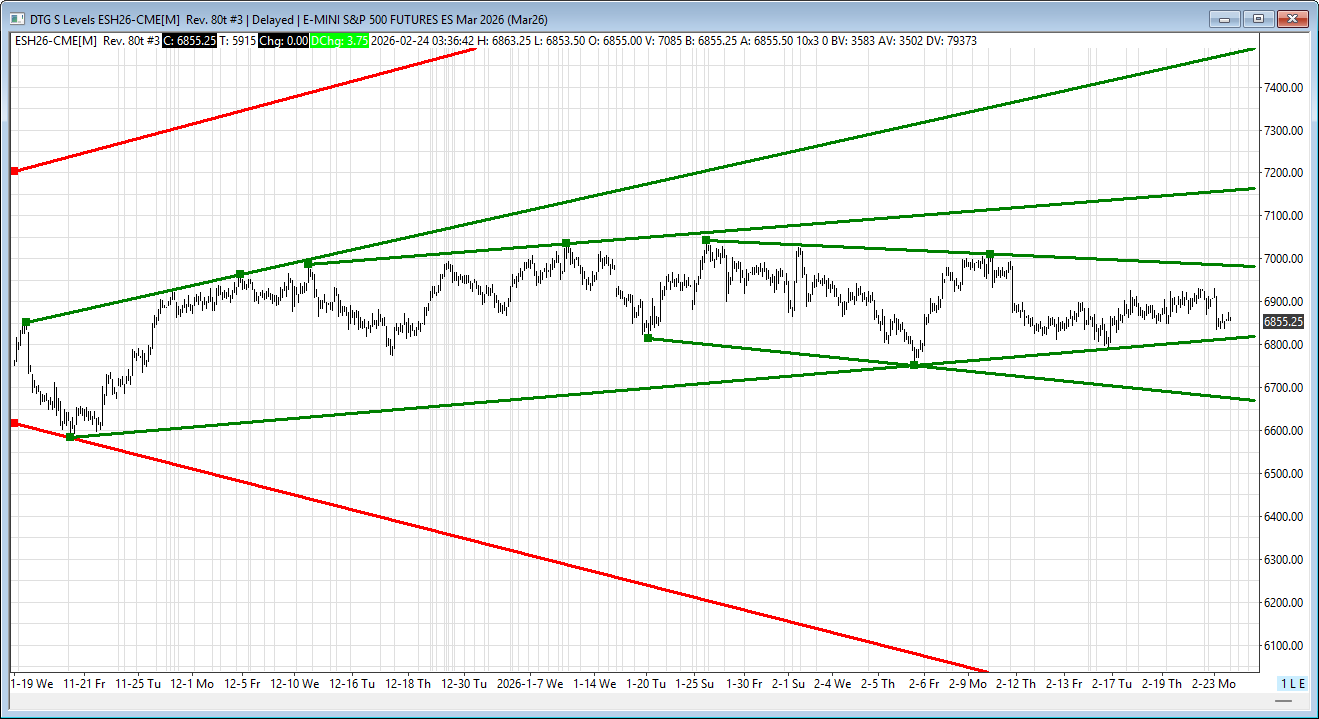
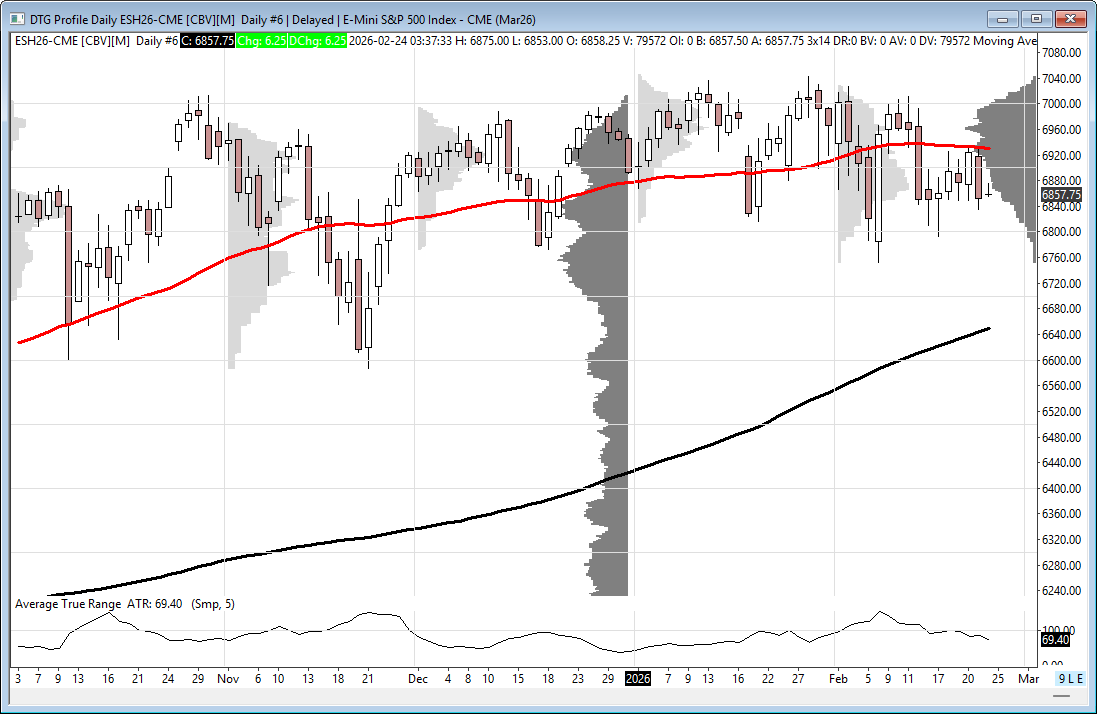
ES – H26 Levels
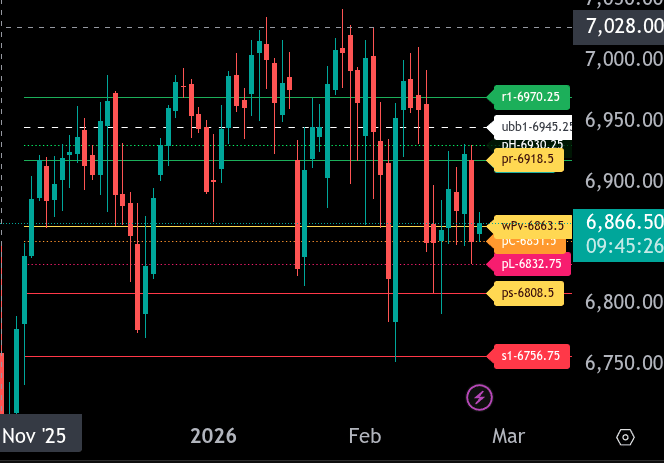
The bull/bear line for the ES is at 6863.50. This is the key pivot for today’s trade. Holding above this level keeps the tone constructive and favors rotation higher. Acceptance below it shifts control back to the sellers.
ES is currently trading around 6866.50 in the Globex session, sitting just above the bull/bear line. As long as price holds above 6863.50, upside rotation toward 6918.50, our upper intraday range target, is in play. A sustained break above 6918.50 opens the door to 6950.25 and then 6970.25. If momentum expands, a stretch toward 7028.00 cannot be ruled out.
If price loses 6863.50 and begins to hold below it, look for downside pressure toward 6832.75. Below that, 6808.50 is the lower intraday range target. A clean break of 6808.50 exposes 6756.75 as the next major support. Failure there would signal a broader shift in structure and likely bring in heavier selling.
Resistance levels for today are 6918.50, 6950.25, and 6970.25. Support levels are 6863.50, 6832.75, 6808.50, and 6756.75.
Overall, bias remains neutral-to-bullish above 6863.50 and bearish below it. Let price acceptance around this pivot dictate positioning, and be cautious of failed breaks at either intraday range target.
NQ – H26 – Levels
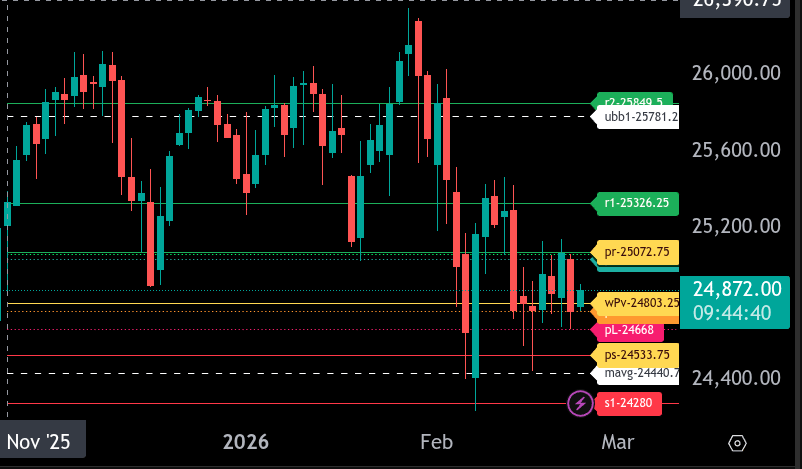
The bull/bear line for the NQ is at 24,803.25. This is the key pivot for today’s trade. Holding above this level keeps short-term momentum constructive, while acceptance back below it shifts control to sellers.
NQ is currently trading around 24,872.00, positioning price above the bull/bear line and attempting to stabilize after the recent sharp selloff. As long as 24,803.25 holds on pullbacks, buyers can press for a move into 25,072.75, which is our upper range target for the session.
Above 25,072.75, resistance comes in at 25,326.25. A sustained push through that level would open the door for a broader recovery phase and squeeze higher into prior breakdown areas.
On the downside, immediate support sits at 24,668.00. A break and hold below 24,803.25 increases the probability of rotation into 24,533.75, our lower range target. If sellers gain acceptance below 24,533.75, the next key supports come in at 24,440.00 and then 24,280.00. A move into that lower zone would signal renewed downside momentum and potential trend continuation.
Overall, the tone is neutral to slightly constructive above 24,803.25, but the market remains fragile after the recent volatility. Trade location versus 24,803.25 will dictate intraday bias. Hold above it and look for rotations higher; lose it and expect pressure back toward the mid-24,500s and potentially lower.
Calendars
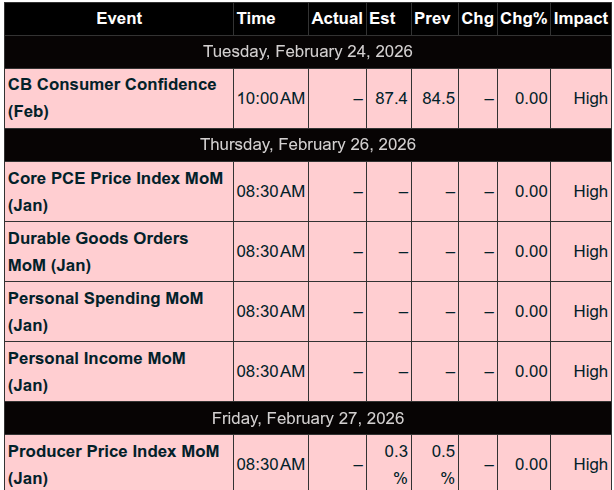
Economic Calendar
Today
Important Upcoming
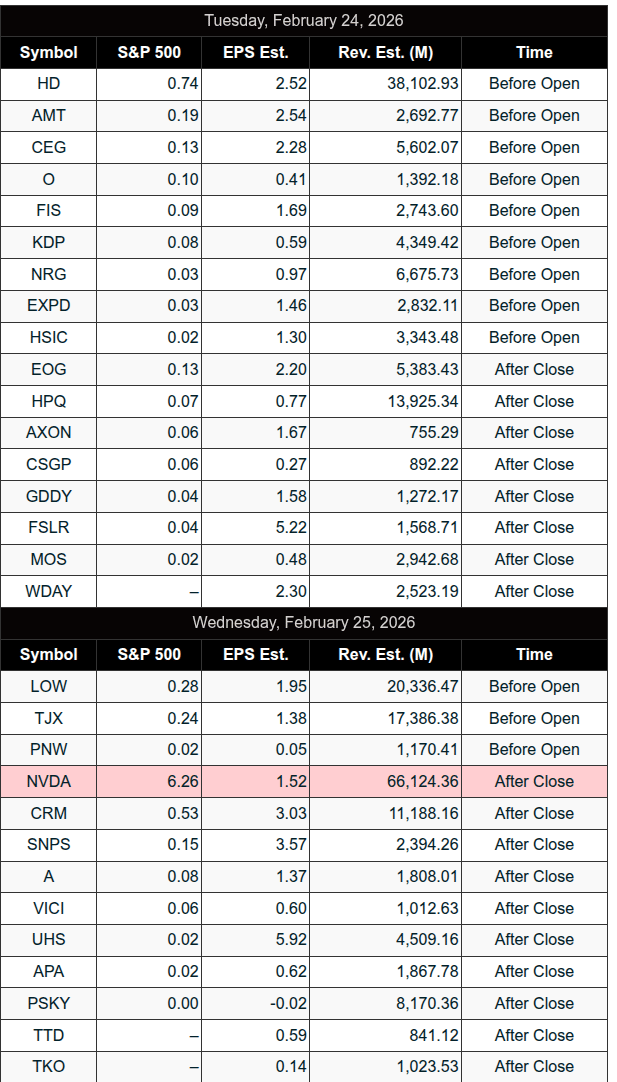
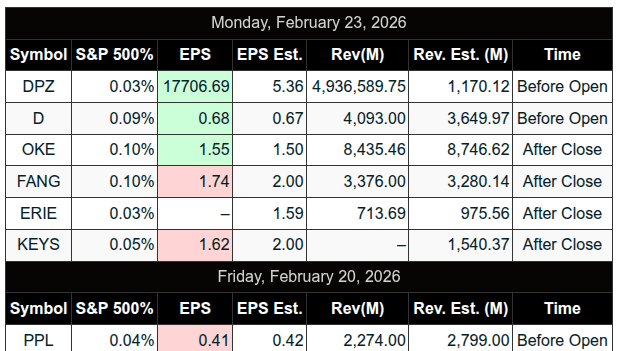
Earnings
Recent
Trading Room Summaries
Polaris Trading Group Summary – Monday, February 23, 2026
“Blizzard Monday” – Discipline Through Disruption
The day began with Manny setting the tone: new day, fresh start — trade plan posted, same consistent process. Despite a literal blizzard and significant tech challenges (screenshare/audio issues, internet latency, power surges, and extreme weather conditions), the room stayed focused and grounded in the Daily Trade Strategy (DTS).
Environment: Adversity Early
-
Severe blizzard conditions (26 ft waves reported).
-
Internet and Rithmic/Ninja connectivity issues.
-
Screenshare and audio disruptions throughout the open.
-
Power surges forced David off mic mid-session.
Despite this, charts were restored, communication continued via chat, and execution remained centered on structure and levels — a strong lesson in professionalism under pressure.
Market Structure & Execution
Early Action – Targets Hit Both Ways
David noted early that both upside and downside targets from the DTS Briefing were fulfilled, confirming solid pre-market planning and balanced expectations for Cycle Day 2.
Cycle Day 2 Framework
Key pivot: 6905 ±5
-
Bull Case: Acceptance above 6905
Targets: 6915 → 6920 → 6925 -
Bear Case: Acceptance below 6905
Targets: 6885 → 6880 → 6875
Early push to 6925 was rejected — price reverted to VWAP, aligning with expected Cycle Day 2 MATD rhythm (early directional push, then reversion/rotation).
Trades & Highlights
Bright Spot of the Day
-
NQ Open Range Short — clean winner and standout trade.
-
ES & CL open range attempts were stopped out — disciplined risk management kept losses contained.
Lesson: Not every instrument delivers. Staying diversified but selective allowed NQ to shine while ES and CL were controlled losses.
Key Rotational Levels in Play
-
6880 marker – Sellers remained dominant below.
-
6875 – Retest of key DTS downside target.
-
Price remained within Friday’s range → context awareness.
-
Watch for test of Friday’s low.
D-Level Money Box – Textbook Execution
One of the most important plays of the day:
-
Price neared DLMB (D-Level Money Box) → preparation for reversal.
-
Textbook D-Level Reversal triggered.
-
David shared a “1st Pullback Play” screenshot to add to members’ playbooks.
-
Later confirmation: Back test of D-Level paid during that period.
-
Bulls regained momentum → targets at 6868 and 6878.
-
6868 target fulfilled.
This was a high-quality instructional sequence:
-
Identify structural level.
-
Anticipate reversal behavior.
-
Execute first pullback.
-
Manage targets logically.
Excellent example of structure-based trading rather than emotional reaction.
Lessons Reinforced
1. Cycle Day Rhythms Matter
Early directional push → rejection → rotational movement.
Understanding MATD rhythm kept traders from chasing highs.
2. Acceptance Above/Below Key Levels
6905 ±5 acted as the decision zone. Clean framework = reduced emotional trading.
3. Contained Losses = Professional Trading
Open range losses in ES & CL were handled mechanically.
The NQ winner offset and reinforced trust in the system.
4. D-Level Playbook Expansion
The D-Level reversal and first pullback setup was a standout educational moment. Members were encouraged to formally add this to their playbook.
5. Control What You Can
Even with:
-
Blizzard conditions
-
No plows
-
Tech failures
-
Power surges
The process held steady. That’s professional consistency.
Discovery Trading Group Room Preview – Tuesday, February 24, 2026
Morning Market Brief – Key Themes & Levels
Macro Drivers
-
Primary focus:
-
Trump tariff reset
-
US-Iran nuclear negotiations
-
AI-driven volatility across sectors
-
Tariffs & Trade Escalation
-
New 10% global tariff on imports begins today under Section 232 (Trade Expansion Act of 1962).
-
Investigations launched into:
-
Batteries
-
Cast iron & fittings
-
Electrical grid & telecom equipment
-
Plastics & plastic piping
-
Industrial chemicals
-
-
Section 232 allows tariffs for up to 5 months.
-
Section 301 (Trade Act of 1974) expected to be used on an accelerated timeline targeting:
-
Industrial excess capacity
-
Forced labor
-
Pharma pricing
-
Discrimination vs. US tech
-
Digital services taxes
-
Seafood, rice, and other trade practices
-
Geopolitics & Energy
-
US-Iran nuclear talks resume Thursday in Geneva.
-
US military buildup in Middle East; embassy drawdown in Beirut.
-
Oil carrying ~ $10/barrel geopolitical premium.
-
Trump signaling preference for diplomatic resolution.
AI Volatility Expands
-
Citrini Research issued bearish AI disruption report (targets: food delivery, credit cards).
-
Anthropic announced AI tool to modernize COBOL (IBM mainframe exposure).
-
IBM fell 13% to 25-year low.
-
Taleb warned of fragility in AI-driven software rally.
-
Sharp declines Monday: 6% DoorDash, American Express, KKR, Blackstone; 4% Uber, Mastercard, Visa, Capital One, Apollo
Earnings
-
Premarket: HD, AMT, BNS, CEG, DDS, FIS, NRG, O, WLK, VIV, others
-
After close: HPQ, FSLR, MELI, WDAY, EOG, GDDY
-
Wednesday AM: LOW, TJX, HSBC, ABEV, DEO, NU, others
Economic Calendar
-
9:00am ET: HPI, S&P/CS Composite-20
-
10:00am ET: Consumer Confidence, Richmond Fed, Wholesale Inventories
-
Heavy Fed speaker lineup throughout the day (Goolsbee, Bostic, Collins, Waller, Cook, Barkin).
Technical Backdrop (ES)
-
3-month consolidation continues below ATHs.
-
5-day ADR: 83.5 points (slightly elevated).
-
No significant overnight large trader (“whale”) bias.
Key Levels
-
50-day MA (6930.50) = near-term resistance (capped HOD again).
-
Channel support: 6812/15 → break opens 6700.
-
Upside room toward short-term downtrend channel top: 6982/79.
TL Resistance: 6982/79s, 7160/65s
TL Support: 6812/15s, 6670/65s
Affiliate Disclosure: This newsletter may contain affiliate links, which means we may earn a commission if you click through and make a purchase. This comes at no additional cost to you and helps us continue providing valuable content. We only recommend products or services we genuinely believe in. Thank you for your support!
Disclaimer: Charts and analysis are for discussion and education purposes only. I am not a financial advisor, do not give financial advice and am not recommending the buying or selling of any security.
Remember: Not all setups will trigger. Not all setups will be profitable. Not all setups should be taken. These are simply the setups that I have put together for years on my own and what I watch as part of my own “game plan” coming into each day. Good luck!
This post goes out as an email to our subscribers every day and is posted for free here around 2 PM ET. To get your real-time copy, sign up for the free or premium version here: Opening Print Subscribe.
Comments are closed