This post goes out as an email to our subscribers every day and is posted for free here around 2 PM ET. To get your real-time copy, sign up for the free or premium version here: Opening Print Subscribe.
March 18, 2026 | Read online
Dot Plot Today, Quad Witch Friday — Traders Ducking Bullets and Chasing Gaps
Follow @MrTopStep on Twitter and please share if you find our work valuable!
FREE Two-Week Offer for the Opening Print Premium. Open up the Lean and other premium features for the next Two Weeks!
Our View
Today is day 2 of the Fed’s 2-day meeting. While there is zero chance the Fed will lower rates today, the jump in oil prices, driven by the Middle East conflict, has complicated the Fed’s picture, as inflation remains above the central bank’s 2% target and the labor market slows. Traders now say they do not expect the Fed to cut rates until October or December. For today’s meeting, the expectations are that the Fed will hold rates steady at the 3.5% to 3.75% range.
At 2:00 ET, the Fed releases its official monetary policy statement and the updated Summary of Economic Projections (the “dot plot”), and at 2:30, Chair Jerome Powell will hold a press conference to discuss the interest rate decision and the economic outlook. Powell’s second term as Chair of the Federal Reserve is set to expire on May 15; Kevin Warsh will take over as chair( if confirmed by the Senate) after Powell’s term expires.
Like I have always said… we live in an ever-evolving world that doesn’t stay the same for very long.
Our View
Trump said yesterday that he’s ‘not afraid’ of a Vietnam-style ground combat in Iraq or deploying troops within Iran, further emphasizing the lengths he is willing to go in his Middle East war. While both Trump and Iran have said they are willing to go the distance, Iran’s Foreign Minister recently stated that the country is not seeking a ceasefire but believes the war “must end”, and there is a French proposal for a multi-stage peace plan for Lebanon that would include a non-aggression agreement and the normalization of relations with Israel.
But there remain key obstacles to peace. The United States and Israel have shifted their primary objective toward inducing regime change in Iran, a demand the leadership under Mojtaba Khamenei is expected to reject outright. Simultaneously, the global economy faces a crisis as Iran’s closure of the Strait of Hormuz has paralyzed oil shipping, with the U.S. signaling a commitment to reopening the waterway through military force rather than diplomacy. Compounding these tensions is a massive Hezbollah escalation, where record-breaking daily attacks against Israel have made the prospect of a localized ceasefire increasingly remote.
I hope one day we wake up and the war is over, but there are just too many differences, and the first one is (as I have said many times) Iran is not giving up.
Our Lean
The Fed should have little bearing on today’s trade, but one thing is for sure: the rollover has. The big show is coming FRYday with the March Quad Witching’s $7.1 trillion, record expiration. I have to admit that the ES and NQ have firmed up, and I have seen some back-and-fill price action the last few days, but until there is a ceasefire in the Middle East, there will continue to be high volatility, especially if Iran keeps hitting the oil complex in the Gulf.
Our lean: It looks to me like the futures have been rallying on Globex and then gapping up. Helping the buyers right now is all the short selling/hedging that has been done at low prices, mainly last week. Even if the ES and NQ do go higher, I still think the 6830-6850 area is a brick wall. Remember, I’m a scalper who tries to hold when things go my way, but I rarely hold overnight. Remember my comment about the back-and-fill.
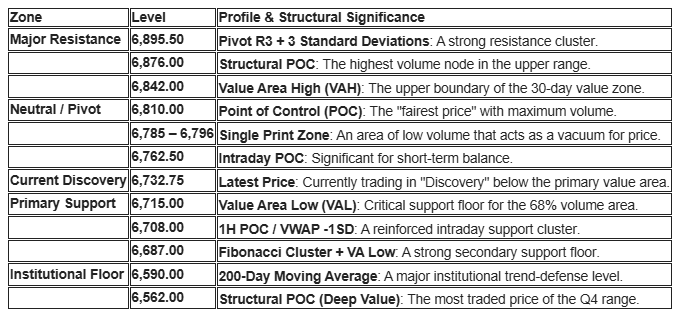
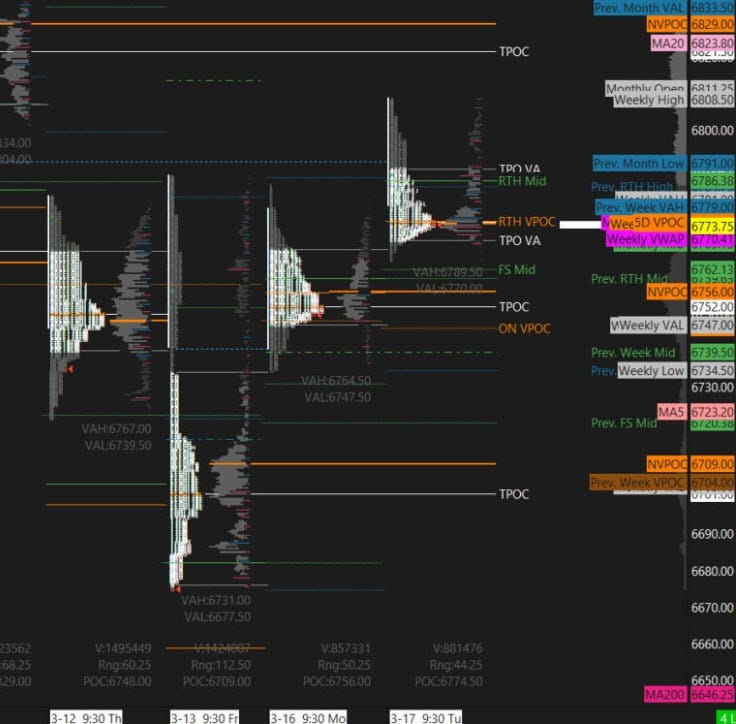
Expanded Market Profile Structural Map
The market is currently characterized by a “Double Distribution” setup, where price action is split between distinct high-volume zones.
Key Market Comments
-
Bearish Value Migration: The distance between the current price (6,732.75) and the primary POC (6,810.00) shows significant overextension to the downside. While a mean-reversion move back to the POC is a high-probability play, it requires the Pivot Point at 6,732.08 to hold.
-
Systematic Selling Pressure: Commodity Trading Advisors (CTAs) are reportedly shifting aggressively toward short positions. In a flat market scenario, models suggest they would need to sell approximately $66 billion in global equities weekly.
-
Volume Dynamics: Recent trading sessions have seen uncharacteristically low outright volume (e.g., 999k contracts), leading to “thin to win” type trades where small orders or automated programs can cause outsized moves.
-
The “Line in the Sand”: The multi-month low at 6,584.50 remains the critical structural floor. Accepting price below this level would open an “air pocket” down to the 6,500 area

Market Recap
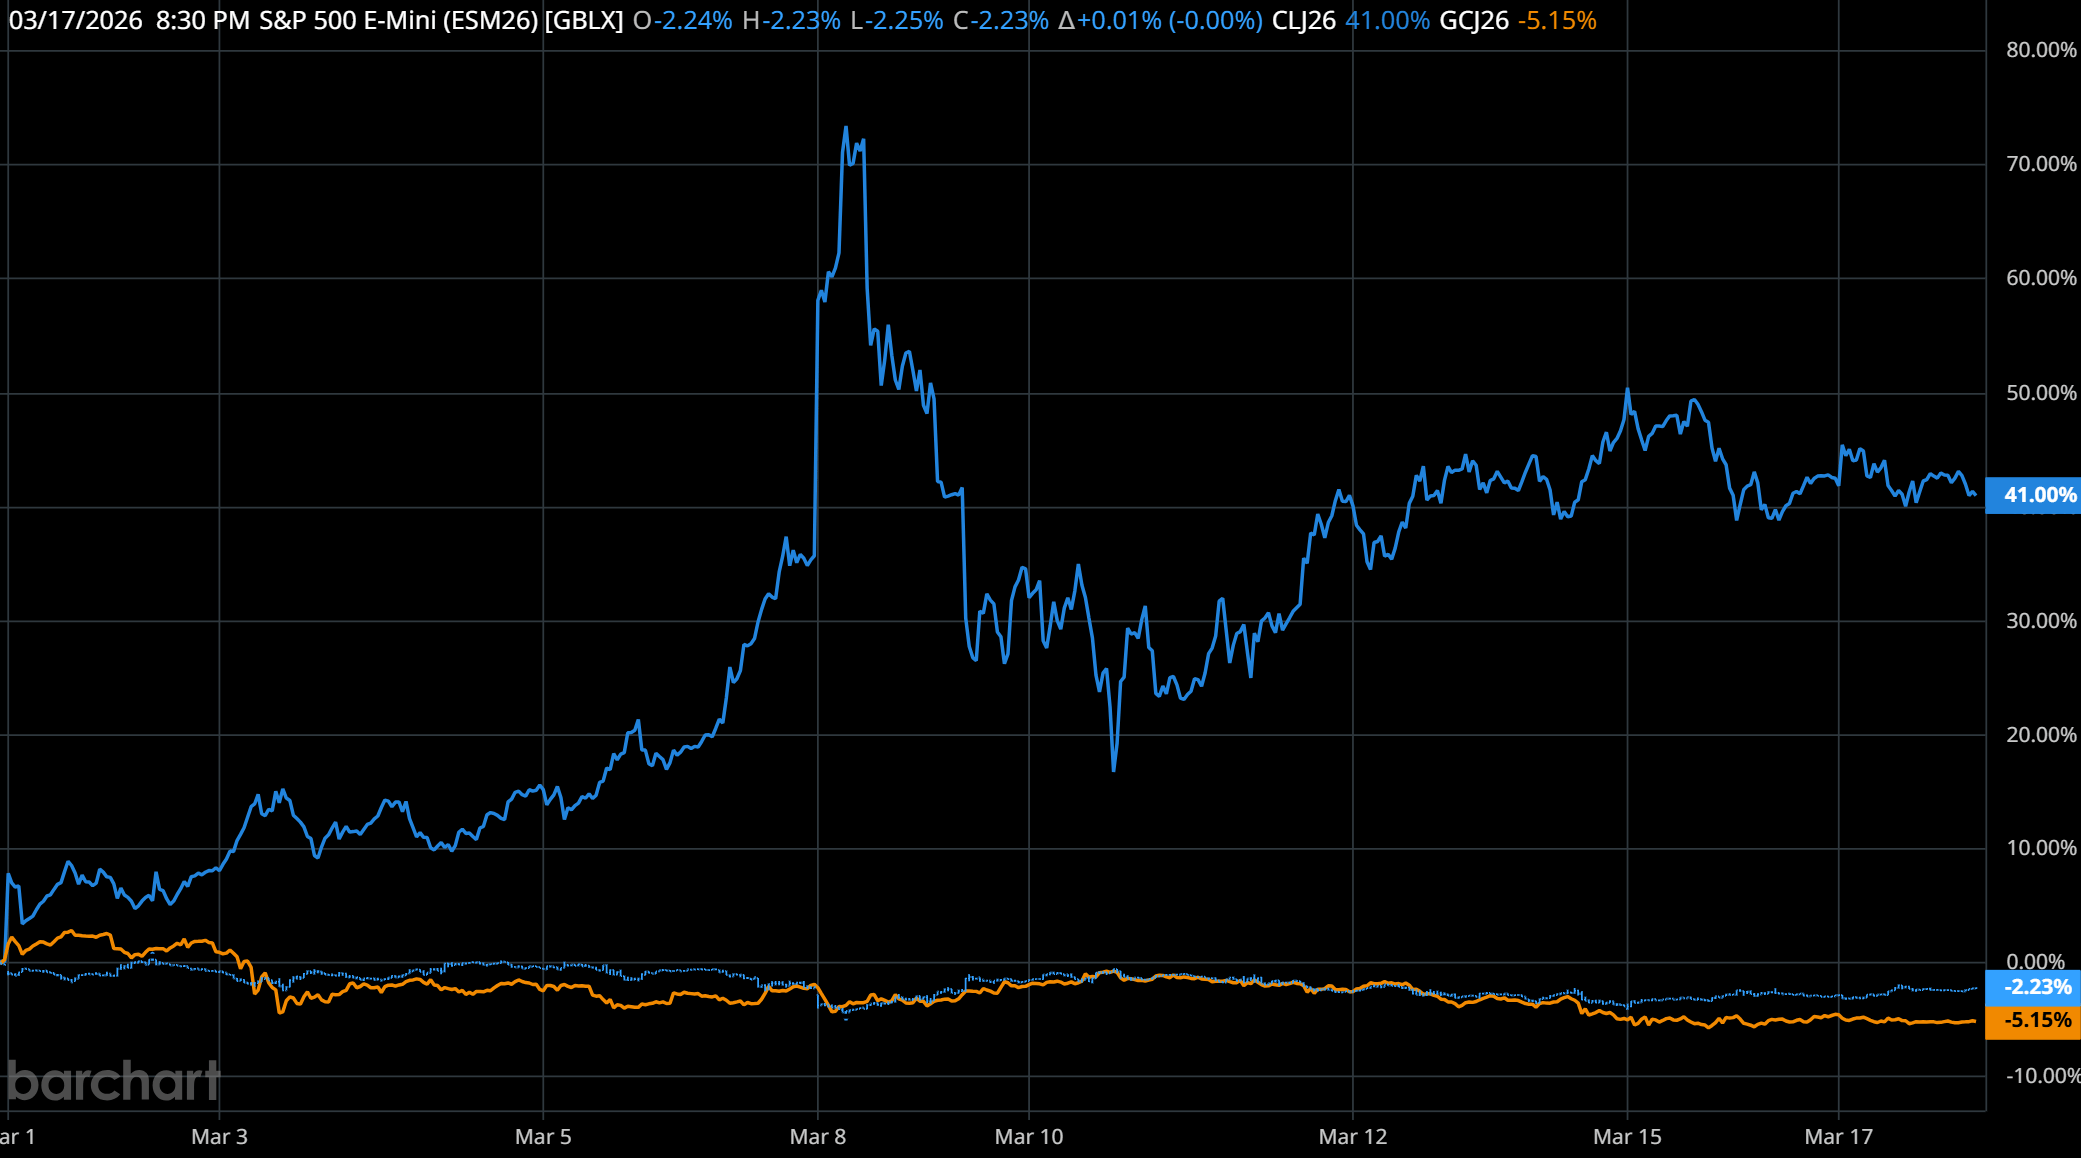
Above is a 15-day comparison chart of the ESM26 (June S&P future), the CLM26 (April Gold future), and the GCJ26 (April Gold). As you can see, the CL is up almost 41.23% while the ES is down 2.23% and gold is down 5.09%. Clearly, it’s been all about the energy markets!
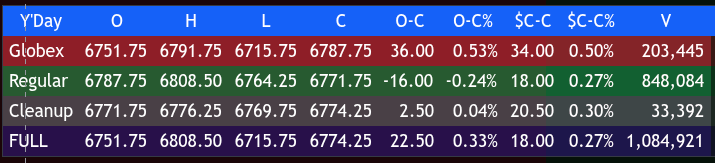
While things have been crazy for the last two weeks, the markets have calmed a bit over the last two days. The ESM26 made a high low at 6715.75 and made a high at 6791.75, and opened Tuesday’s 9:30 regular session at 6787.75.
After the open, the ES traded 6783.25, rallied up to 6808.50, sold off to 6779.25 at 10:15, rallied up to 6799.00 at 10:45, and sold off to 6766.25 at 11:35. The afternoon began with a rally up to 6780.50 at 12:05, another up to 6783.50 at 1:00, followed by some sideways back and fill. The ES then rallied up to 6787.50 at 2:10, sold off down to 6771.25 at 2:30, and rallied up to 6778.75 at 2:55, after which I posted this in the room:
IMPRO:Dboy:[2:57:25 PM]: something tells me weak close
The ES then pulled back to the 6770.25 level, rallied up to 6780.50 at 3:15, traded down to 6771.50 at 3:40 and then 6776.25 at 3:50. As the cash imbalance showed $400 million to buy, the ES traded down to 6769.00 and traded 6771.25 on the 4:00 cash close.
After 4:00, the ES did a sideways to up back and fill up to 6776.26 and settled at 6773.25, up 17.75 points or +0.26%, and up 1.30% over the last two sessions. The NQ settled at 25,015.50, up 124.25 points or +0.50% or up 1.66% over the last 2 sessions, the YM settled at 47,348, up 59 points or +0.12% and up 0.98% over the last 2 sessions, and the RTY settled at 2536.80, up 15.90 points or 0.63% or up 1.63% over the last 2 sessions.
In the end, you could see that the NQ was bid better than the ES in the morning and after the late weakness. In terms of the ES and NQ’s overall tone, I think the rollover has thinned out the outright volume in the index markets. In terms of the ES’s overall traded volume, it was low, 758k ESH traded, and 1.603 million ESM traded. I think you can do the math on that one.
I talked about how the rollover affects the overall trade last Friday and earlier this week, and while you may not see it, there has been a noticeable change. You could see it in the outright volumes.
The S&P 500 and Nasdaq found support from a weakening 10-year T-note yield, which shed 2 basis points to hit 4.20%. The move followed a lackluster ADP employment report (+9,000), signaling a hiring slowdown. While a 1.8% rise in pending home sales provided an additional fundamental boost, the “Iran factor” weighed on the indices, as surging oil prices acted as a primary headwind for the session.
Key Data Points Included
-
Sectors: Chipmakers and Travel.
-
Yields: 10-year T-note at 4.20% (-2 bp).
-
Jobs: ADP increase of +9,000 (4-week period).
-
Housing: Pending home sales +1.8% (vs. -0.6% expected).
-
Risk: Iran attacks on energy infrastructure / Rising WTI.
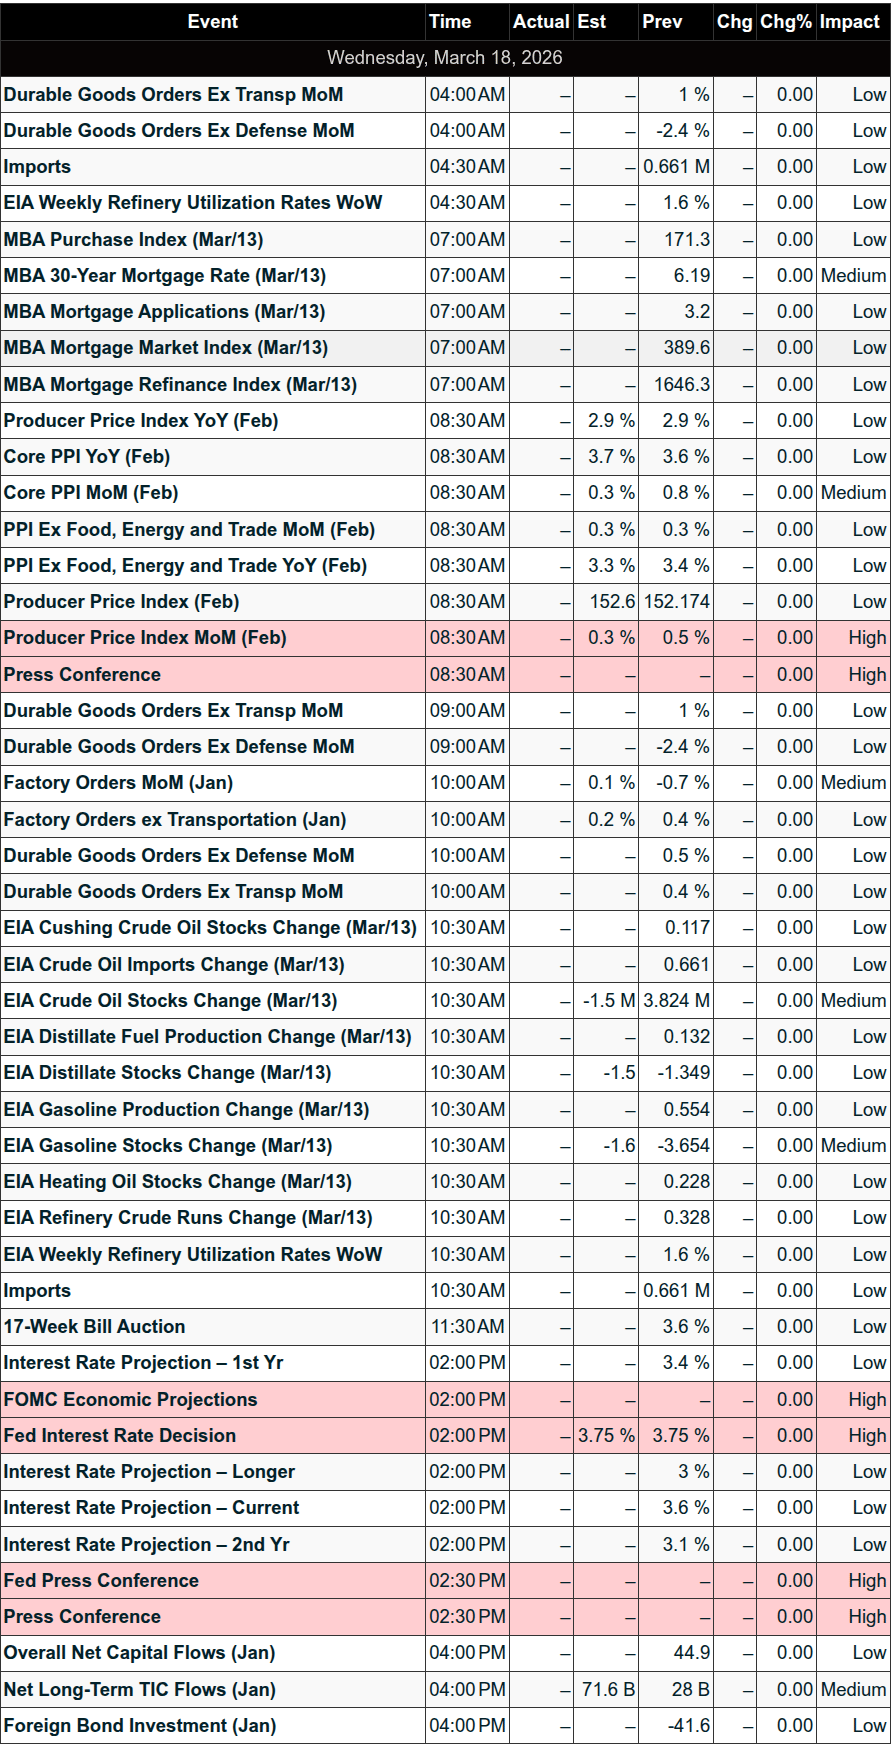
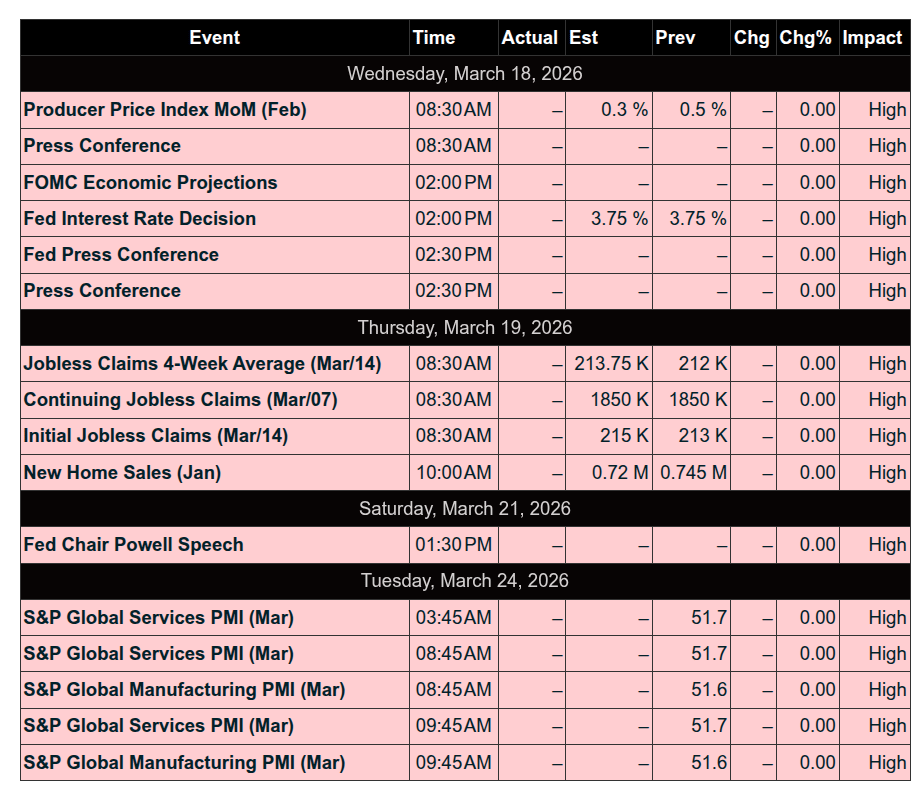
Economic Calendar
Wednesday, Mar 18: PPI Inflation Data (8:30 am); Factory Orders (10:00 am); FOMC Rate Decision (2:00 pm) & Chair Powell Presser (2:30 pm)
Thursday, Mar 19: Jobless Claims & Philly Fed Mfg (8:30 am); Wholesale Inventories & New Home Sales (10:00 am)
Friday, Mar 20: $7.1 Trillion Quarterly Expiration (Historic Market Event)
I am not going to dig into any of the news. NATO partners are declining Trump’s call for help in keeping oil moving through the Strait of Hormuz, and he is talking about delaying his meeting with Xi because of the ongoing war. What I can say is that while he has the support of many of the Middle East countries, none have really stepped up to the plate to help, which I would say is not a good thing.
Guest Posts
🔄 Transition: Cycle Day 3 → Cycle Day 1
Reset…Reload…Re-engage.
CD3 emotion fades into the rearview mirror.
Inventory clears.
Weak hands get rinsed.
Late shorts exhale like they just dodged traffic.
Late longs quietly Google “career alternatives.”
And just like that —
🎬 Cue the bell.
Brand. New. Cycle Day 1.
This is not continuation energy. This is foundation-pouring, blueprint-drawing, steel-beam-installing energy.
Cycle Day 1 doesn’t chase.
Cycle Day 1 builds.
It’s mechanical. It’s calculated. It tests Average Decline Levels with surgical intent. It forces emotional traders to show their cards early — and usually fold by noon.
This is where professionals:
✔️ Let price come to them
✔️ Let structure define bias
✔️ Let risk dictate size
✔️ Let patience do the heavy lifting
No headline chasing.
No social-media-induced FOMO.
No “this feels like” trades.
Just levels.
Structure.
Execution.
Volatility may expand. But so does our edge — because we operate from preparation, not prediction.
PTG doesn’t panic. PTG positions.
Welcome to Cycle Day 1.
Hard hats on.
Blueprints out.
Let’s build.
🧭 What CD1 Is All About
Cycle Day 1 is the framework session.
It establishes:
-
The dominant side of pressure
-
The tone for the next 72 hours
-
The location of trapped participants
-
The reference points institutions will defend or attack
No drama. No hero trades.
Just positioning.
🧠 CD1 Mindset
-
Early direction can be misleading.
-
The real tell is how price behaves at extremes.
-
Does it build value… or reject it?
Remember:
CD1 doesn’t need to be flashy.
It needs to be informational.
Let the market show its hand.
We just read the tape.
🎯 New cycle. Clean slate.
Let’s build the map.
PTGDavid
The Two Pillars of the PTG Trade Plan
1️⃣ Stay Aligned with the Dominant Force
Think current, not prediction.
When the price structure establishes a support zone, we don’t argue—we align. Bias shifts to a long-lean, and we patiently stalk entries via Stackers or the first PB ATR / Discount.
When structure flips? Same process, opposite direction. No emotion. No hero trades. Just flow.
Picture a surfer:
You don’t fight the wave—you paddle, position, and let gravity do the work.
2️⃣ Trade from Statistical Range Extremes
Welcome to the wabbit hunt 🐇
PKB entries inside the D-Level Money Box (DLMB) Zones live here. And let’s be clear—this is not counter-trend trading. This is timing.
When range values stretch too far, Market Makers don’t chase—they set traps. Stops get flushed. Liquidity gets harvested. Price snaps back like a rubber band.
This is reversionary trading inside range-type rhythms—
high accuracy, repeatable, and ruthless when executed correctly.
Cue the imagery:
Lights dim. Liquidity pools glow. Stops line up like dominos.
M&M’s smile. Click. Run the stops.
The Toolbox Matters—But the Hand Using It Matters More
The PTG Trader Toolbox has everything (yes, even the weird wrench you didn’t know you needed).
Your job isn’t to use everything.
Your job is to master the right tools for your plan.
The PTG Member’s Area is stacked—dozens of educational videos, real trade examples, and market walkthroughs designed to compress learning curves and eliminate guesswork.
And when the chart gets loud?
PTGDavid is always in the room.
Guiding. Grounding. Keeping traders on the right side of structure and statistics.
🎯 Cycle Day 1 Focus
Scenarios for today’s trade
🟢 Bull Case — Buyers Stay in Control
Acceptance north of 6775 ±5
Upside objectives:
• 6805
• 6795
• 6785
🔴 Bear Case — Rotation / Reset
Acceptance south of 6775 ±5
Downside objectives:
• 6760
• 6750
• 6740
📊 Key Reference Levels
• PVA High Edge: 6789
• PVA Low Edge: 6770
• Prior POC: 6775
⚠️ Tactical Takeaway
Of course, nothing changes for PTG…Simply follow your plan. Take only Triple A setups and manage the $risk. ALWAYS HAVE HARD STOP-LOSSES in-place on the exchange.
PTG’s Primary Directive (PD) is to ALWAYS STAY IN ALIGNMENT with the DOMINANT FORCE.
— PTG
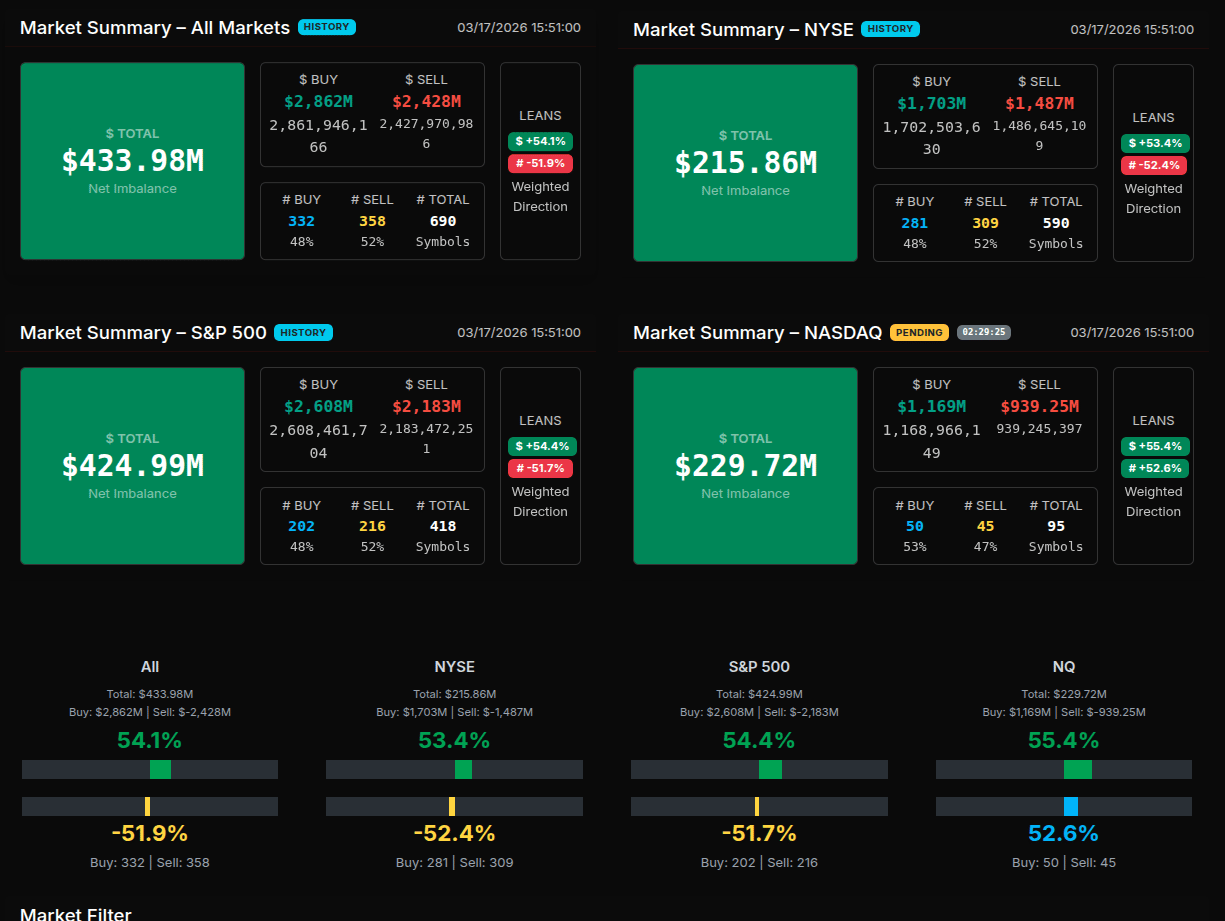
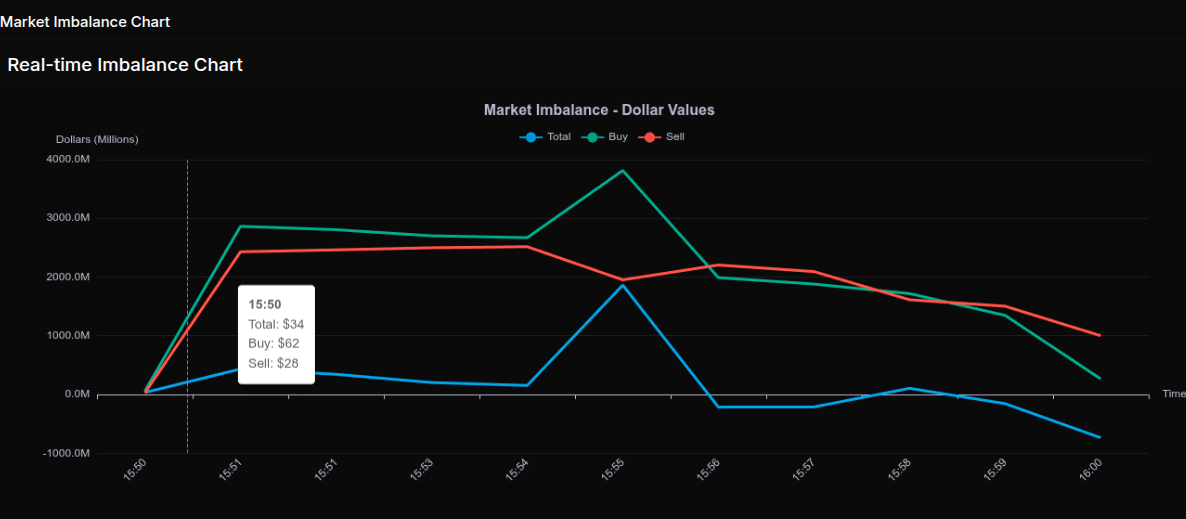
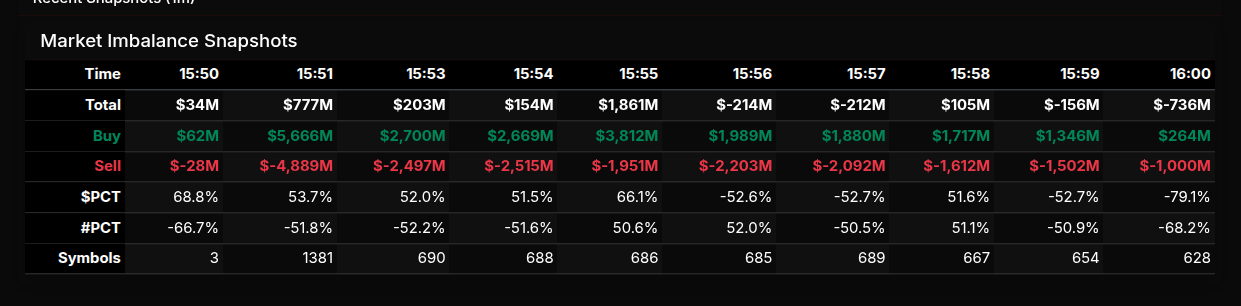
MOC Recap
The MOC developed with a constructive but rotational tone before transitioning into a more decisive sell imbalance into the close. Early snapshots showed strong buy-side pressure, with total imbalances building from $34M at 15:50 to a peak near $1.86B by 15:55. During this phase, buy programs were dominant, consistently printing above $2.5B and peaking over $3.8B, indicating broad institutional participation. The $PCT readings during this window ranged from 51% to 66%, reflecting more rotational accumulation rather than aggressive one-sided flows.
However, the character of the auction shifted notably after 15:55. From 15:56 onward, the tape flipped into persistent sell pressure, with totals turning negative and closing at -$736M. The final $PCT reading of -79.1% stands out as a wholesale sell program, confirming aggressive distribution into the close rather than passive rebalancing.
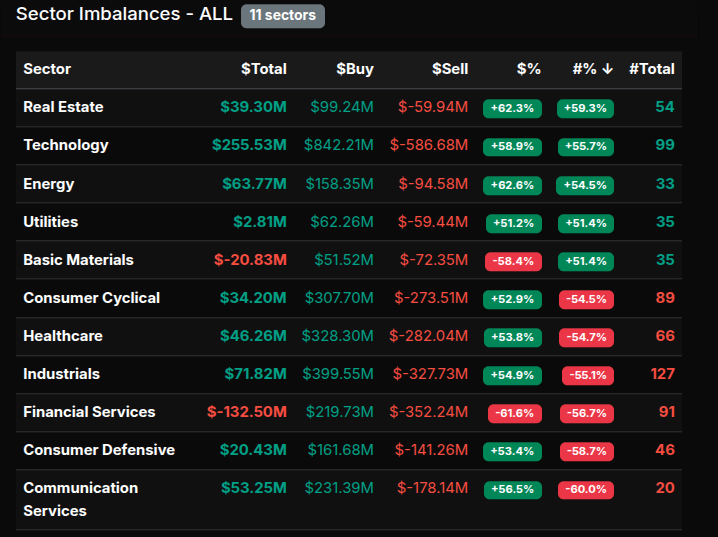
Sector-wise, the session leaned broadly positive but lacked extreme conviction. Energy (+62.6%), Real Estate (+62.3%), and Technology (+58.9%) led on a percentage basis, though none breached the 66% threshold that would signal true institutional urgency. Financials were the clear laggard at -61.6%, approaching but not fully reaching capitulation levels. Most other sectors clustered in the 50–56% range, reinforcing the rotational nature of the earlier flows.
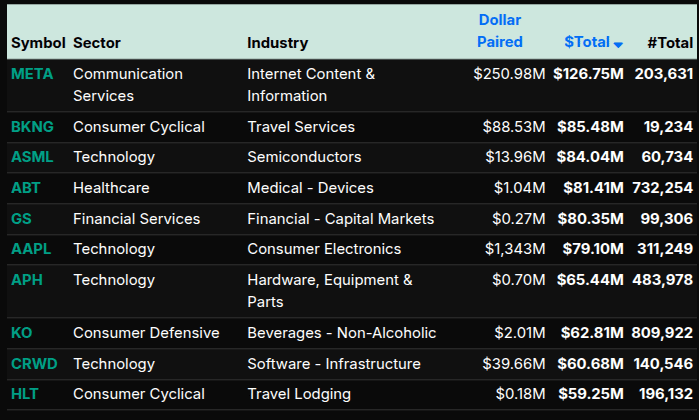
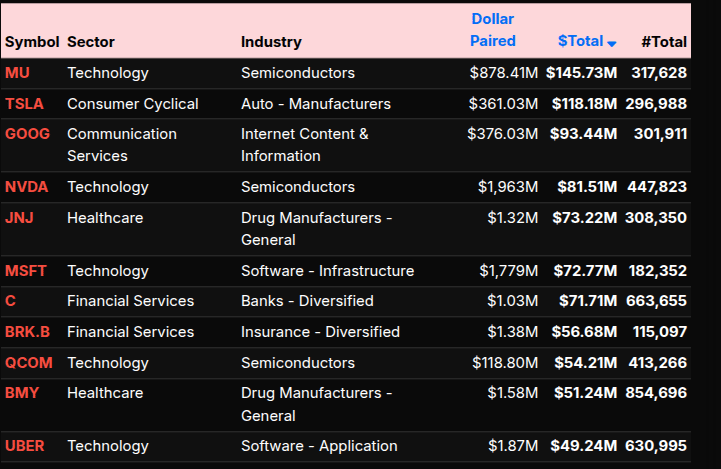
On a symbol level, leadership was concentrated in large-cap tech and communication names. MU (+145M), TSLA (+118M), GOOG (+93M), NVDA (+81M), and MSFT (+72M) drove much of the buy-side activity. Additional support came from META (+126M), AAPL (+79M), and ASML (+84M), indicating broad participation across semiconductors and mega-cap growth. Financials showed mixed flows, with C (+71M) and BRK.B (+56M) offset by the sector’s broader weakness.
Overall, the MOC tells a story of early rotational buying that failed to sustain, ultimately giving way to a late-stage institutional sell program into the close.
Technical Edge
Fair Values for March 18, 2026:
-
SP: 54
-
NQ: 231.15
-
Dow: 319.38
Daily Breadth Data 📊
For Tuesday, March 17, 2026
• NYSE Breadth: 70% Upside Volume
• Nasdaq Breadth: 62% Upside Volume
• Total Breadth: 63% Upside Volume
• NYSE Advance/Decline: 68% Advance
• Nasdaq Advance/Decline: 60% Advance
• Total Advance/Decline: 63% Advance
• NYSE New Highs/New Lows: 79 / 51
• Nasdaq New Highs/New Lows: 74 / 157
• NYSE TRIN: 0.90
• Nasdaq TRIN: 0.89
Weekly Breadth Data 📈
For the week ending Friday, March 13, 2026
• NYSE Breadth: 42% Upside Volume
• Nasdaq Breadth: 54% Upside Volume
• Total Breadth: 49% Upside Volume
• NYSE Advance/Decline: 22% Advance
• Nasdaq Advance/Decline: 32% Advance
• Total Advance/Decline: 28% Advance
• NYSE New Highs/New Lows: 151 / 226
• Nasdaq New Highs/New Lows: 226 / 575
• NYSE TRIN: 0.39
• Nasdaq TRIN: 0.41

Trading Room Summaries
Polaris Trading Group Summary – Tuesday, March 17, 2026
The day started off exceptionally strong, with both sides of the Daily Trade Strategy (DTS) fulfilled early, setting the tone for a highly technical and well-executed session.
Morning Session – Precision & Momentum
Right out of the gate, the market delivered:
-
Overnight downside target 6715 hit
-
Upside targets 6775 → 6785 → 6805 all fulfilled
This is about as clean as it gets. The market respected the 6750 pivot, and once buyers held above it, the bull case played out exactly as planned.
Key observations:
-
Strong acceptance above 6785
-
D-Level (6802.25) tagged cleanly
-
6805 target hit with authority
-
No meaningful counter-sell response → clear sign of buyer control
David emphasized the importance of:
-
Acceptance at higher levels
-
Clean inventory and orderly tempo
-
Letting structure confirm continuation rather than guessing tops
Lesson: When price accepts above key pivots and sellers fail to respond, continuation trades have high probability. This was a textbook trend morning.
Midday – Rollover Chop & Patience
As expected during rollover week:
-
The market lost rhythm after the first hour
-
Transitioned into balance / low-quality chop
David called it out clearly:
-
“Sitting on hands in this mess”
-
Reinforced that not trading is a position
Lesson: Knowing when not to trade is just as valuable as executing. Rollover environments often kill momentum.
Afternoon – Controlled Setup
Later in the day:
-
A 2 PM “Shake n Bake” play developed
-
Backtest of 6785 prior high → rejection
-
Price rotated back toward mid-VWAP
This provided a structured, reaction-based trade, not a chase.
Trade of the Day
-
Early D-Level sell (around 6800 zone)
Even in a bullish environment, this highlights:
-
The importance of location
-
Trading against stretched levels when structure confirms
Key Takeaways
-
DTS levels were exceptionally accurate – multiple targets hit on both sides
-
Acceptance > prediction → wait for confirmation above/below pivots
-
Rollover = reduced edge after initial moves
-
Best trade windows are early, especially during contract transitions
-
Discipline to sit out chop preserved gains
Discovery Trading Group Room Preview – Wednesday, March 18, 2026
Morning Market Brief
Focus today is squarely on the FOMC (2pm ET) with no rate change expected, but attention on the dot plot and Powell’s presser as rising oil prices and Middle East tensions cloud the inflation outlook.
Oil moved ~3% higher Tuesday amid geopolitical risk, though Iraq-Kurdistan export progress could help offset supply disruptions.
Macro:
-
Volatility elevated (ES 5-day ADR: 103)
-
No strong whale positioning overnight
-
Key data: PPI, Factory Orders, Crude Inventories
Equities / News:
-
NVDA gains tailwind as China approves H200 chip sales (potential re-entry into a key market)
-
MSFT weighing legal action vs OpenAI over AWS deal with AMZN (cloud exclusivity conflict)
-
BABA raises AI pricing (chips + cloud), signaling strong demand
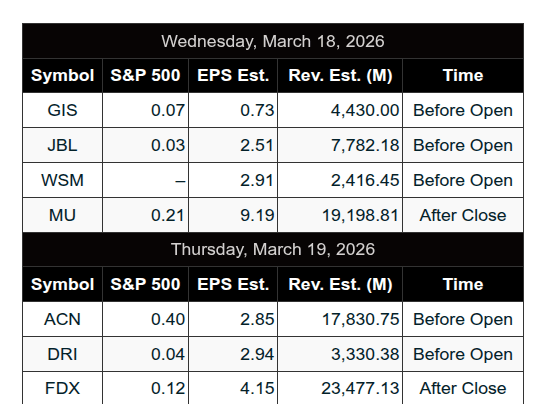
Earnings:
-
Premarket: GIS, JBL, WSM
-
After close: MU, FIVE
-
Tomorrow: ACN, BABA, DRI, PDD
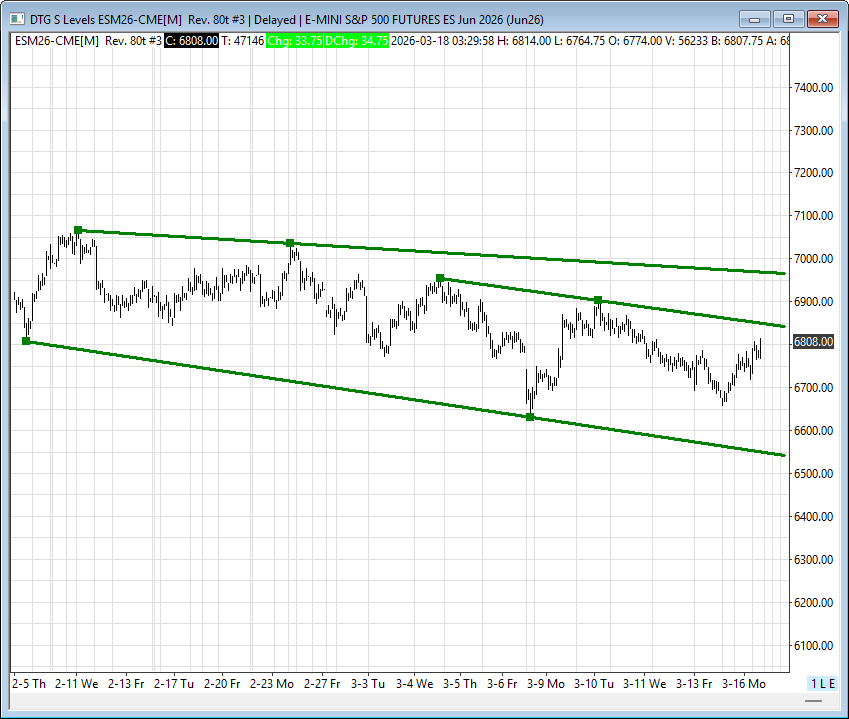
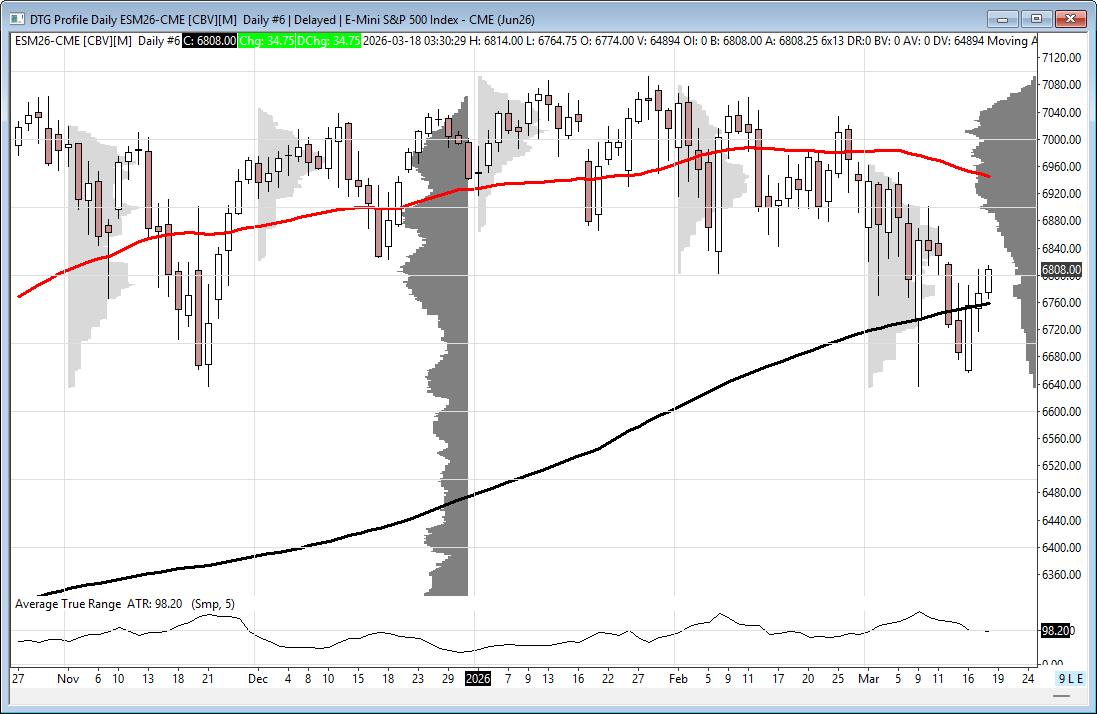
Technical (ES):
-
Holding above 200-day MA (6759) = longer-term bullish support
-
Still within short-term downtrend channel
-
Key resistance: 6845/40, 6965/60
-
Key support: 6545/40
Bottom line: Market in wait-and-see mode into FOMC, with elevated volatility and macro uncertainty driving price action.
Affiliate Disclosure: This newsletter may contain affiliate links, which means we may earn a commission if you click through and make a purchase. This comes at no additional cost to you and helps us continue providing valuable content. We only recommend products or services we genuinely believe in. Thank you for your support!
Disclaimer: Charts and analysis are for discussion and education purposes only. I am not a financial advisor, do not give financial advice and am not recommending the buying or selling of any security.
Remember: Not all setups will trigger. Not all setups will be profitable. Not all setups should be taken. These are simply the setups that I have put together for years on my own and what I watch as part of my own “game plan” coming into each day. Good luck!
This post goes out as an email to our subscribers every day and is posted for free here around 2 PM ET. To get your real-time copy, sign up for the free or premium version here: Opening Print Subscribe.
Comments are closed