Down 4 Days In a Row…
Can the bulls get a bounce going?
Follow @MrTopStep on Twitter and please share if you find our work valuable!
Every week, MrTopStep invites traders to an “Own the Close” contest where the closest guesstimate where the SPX will settle on Friday’s 4:00 cash close.
The winners get a free week’s access to the MrTopStep Chat and trading tools. Enter your guess now!
Our View
Well, the Fed funds/public has finally woken up to the idea of the rate cuts. Traders are pricing in just a 16% chance that the Fed will lower its policy rate at its June meeting, according to CME Group’s FedWatch tool.
A month ago, the likelihood of a cut was 55%, and have responded by the continued selling in the stock market with all three major indexes down 4% or more so far this month. Some of the main weakness is coming from the tech sector. Yesterday chip stocks fell, continuing a recent slide for a sector that has shined over the past year. The #PHLX Semiconductor Index declined 3.2% and is down 6.9% for the month.
Let’s face it, the stock market is bleeding but…it’s down 4 in a row.
Our Lean
I can’t rule out another drop, but the stats are very bullish after 4 down days in a row. Is that enough to push the markets higher? I think so and the oversold conditions have only increased. That said if Israel strikes back at Iran like they keep saying, then we probably drop again.
There was a guy on CNBC yesterday morning talking about the headline algos and how they have taken over. That’s not something that we don’t already know. My gut feeling is that the selling tapers off over the next few sessions. Remember, Friday is the April options expiration.
MrTopStep Levels:

MiM and Daily Recap
ES Recap
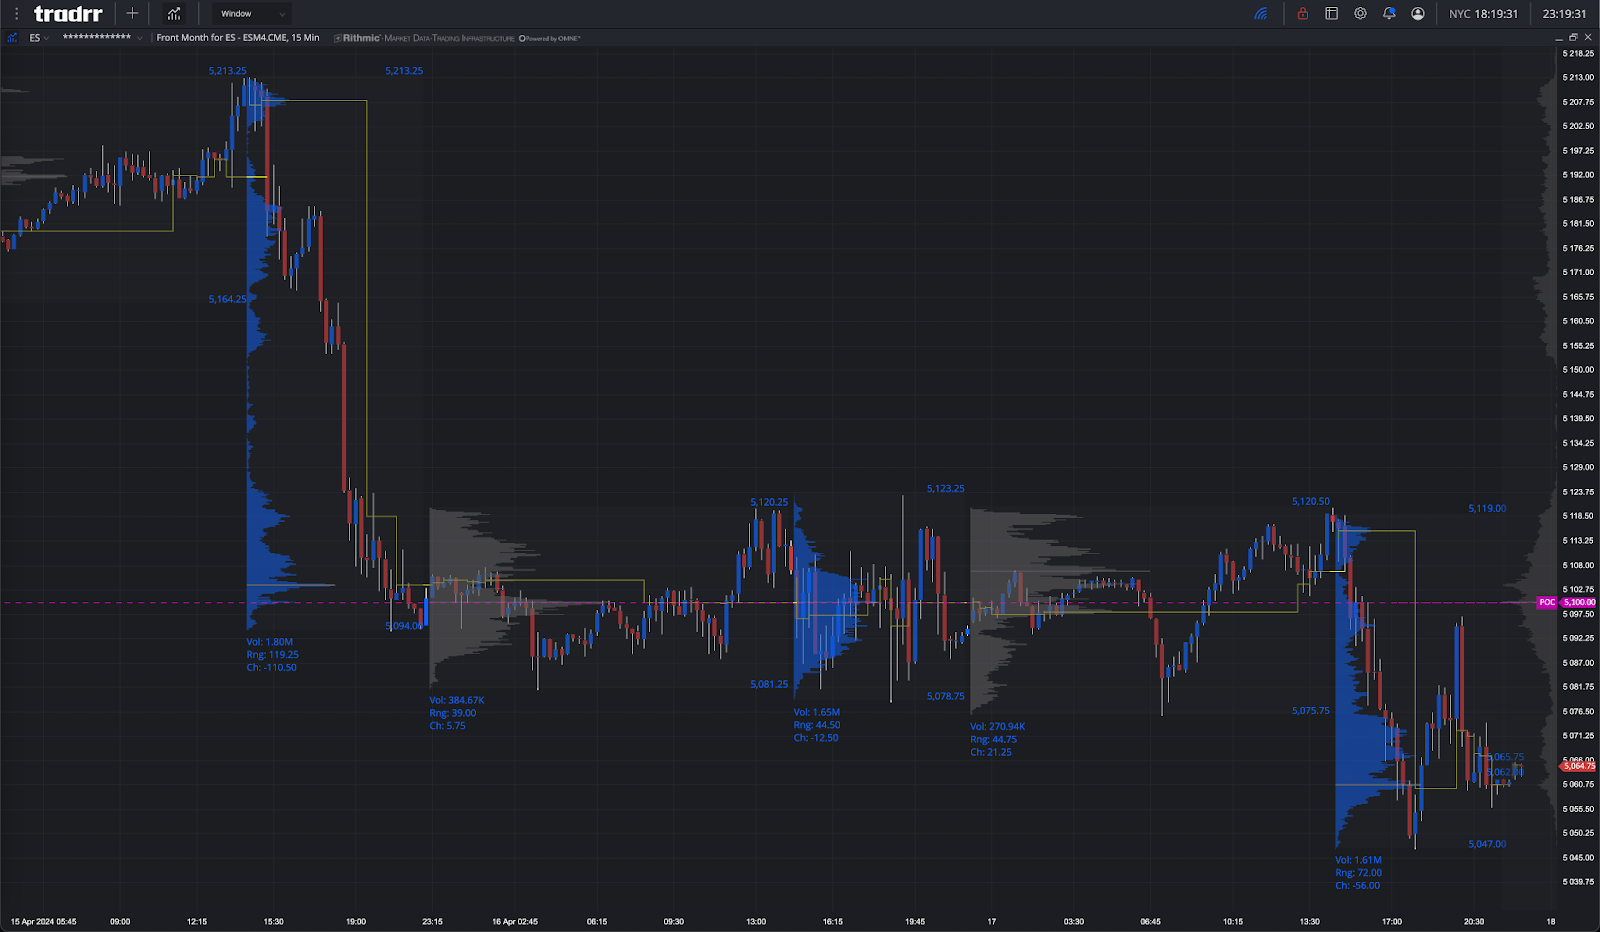
The ES traded up to 5120.50 at 9:20 am and opened Wednesday’s regular session open at 5117.50. After the open, the ES traded 5119.50, pulled back to the 5109.00 level, rallied up to a lower high at 5119.00 and that was the last time we saw that price. After the higher low, the ES and NQ got hit with wave after wave of sell programs and pushed the ES below yesterday’s low at 5078.00 at 11:00 and then rallied up to 5096.50 at 11:10 and then made a sequence of lower lows down to 5047.00 at 12:50.
After the low, the ES rallied up to 5082.25 at 2:00, pulled back to 5069.75 at 2:20 and then popped up to 5097.00 at 2:50 which ended up being the late-day high and then sold off down to 5068.75 at 3:00. From there, the ES up-ticked and then dropped down to 5059.50, rallied up to 5070.75 at 3:30 and traded 5072.50 as the 3:50 cash imbalance showed $850 million to sell, traded up to 5074.00 and traded 5060.75 on the 4:00 cash close. After 4:00, the ES pulled back to 5060.75 and settled at 5061.50, down 33 points or -0.65%, the NQ settled at 17,663.25, down 229.25 points or 1.28%. The yield on the 10-year note yield settled at 4.584%, down from 4.657% and U.S. crude oil prices settled at $82.69 a barrel, down 3.1%. Gold futures fell 0.8% to settle at $2,371.70 a troy ounce.
“Everything is moving.”
In the end, the S&P fell for its 4th session in a row. In terms of the ES’s overall tone, it was a train wreck. In terms of the ES’s overall trade, volume has picked up on the downside: 283k traded on Globex and 1.593 million traded on the day session for a total of 1.876 million contracts traded.
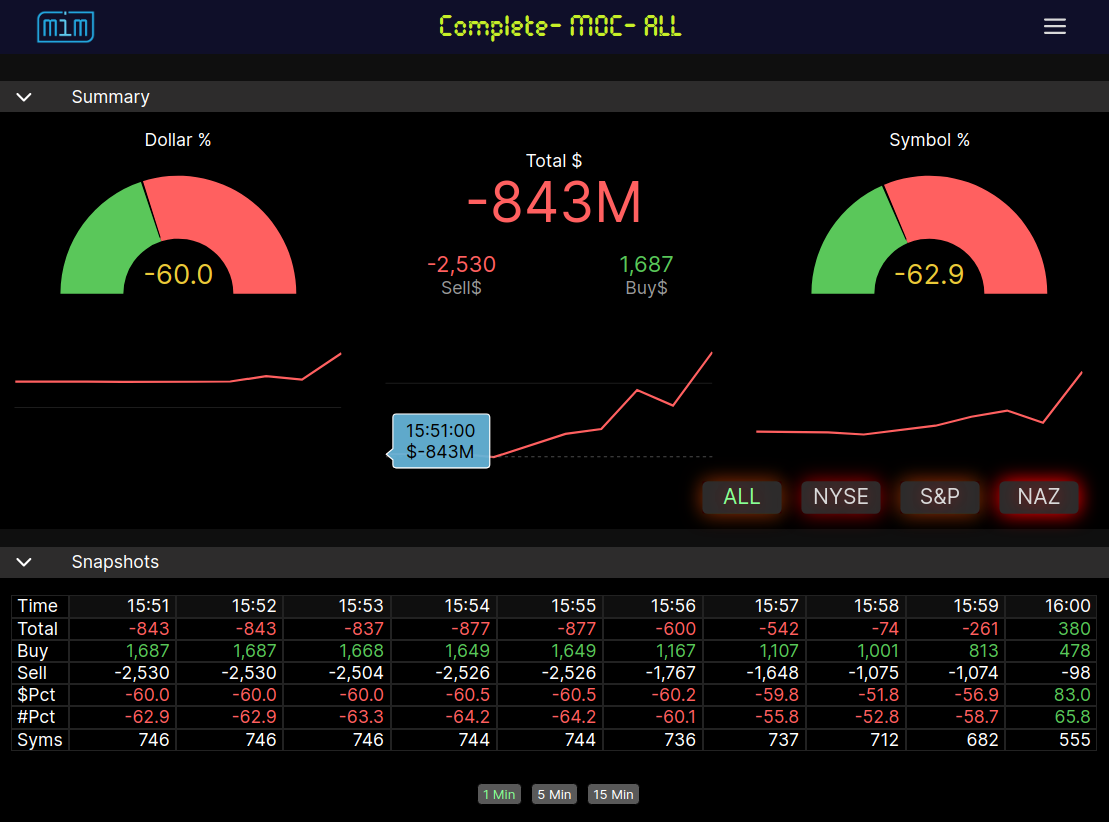
MIM recap
Technical Edge
-
NYSE Breadth: 51% Upside Volume
-
Nasdaq Breadth: 48% Upside Volume
-
Advance/Decline: 47% Advance
-
VIX: ~18
Guest Post — Tick Titan Trading Room
Hey Traders!
Hope you are all hanging in there during this difficult time in the markets. I have another setup in play for you. It is the same setup that I wrote about on March 14th. To jog your memory: This specific setup is one that I have traded for a few years now which I call Athena, which is a 3-line strike that I personally modified to give it an above-average profit ratio, can be used across any instrument.
It is currently set up for ES and NQ Daily charts. I trade this specific setup on a 15-minute, 60-minute or a daily.
The current prices that I am currently monitoring are: NQ Daily Chart must break above 17968.50 for a long. Entry would be 1 tick above at 17968.75. It must break above 17968.5 before the close on Friday, April 19th, or it will be considered invalid.
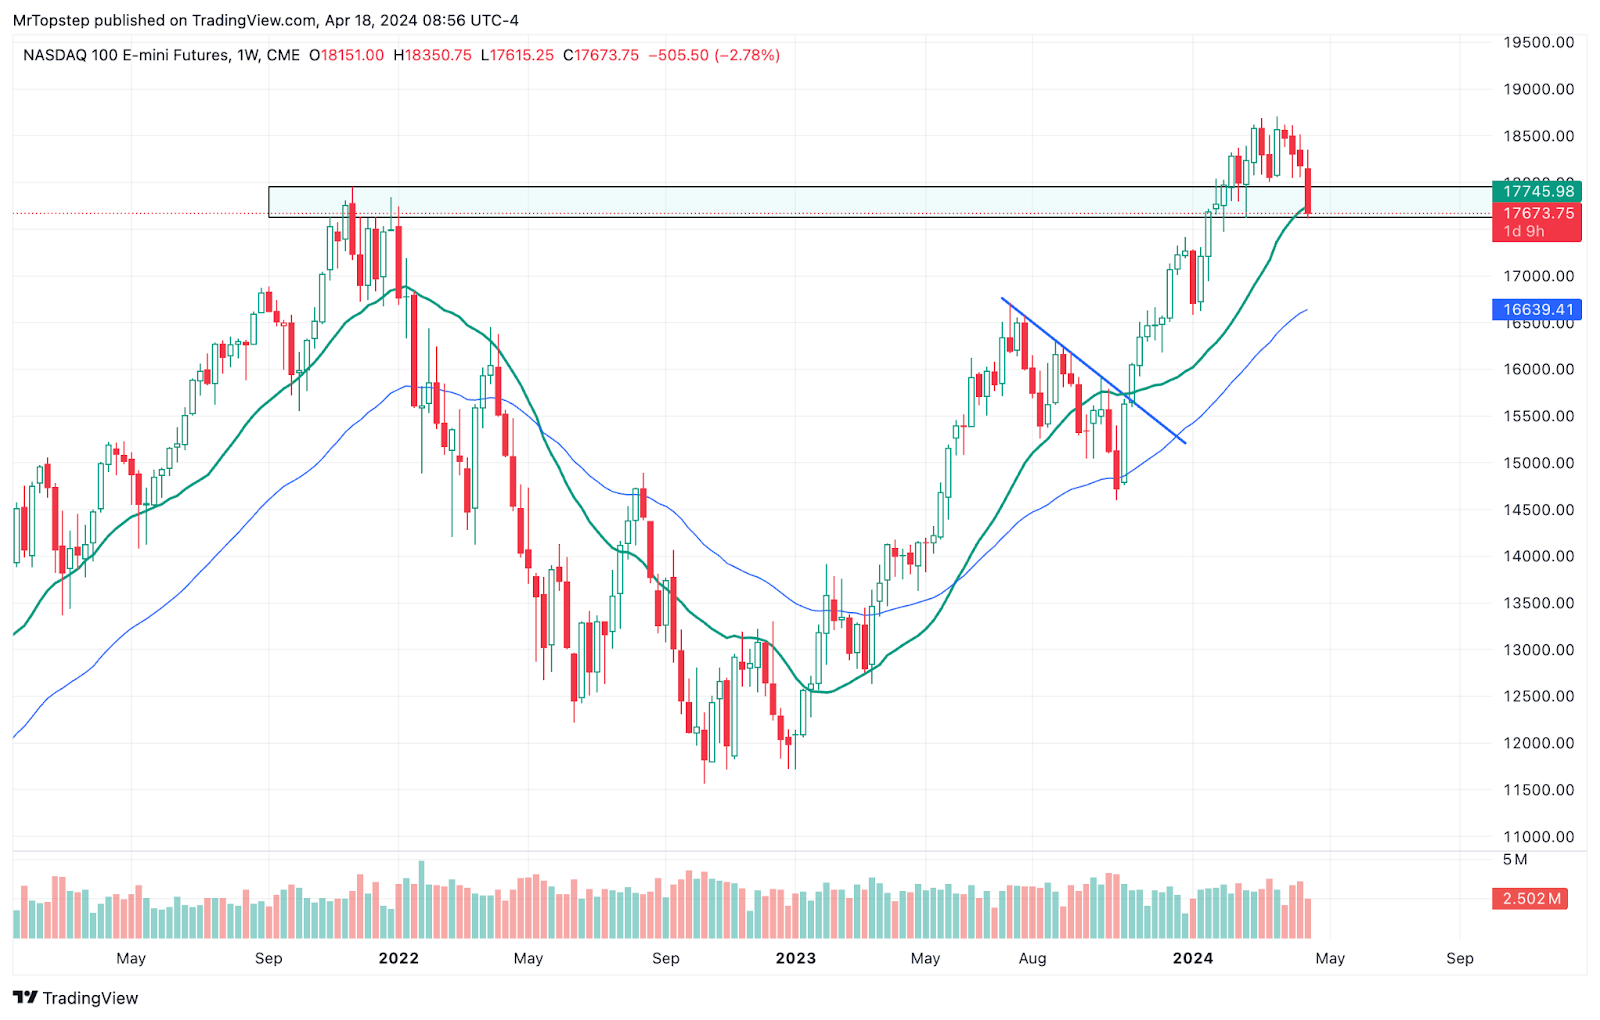
NQ weekly
ES Daily Chart must break above 5120.50 for a long. Entry would be 1 tick above at 5120.75 for a long. It must break above 5120.50 before the close on Friday, April 19th, or it will be considered invalid.
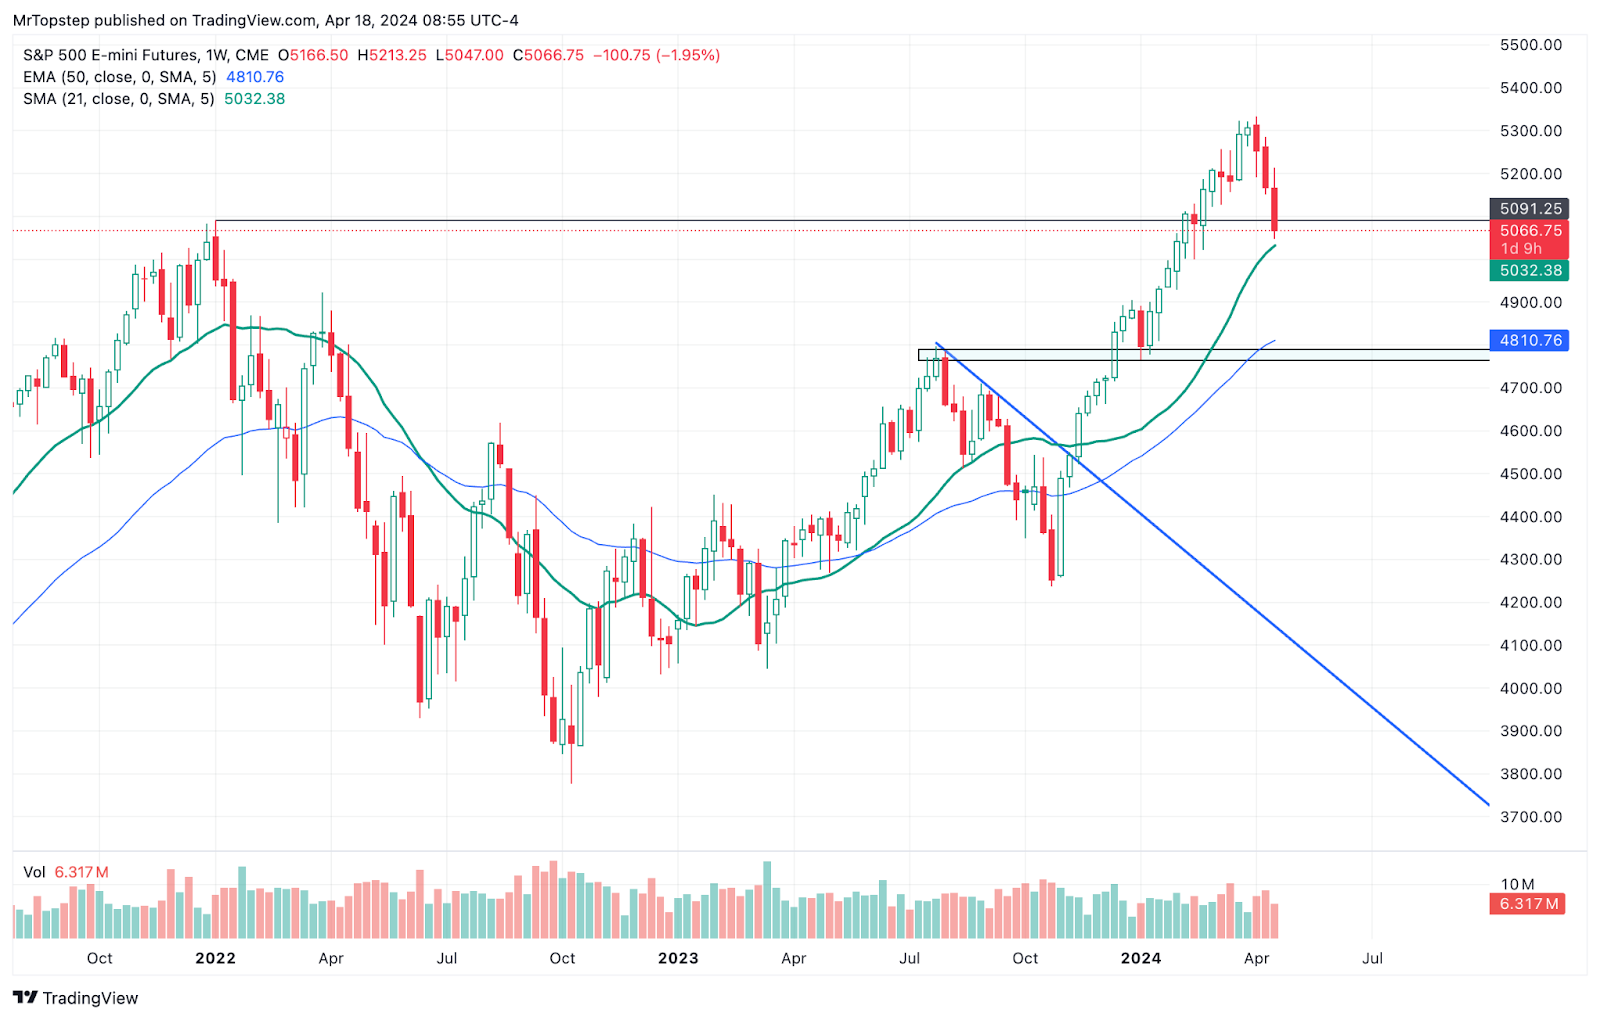
ES Weekly
As I stated before:
How far will these go should they trigger? No clue. Impossible to know how far any market will go. All we can do is manage a trade once we enter. Finding ways to enter any market is the easy part. Working on building setups based on price action/price patterns, and then trading them for months on end and ensuring that there is a high win rate, is what I am always working on as a trader. Athena is one of my favorite setups, as it has stood the test of time.
When I am trading in my room, I alert fellow traders when I am exiting. We all know that trading is not ‘cut and dry’, so to speak. On that note, all I can recommend is that you use what you deem proper risk management. Everyone has a different account size and risk tolerance. If trading off of a Daily Chart is too large for you, no worries! Just monitor the above mentioned trigger points, and go to you timeframe of choice. Scalp every pullback to the long side and you should be green!
Should you wish to join us in our trading room, here are some links for you:
If you are struggling to stay green in these markets, know that you are not alone. I have heard of numerous traders blowing their accounts out – getting stuck in sideways/range bound markets is definitely hurting a LOT of traders. You are welcome to join us, and I will do my very best to help you keep your head above water, and be green by the end of each week.
Economic Calendar
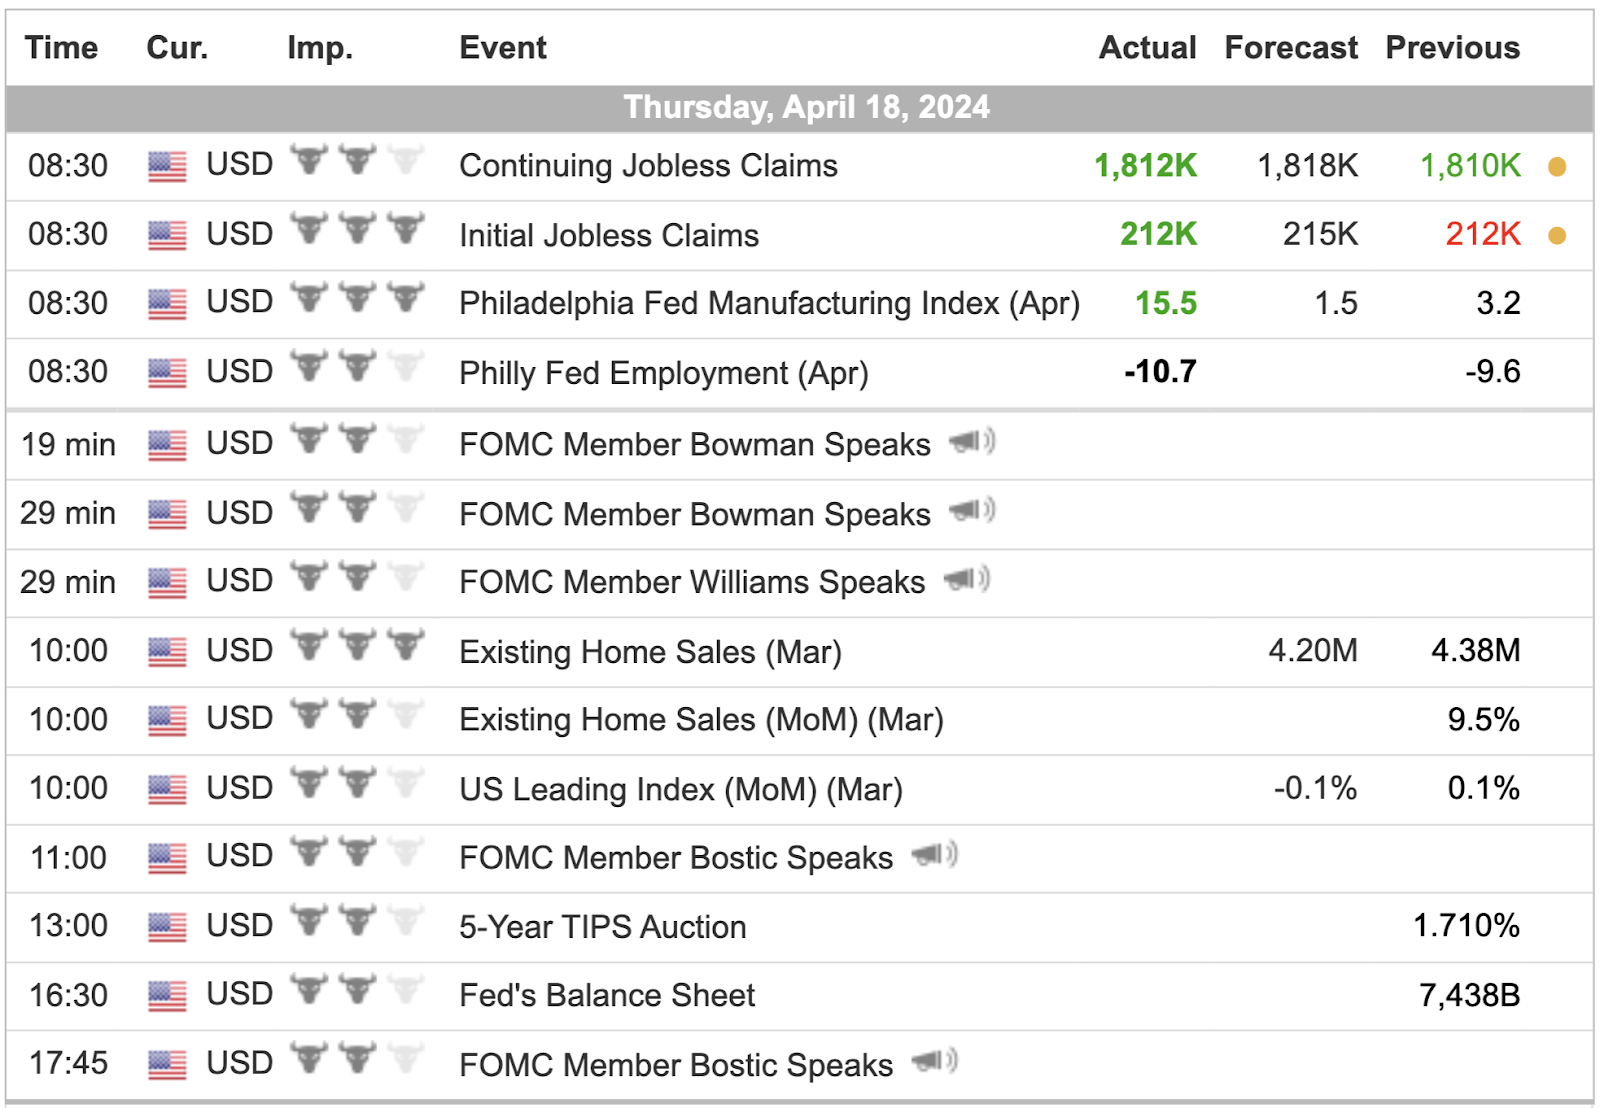
For a more complete Economic Calendar see: https://mrtopstep.com/economic-calendar/
Comments are closed