This post goes out as an email to our subscribers every day and is posted for free here around 2 PM ET. To get your real-time copy, sign up for the free or premium version here: Opening Print Subscribe.
April 30, 2026 | Read online
End-of-Month Madness: Weak Hands Selling Rips, Smart Money Scooping Dips
Follow @MrTopStep on Twitter and please share if you find our work valuable!

I can’t wait until the ring of the closing bell on Friday. This is pure insanity.
Google’s profits jumped 81% as its cloud business boomed, and META revenue jumped 33% to $56.3 billion in the first quarter. Yet the company simultaneously raised its capital expenditure outlook due to rising component costs and increased AI infrastructure spending.
AMZN posted double-digit growth because of its expanding web services, and beat analyst estimates with a 17% jump in revenue and a sharp increase in net profit. Last but not least, MSFT also reported strong cloud growth, with sales reaching $82.9 billion in the January-to-March quarter, exceeding Wall Street expectations, but fell 2% in after-hours trading.
When you look back to October of 2025, one has to wonder where all the AI bubble talk came from.
7250 ON TAP

When you take everything into account, the ES and NQ remain extremely resilient. Sure, the mix of AI/tech earnings boosted the market late in the day, but these markets don’t seem to care about the war with Iran or higher oil prices.
This is a confusing state of affairs that remains extremely fluid and volatile. I know some will say there have been times like this in the past, but I don’t believe so. I also do not believe the war with Iran is going to end anytime soon, as Trump told his aides to prepare for an extended blockade.
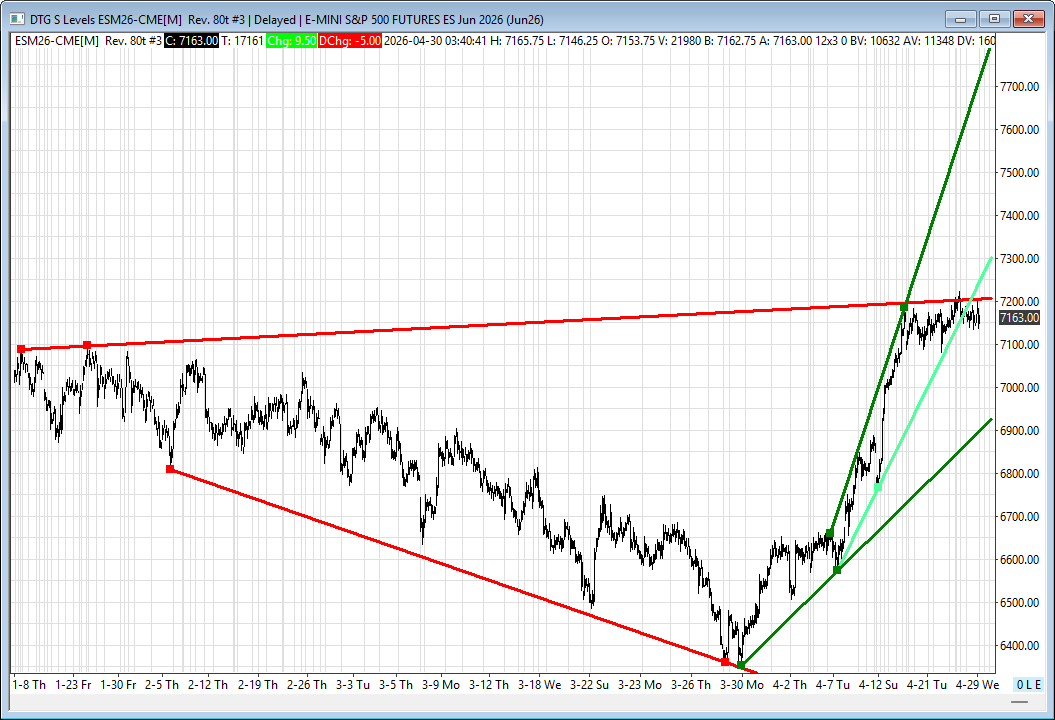
Our lean: Tell me I’m crazy, but I think the ES is heading to new highs, which is 7223.25. That does not mean you can just buy them anywhere; it means continuing to buy the pullbacks/weakness.
Can you believe it? Today is the last trading day of April. The stats are positive, mixed in with some daily moves that are noisy and often driven by contemporaneous events such as earnings, economic data, and news.
My guess is that there is some end-of-April rebalancing and new money going into the first few trading days of May.
I can rule out selling a big gap up, but there may be some residual earnings buying left over after the open, so if you go that route, it may be better to sell the early rallies and buy the pull backs/drops or stay with the trend, be patient and buy the pull-backs.
Claude AI Market Profile ES levels
Resistance Levels Support Levels
7,314.50 7,187.00 (POC)
7,288.75 7,184.02
7,262.25 7,176.57
7,254.92 7,168.00 (Previous Close)
7,234.17 7,163.47
7,227.07 7,163.33 (Pivot)
7,223.25 7,162.81
7,222.83 7,161.50
7,214.50 (VAH) 7,158.79
7,196.50 7,154.25 (VAL)
7,195.75 7,151.98
7,195.42 7,148.50
7,190.66 7,145.34
7,140.25
7,135.92
7,132.00
Core Market Profile Levels
-
Point of Control (POC): 7,187.00
-
The single price level where the most time was spent during the session.
-
It acts as a major magnet for price.
-
-
Value Area High (VAH) & Low (VAL): 7,214.50 | 7,154.25
-
These mark the boundaries of the range where 70% of the session’s activity occurred.
-
Price staying within these levels often suggests a balanced market.
-
Sustained moves outside these boundaries can signal a strong trend or breakout.
-
-
Initial Balance (IB): 7,192.25 – 7,165.50
-
The price range established during the first hour of trading.
-
Breakouts from the IB often indicate the day’s likely direction.
-
-
Single Prints / Tails: 7,218.75 | 7,138.50
-
Areas where price moved so quickly that only one Time Price Opportunity (TPO) was recorded.
-
These often indicate institutional rejection at extremes and serve as future support or resistance.
-
Expanded Profile Observations
-
Poor High / Poor Low
-
Watch for lack of excess (tails) at 7,196.50 or 7,148.50.
-
If price fails to create a “tail,” these levels are likely to be revisited.
-
-
Volume Nodes
-
Look for high volume clusters (HVN) near 7,187.00 and low volume nodes (LVN) near 7,205.00.
-
Price may slice through quickly at LVNs.
-
-
Open Relation to Value
-
Note if the market opens inside or outside the previous day’s Value Area (7,154.25 – 7,214.50).
-
This helps determine if there is an immediate change in sentiment.
-


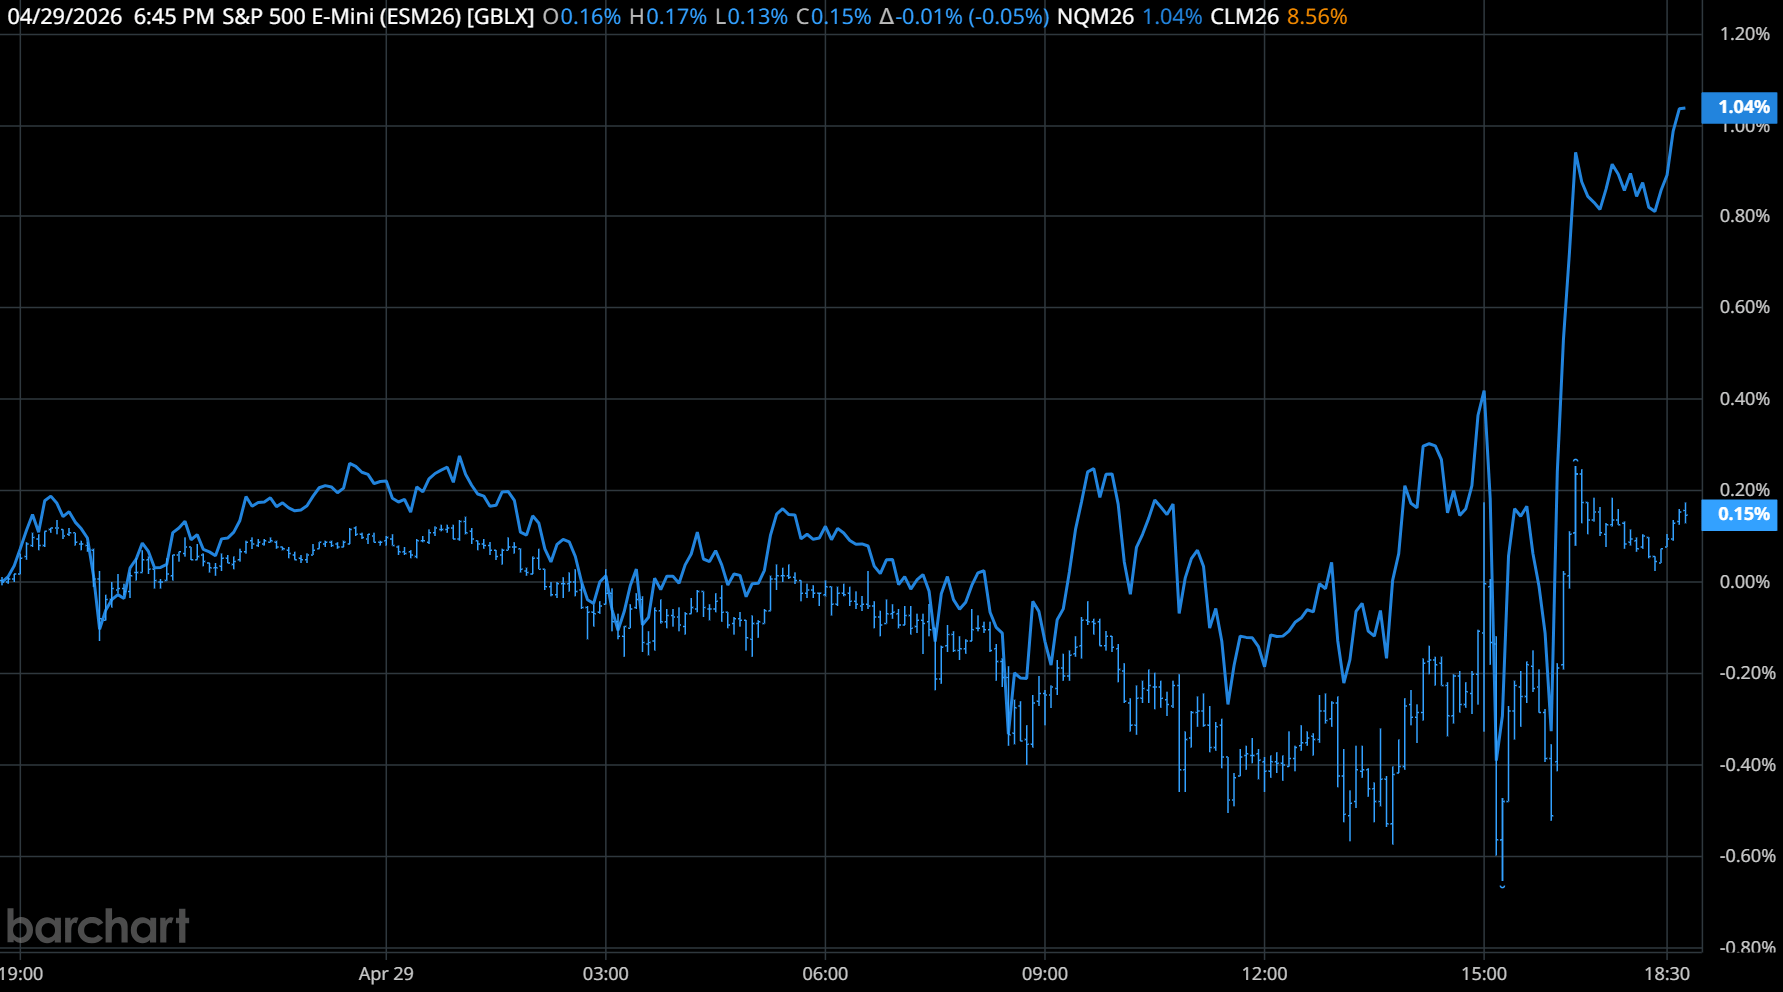
1-Day ES/NQ Chart
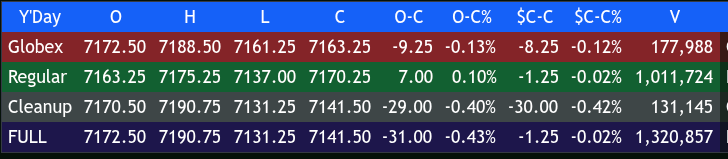
Sometimes the weeks seem to drag on, and this week is one of them. The ES made a high at 7288.50 and a low at 7161.25 on Globex, with a total of 182k contracts traded, and opened Wednesday’s regular session at 7163.25, down 8.25 points or -0.12%.
After the open, the ES traded 7265.00 and then sold off 115.75 points down to 7149.25. It stutter-stepped up to 7175.25 at 10:35, then sold off 30.00 points down to 7145.25 at 11:15. It rallied up to 7164.50, then sold off down to a 7145.25 double bottom at 11:55.
The ES rallied 15.00 points up to 7160.25 at 12:20, then sold off down to a new low at 7142.00 at 12:30. It rallied up to 7153.75 at 12:50, then did a sideways-to-up grind up to 7160.75 at 1:50. It then dumped 23.25 points down to a new low at 7137.50 after the Fed meeting headlines hit the tape.
The ES then rallied 15.00 points up to 7152.50, sold off down to 7140.50 at 2:30 when Powell’s press conference started, then rallied up to 7155.25 at 2:35. It sold off 18.25 points down to another new low at 7137.00 at 2:45, then rallied 31.25 points up to 7168.25 at 3:15.
The ES sold off 14.25 points down to 7154.00 at 3:30 and then rallied 10 points up to 7164.00 at 3:40. It traded 7160.75 as the 3:50 cash imbalance showed $845 million to sell, traded 7157.50, and started going bid. It traded 7170.75 at 3:55 and traded 7170.25 on the 4:00 cash close.
After the 4:00 cash close, the ES and NQ went nuts as the earnings hit the tape. Honestly, I didn’t know what earnings did what, so I posted this in the chat:
IMPRO:Dboy:[4:04:37 PM]:what did what?
IMPRO:PTGDavid:[4:04:46 PM]:Mr Softee ripper
IMPRO:ILT2000:[4:04:51 PM]:they all suck – not sustainable. we should sell off with CL at 108
IMPRO:Dboy:[4:05:05 PM]:agree, totally fixed
IMPRO:tbohn007:[4:05:08 PM]:MSFT and GOOG up on their prints
IMPRO:Dboy:[4:05:21 PM]:f everyone
IMPRO:ILT2000:[4:05:26 PM]:they all coming back down
IMPRO:PTGDavid:[4:05:28 PM]:META flunk a dunk
IMPRO:Dboy:[4:05:33 PM]:long/ shorts
IMPRO:Dboy:[4:05:39 PM]:all get F-ed
IMPRO:Dboy:[4:06:03 PM]:I don’t even know what did what
IMPRO:Dboy:[4:06:19 PM]:trying to write the OP
IMPRO:ILT2000:[4:07:06 PM]:META down, MSFT – unch, GOOG up, AMZN up a little after flying down to 245
IMPRO:Dboy:[4:07:33 PM]:I’ll use that
In short, the NQ rallied 175 points from 27,240 up to 27,415, sold off 320 points down to 27,095, rallied 201 points up to 27,296, sold back off down to 27,148, and settled at 27,325.25, up 156.50 points or 0.58%. The NQ traded up to 27,487.50 after the Globex open.
The ES sold off down to 7154.75, rallied 36.00 points up to 7190.75, sold off 59.50 points down to a new low at 7131.25, rallied 35.50 points up to 7166.75, sold off 26.00 points down to 7140.75, and then settled at 7168.00, down a measly 3 points or -0.03%. It just traded up to 7196.75 after Globex opened.
In the end, it was a ramshackle kind of day. In terms of the overall tone, the NQ acted great until the earnings fiasco, while the ES was ‘slippery’ all day. In terms of the ES’s overall trade, it’s hard to believe that with all the big swings, volume was low at 1.32 million contracts traded.
I am sure some people made money trading, but I didn’t. I have seen a lot of ‘stupid’ moves in my career, but yesterday was one for the books. The volume over the last 4 sessions has been low, so it makes it easy for the BOTs to move the index markets from sell programs to buy programs back to sell programs, and while I have seen a lot of that, yesterday was an extreme.
Between the big jump in crude oil (up 7%), Trump’s threatening Iran headlines, and the barrage of earnings after the close, the ES and NQ traded thousands of points in both directions.
I grabbed this from Twitter:
TRADERS NOW SEE RATE HIKE AS MORE LIKELY THAN RATE CUT THIS YEAR
Wall Street traders now see a slightly higher chance of a Federal Reserve rate hike than a cut this year, following hawkish signals from policymakers. Interest-rate futures show an 11% chance of a hike, up from 5% earlier Wednesday and zero on Tuesday, while the odds of a rate cut sit around 2%. Although the Fed kept language suggesting cuts are more likely, three Fed presidents opposed it, and Chair Jerome Powell signaled it could be dropped soon, as inflation remains persistent.
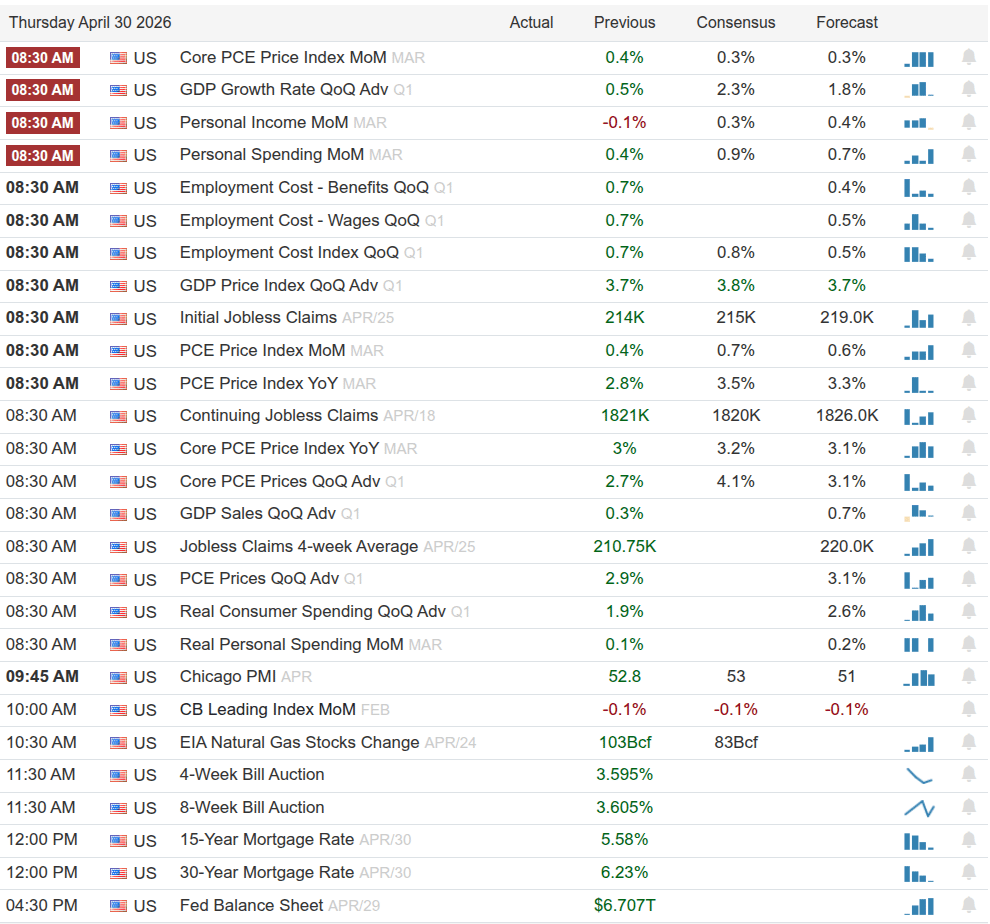
Economic Calendar
Thursday: 8:30 Initial Jobless Claims, Employment Cost Index, GDP, Personal Income, PCE; 9:45 Chicago Business Barometer (PMI); 1:00 Leading Indicators.
Friday: PMI, ISM.

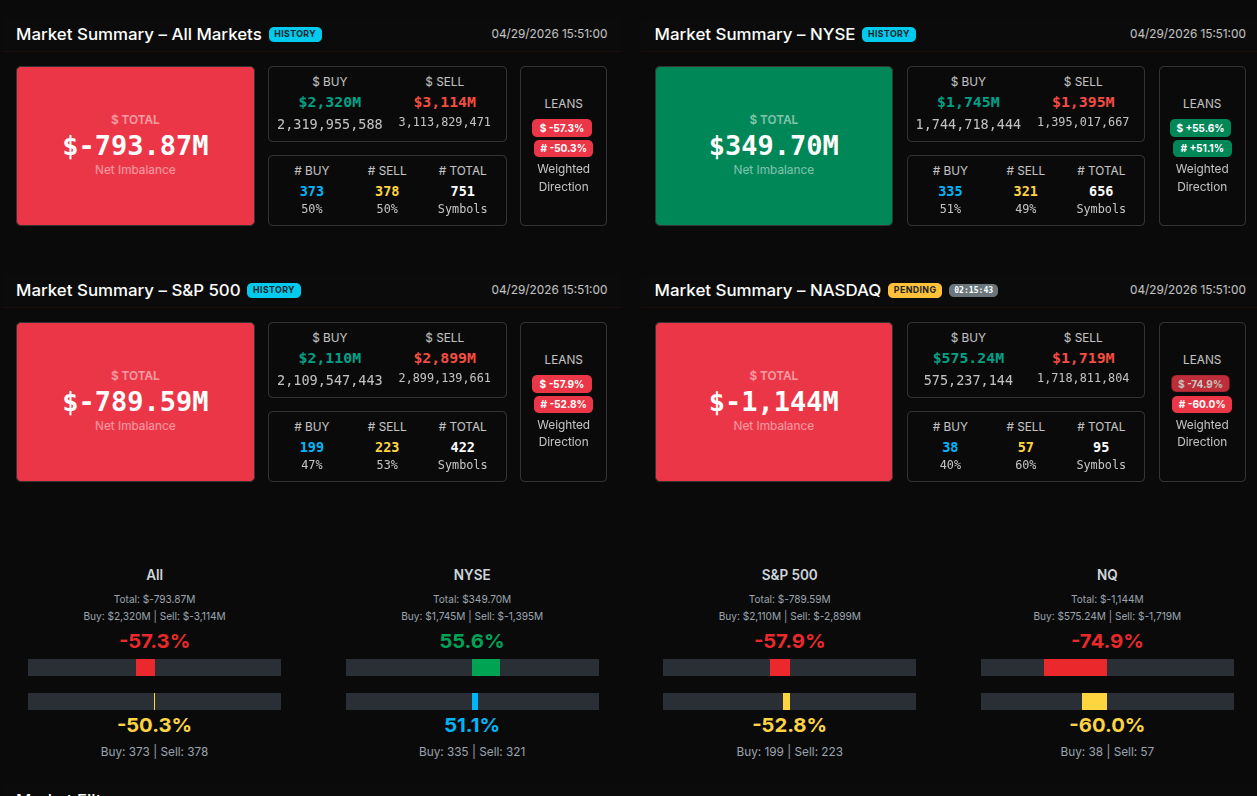
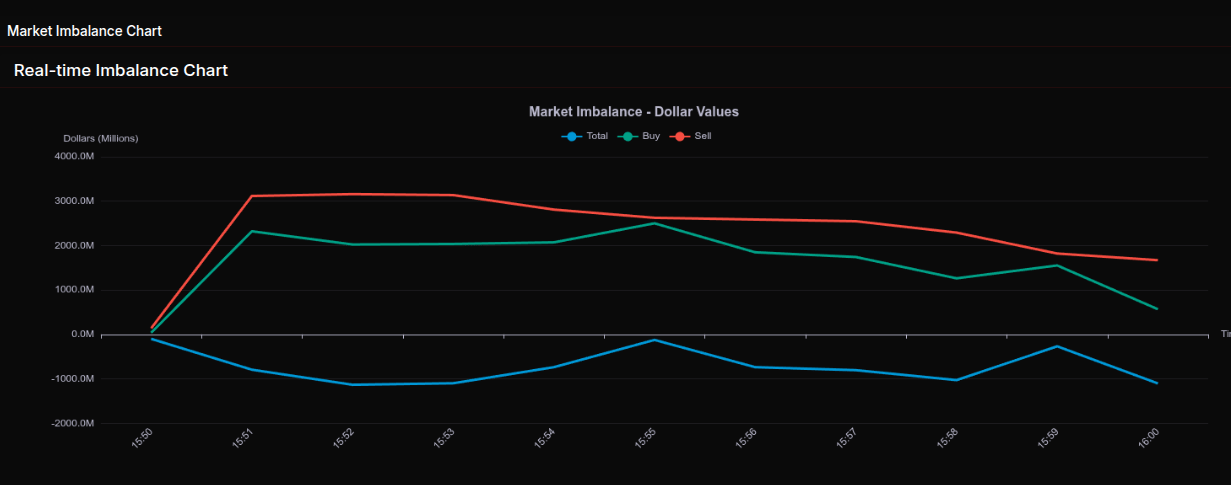
MiM
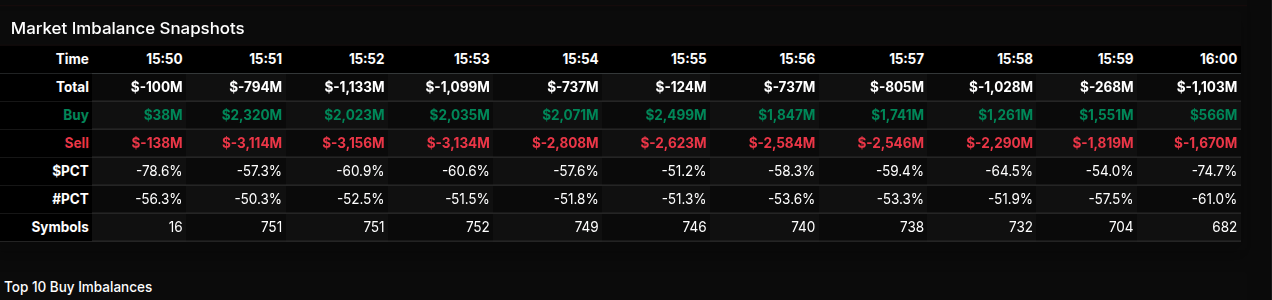
The MOC session opened with a clear sell-side tone, as early imbalance snapshots showed persistent negative pressure at -800M. At 15:50, the market was already leaning -78.6%, signaling aggressive sell programs entering the close. This selling intensified into 15:52–15:53, where total imbalances pushed beyond -$1.1B with sell pressure dominating over -60%, indicating broad institutional distribution rather than isolated rotation.
As the session progressed, there was a brief attempt at stabilization around 15:55, where total imbalance narrowed to roughly -$124M and the percentage leaned closer to -51%. This suggested some rotational activity, but the bounce lacked conviction. Sellers quickly regained control into the final minutes, with the close printing near -$1.1B and a -74.7% lean, firmly classifying the session as a wholesale sell program into the bell.
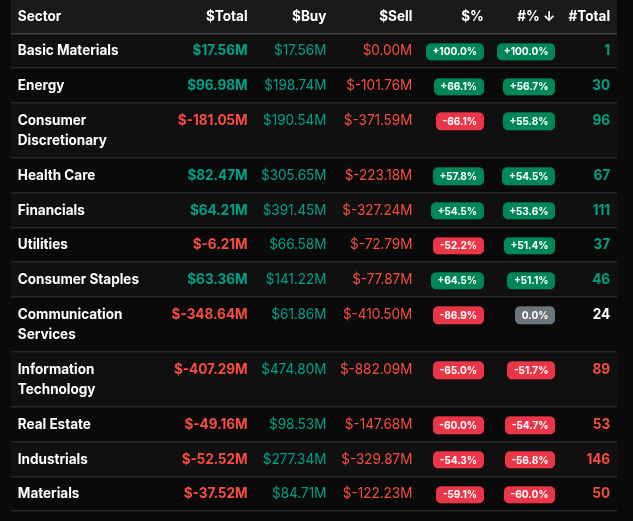
Sector flows confirmed this risk-off posture. Communication Services posted a notable -86.9% lean, while Information Technology saw heavy distribution at -65.0%. Industrials (-54.3%), Real Estate (-60.0%), and Materials (-59.1%) all showed strong sell-side pressure, reinforcing broad-based liquidation. On the other side, Energy stood out as an area of relative strength as it approached the +66% threshold, indicating near wholesale buying.
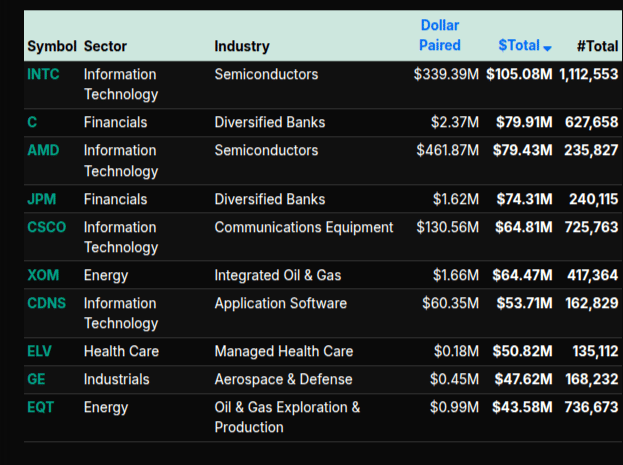
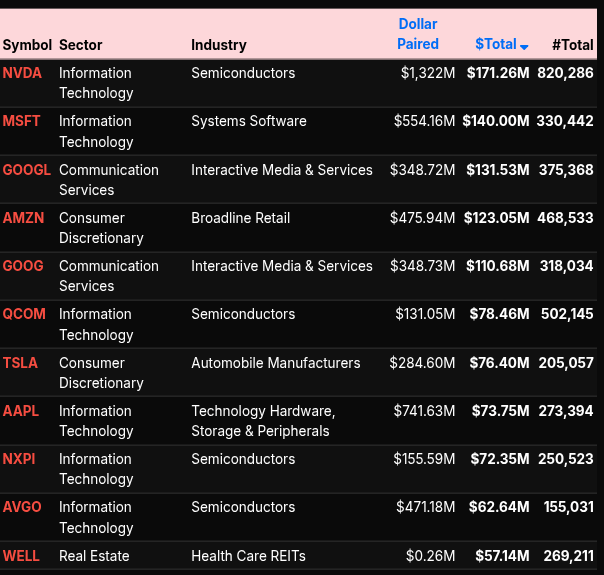
On the symbol level, mega-cap names dominated activity. NVDA, MSFT, GOOGL, and AMZN all appeared on the most active lists, reflecting large institutional repositioning. Semiconductor names like NVDA, AMD, and QCOM were heavily traded, aligning with the weakness in the Technology sector. Meanwhile, financial names such as JPM and C showed stronger buy imbalances, supporting the positive lean in Financials (+54.5%).
Overall, the session was characterized by broad index-driven selling, particularly in Nasdaq-heavy names, which finished with a -74.9% lean. This was not a rotational close but a decisive risk-off move, with only select sectors like Energy providing meaningful offset.

Replay:


Fair Values for April 30, 2026
-
S&P: 29.24
-
NQ: 131.14
-
Dow: 135.21
Daily Breadth Data 📊
For Wednesday, April 29, 2026
• NYSE Breadth: 37% Upside Volume
• Nasdaq Breadth: 44% Upside Volume
• Total Breadth: 42% Upside Volume
• NYSE Advance/Decline: 29% Advance
• Nasdaq Advance/Decline: 30% Advance
• Total Advance/Decline: 30% Advance
• NYSE New Highs/New Lows: 78 / 40
• Nasdaq New Highs/New Lows: 132 / 153
• NYSE TRIN: 0.69
• Nasdaq TRIN: 0.54
Weekly Breadth Data 📈
For the Week Ending Friday, April 24, 2026
• NYSE Breadth: 45% Upside Volume
• Nasdaq Breadth: 52% Upside Volume
• Total Breadth: 49% Upside Volume
• NYSE Advance/Decline: 41% Advance
• Nasdaq Advance/Decline: 42% Advance
• Total Advance/Decline: 42% Advance
• NYSE New Highs/New Lows: 307 / 56
• Nasdaq New Highs/New Lows: 677 / 266
• NYSE TRIN: 0.86
• Nasdaq TRIN: 0.68

ESM2026
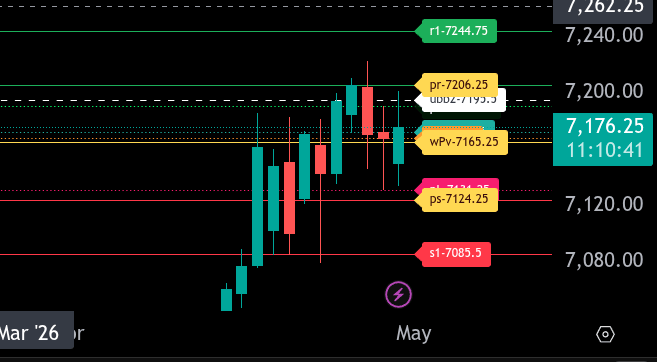
The bull/bear line for the ES is at 7165.25. This is the key level that defines directional bias for today. Holding above this level keeps buyers in control, while losing it shifts momentum back to the downside.
ES is currently trading around 7177.00, slightly above the bull/bear line, indicating early strength during the Globex session. As long as price holds above 7165.25, dips are likely to be supported, with upside targets at 7195.50 and 7206.25, which is the upper range target for today. A break and hold above 7206.25 opens the door for an extension toward 7244.75.
On the downside, initial support comes in at 7172.50, followed by 7168.00 just above the bull/bear line. A loss of 7165.25 would signal weakness, targeting 7131.25 and then 7124.25, which is the lower range target. If selling accelerates below 7124.25, the next key downside level to watch is 7085.50.
Overall, the market is attempting to stabilize above the bull/bear line after a strong overnight push. Holding above 7165.25 keeps the tone constructive, while failure to hold this level would shift focus back to the lower range targets.
NQM2026
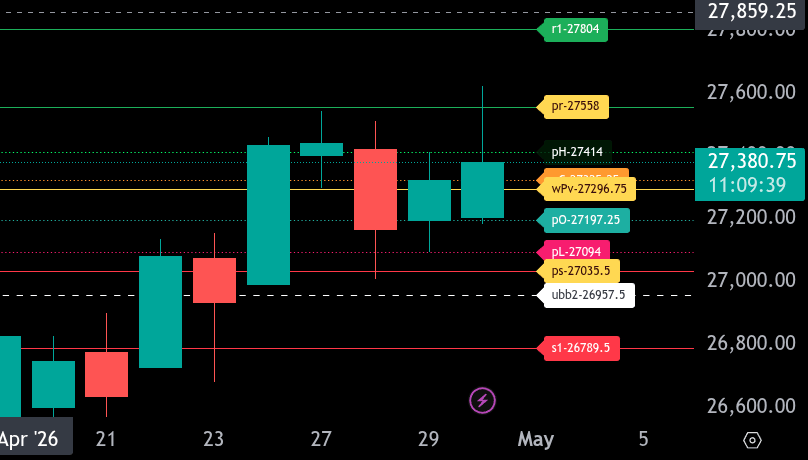
The bull/bear line for the NQ is at 27296.75. This remains the key pivot for today’s session. Holding above this level keeps the market in a bullish posture, while losing it would shift momentum back to the downside.
NQ is currently trading around 27383.25, holding above the bull/bear line and showing early strength in the Globex session. As long as price remains above 27296.75, buyers have control and dips into this area may present support opportunities.
On the upside, resistance comes in at 27414.00, followed by 27558.00, which is the upper range target for today. A break and hold above 27558.00 opens the door for an extension toward 27804.00. Acceptance above 27558.00 would signal continuation higher.
On the downside, initial support sits at 27325.25, followed by 27197.25. If price loses the bull/bear line at 27296.75, expect a move toward 27094.00 and then 27035.50, which is the lower range target. A breakdown below 27035.50 could accelerate selling toward 26957.50 and potentially 26789.50.
Overall, the market is showing bullish positioning above 27296.75, but still within a broader range. Continued acceptance above the bull/bear line favors upside continuation, while a failure back below it shifts focus to lower support targets.

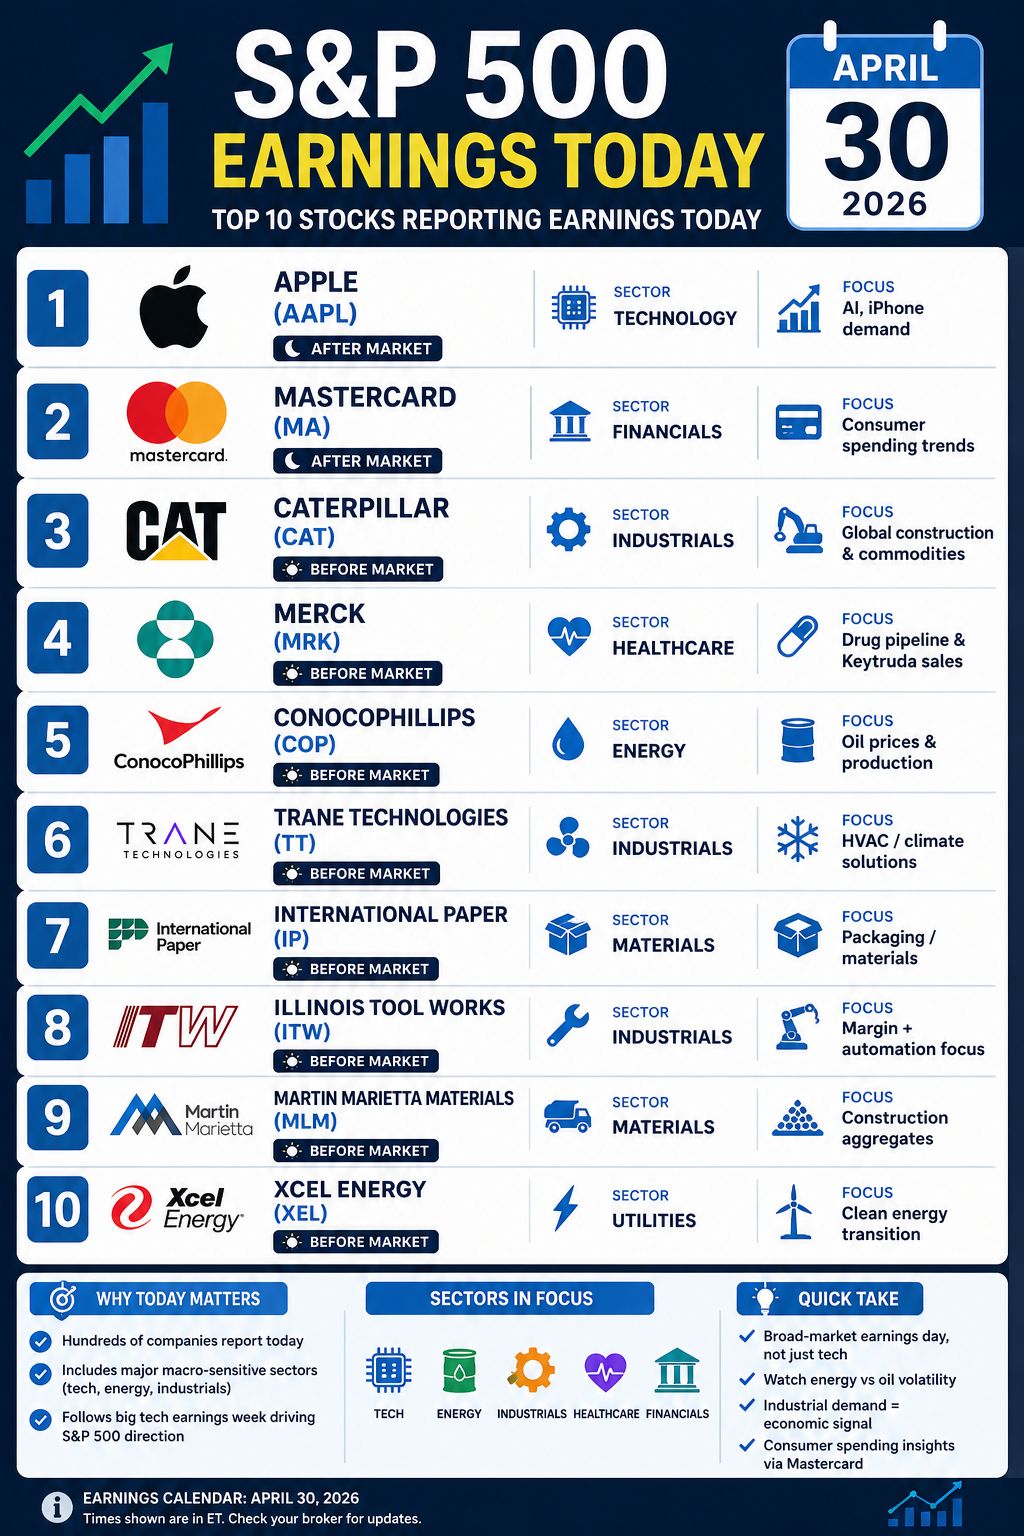
Today’s Economic Calendar
Earnings:
`

PTG Room Summary – For Wednesday, April 29, 2026
Wednesday was a classic Fed Day environment, and the tone reflected that early—expectations were for a slower, more methodical session (“fed day = dead day”). The team came in prepared, focused on discipline and letting the market come to them rather than forcing trades.
Morning Session – Structured and Technical
The day started with solid engagement and clean execution around the opening structure:
-
A key discussion centered on the first pullback short early in the session (around 9:03).
-
Traders identified a discount area with A4 alignment, reinforcing a high-probability setup.
-
The concept of compression → expansion was highlighted well—this became an important theme for the morning.
Midday – Slower, Patient Environment
As expected on a Fed day, the market slowed:
-
Limited follow-through and fewer clean trend opportunities.
-
Traders stayed patient rather than overtrading.
-
Light humor and realism about conditions (TTB/TRB comments) showed awareness of the environment.
News & Catalysts
Midday geopolitical headlines (Iran-related) added some background noise but didn’t create sustained trade opportunities.
At 2:50 PM, the Fed announcement hit:
-
Rates unchanged (no surprise)
-
Market reaction was muted—again validating the expectation of a slower session.
Late Day / Close – Order Flow & Earnings Focus
Into the close:
-
MOC Sell Imbalance (~$845M) gave insight into institutional positioning.
-
Strong attention to order flow (“sweeping the book”), especially around GOOGL.
After-hours:
-
Big tech earnings (GOOGL, META, AMZN, MSFT) created sharp moves (“rippers”).
-
Notably, META reversed hard after initial strength (“flunk a dunk”)—a reminder of volatility around earnings.
Key Takeaways from the Day
-
First pullback setups remain high-quality when aligned with structure (A4, discount/premium zones).
-
Compression leads to expansion—wait for it instead of anticipating.
-
Fed days require patience—lower expectations, avoid forcing trades.
-
Order flow matters, especially late in the day.
-
Earnings volatility can be extreme—great opportunity if managed, dangerous if not.
DTG Room Preview – Thursday, April 30, 2026
Markets are being driven by macro uncertainty and big tech earnings. Focus remains on escalating US/Iran tensions pushing oil to multi-year highs (Brent ~$112, WTI ~$108), alongside heavy attention on Mag 7 earnings, AI capex, Fed independence concerns, and today’s key inflation data (Core PCE).
Macro & Headlines
-
Geopolitics front and center: oil surging on renewed US/Iran conflict risks.
-
Powell signaled he will stay at the Fed despite political pressure, raising concerns about central bank independence.
-
Key data at 8:30am ET (Core PCE, GDP, Employment Costs) is a major near-term catalyst.
-
Volatility remains elevated; ES range still wide (~69 pts avg).
Mag 7 Earnings + AI Spend
-
Mixed reactions:
-
META -7% (weak growth/capex concerns)
-
MSFT -1% (beat but muted reaction)
-
GOOG +7% (strong cloud)
-
AMZN +2% (solid results)
-
-
AI capex expectations continue to rise sharply:
-
2026 spend now ~$725B (vs ~$670B prior)
-
Major increases across META, MSFT, AMZN, GOOG
-
-
Chip supply constraints persist; Nvidia server pricing surging amid China demand.
Positioning & Flow
-
“Whale” bias: short into this morning’s data on heavy overnight volume.
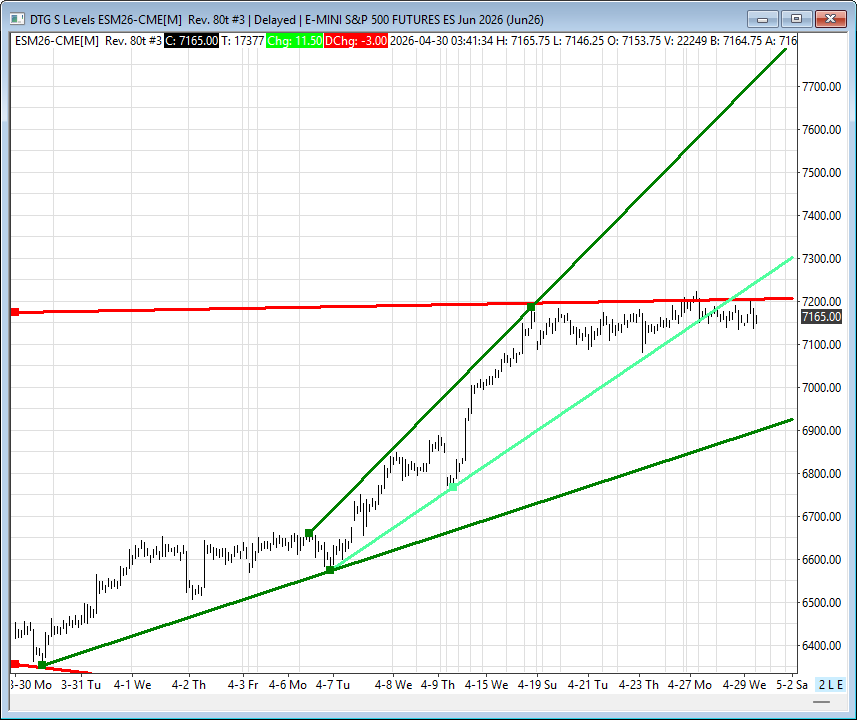
Technical Levels (ES)
-
Resistance: 7204/07 (key trendline), then 7805/10
-
Support: 6915/20, then 6145/40
-
Trend note: Short-term uptrend structure weakened after sideways grind; opens downside risk despite bullish MA structure (50 > 200 DMA).
Bottom Line
Markets are balancing strong AI-driven growth narratives against rising geopolitical risk, inflation uncertainty, and weakening technical momentum. Today’s data could set the next directional move.
Affiliate Disclosure: This newsletter may contain affiliate links, which means we may earn a commission if you click through and make a purchase. This comes at no additional cost to you and helps us continue providing valuable content. We only recommend products or services we genuinely believe in. Thank you for your support!
Disclaimer: Charts and analysis are for discussion and education purposes only. I am not a financial advisor, do not give financial advice and am not recommending the buying or selling of any security.
Remember: Not all setups will trigger. Not all setups will be profitable. Not all setups should be taken. These are simply the setups that I have put together for years on my own and what I watch as part of my own “game plan” coming into each day. Good luck!
This post goes out as an email to our subscribers every day and is posted for free here around 2 PM ET. To get your real-time copy, sign up for the free or premium version here: Opening Print Subscribe.
Comments are closed