End-of-Quarter Rebalance in Focus Amid Short Week
Oil stays firm.
Follow @MrTopStep on Twitter and please share if you find our work valuable!
Every week, MrTopStep invites traders to an “Own the Close” contest where the closest guesstimate where the SPX will settle on Friday’s 4:00 cash close.
The winners get a free week’s access to the MrTopStep Chat and trading tools. Enter your guess now!
Our View
I think this is a great story, as OPEC and Putin slash oil production and make oil production cuts. The USA is now producing more oil and gas than any nation ever has — the numbers are record breaking oil production. It is sweet revenge for Putin pushing the Saudis to cut oil production.
The other added positive is India, who is Russia’s largest oil buyer, ramped up its purchases of US crude oil amid tighter enforcement of sanctions on Russian supplies. More than 250,000 barrels per day of US crude are set to arrive in India next month, the highest in more than a year.
When you add it all up, higher oil prices are not going down anytime soon — nor will it help the Fed lower rates.
Our Lean
I should have been on top of Goldman saying there is $32 billion (End-Of-Quarter) at the end of the Q1 rebalance. Whenever you hear big numbers like that, the big trading desks start unloading and with this week being only 4 days — and unload they did.
I have no excuses for this. I get every bank report under the sun and I didn’t hear about it until I was getting run over late yesterday. I knew the MCH rebalances are always large and I didn’t include it in any of my posts. That said, it was another extremely low-volume day.
Yesterday’s late drop caught me off-guard. Was the drop the start of a larger drop into the end of the week? I don’t think so, but it was obvious that the big funds were buying bonds and selling stocks.
What’s clear is two things: The Fed is determined to lower rates at the June meeting but the surging share prices of the Magnificent 7 have been part of a giant rotation out of the hot names. Yesterday alone, Nvidia fell 2.5%, while Apple, Amazon, Meta and AMD all fell as well.
I still think higher into the end of the week, but the end of the quarter rotation out of tech is clearly dominating the tape. How long will that last? Right into Thursday’s close.
Our Lean: If the ES opens lower, I want to buy the open and sell the early rallies. I got thrown off yesterday and what I don’t want to do is make a bunch of directionless trades. The fact of the matter is… no one is trading. If the ES opens higher I want to sell the early rallies and buy the pullbacks.
MrTopStep Levels:

MiM and Daily Recap
ES recap
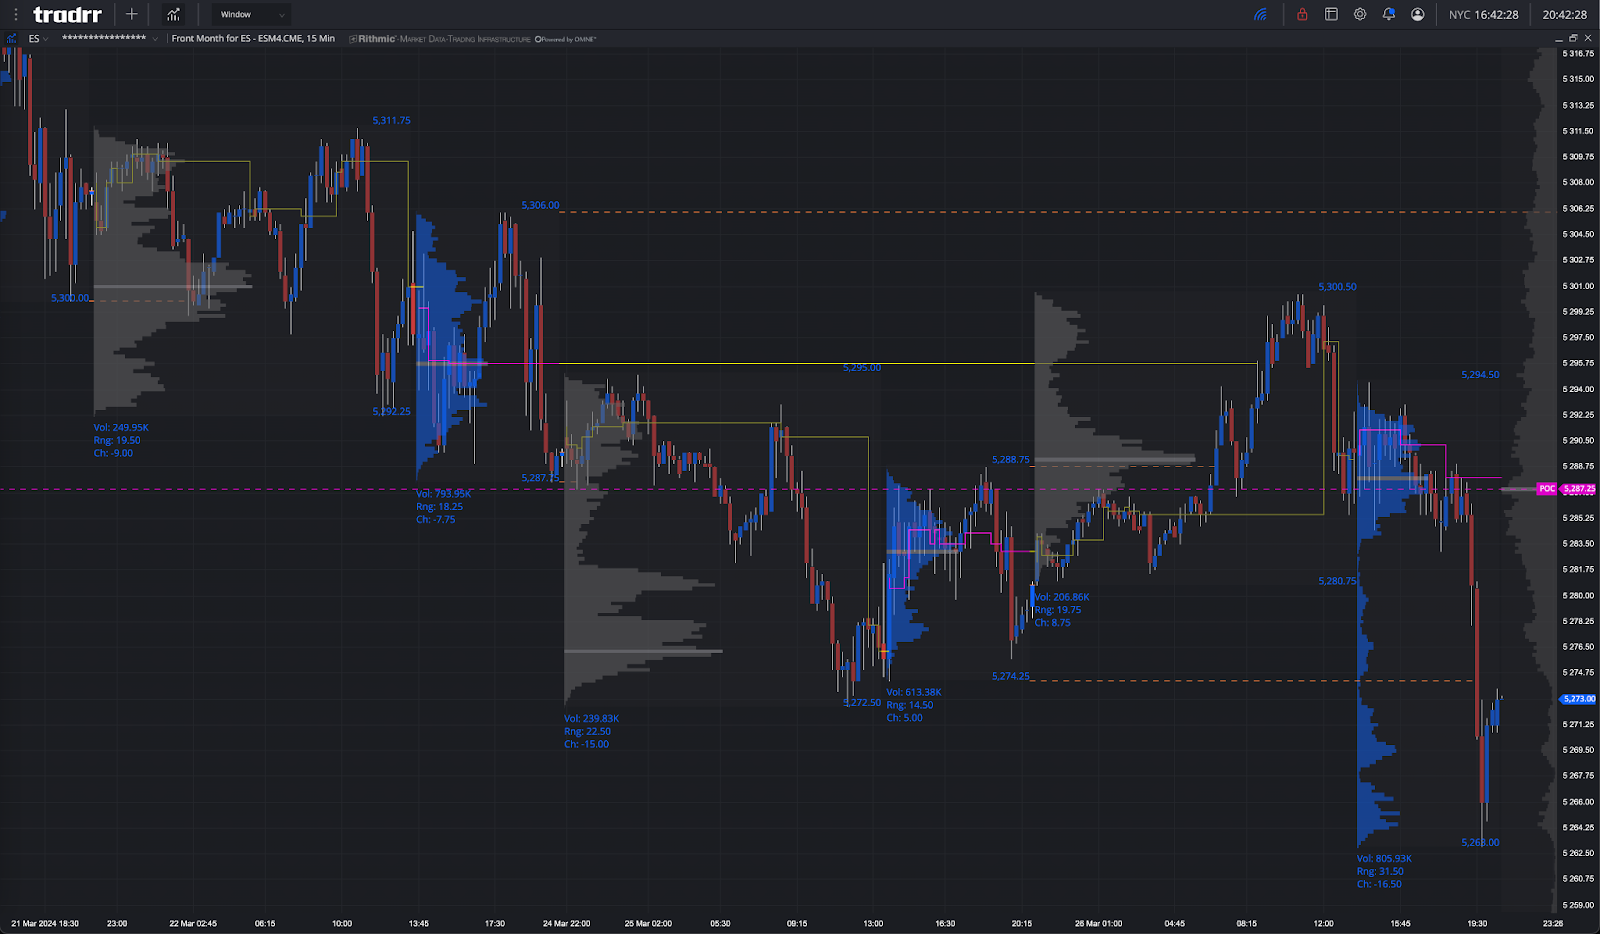
Monday’s range was the 3rd smallest in March since 2008 and the 14-pt range is also the 3rd smallest range of the year. After selling off a little, the ES rallied all the way up to 5300.50 on Globex and opened Tuesday’s regular session at 5290.00. After the open, the ES did exactly what it did Monday: it fell into a (mostly) 6-point back-and-fill just below and above the VWAP from 5285.50 to 5293.00 with a 5294.50 high and a 5284.50 low at 10:36 and then fall right back into the 4 to 6-point back-and-fill — which you can clearly see on the ES chart.
The ES broke out of its back-and-fill pattern and traded down to a new low at 5283.00 and the ES rallied up back up to the VWAP at 5289.00 at 2:20, then sold off down to 5273.75 at 3:35 and traded 5260.75 as the 3:50 cash imbalance showed $4.9 billion to sell, traded down to 5263.00 and traded 5266.50 on the 4:00 cash close.
In the end, I got bushwhacked by part of Goldman’s $32 billion EOQ rebalance. In terms of the ES’s overall tone, it was fine until 2:30 when the sell programs showed up. In terms of the ES’s overall trade, volume was slightly better than Monday: 147k traded on Globex and 864k traded on the day session for a total of 1.011 million contracts traded.
If you want to know why the volume has dropped so much, it’s because everyone is on vacation in Florida. If you want to know when the volume will pick up again, that will be after Easter when everyone leaves Florida. And note the almost $10 billion in MIM sales so far this week, as part of the rebalance.

Guest Post
PTG/Taylor 3 Day Cycle
Author: David D Dube’ (a.k.a. PTGDavid)
Website: https://polaristradinggroup.com/
Prior Session was Cycle Day 1: Price rallied first to negate yesterday’s failed 3-day rally (RTH Session) and as expected declined to the projected CD1 Average Decline Zone as outlined in prior DTS Briefing 3.26.24. Range was 37 handles on 1.015M contracts exchanged.
NOTE: Primary Objective for Cycle Day 1 is to establish a LOW from which to stage the next rally. This session was a “textbook” Cycle Day 1
…Transition from Cycle Day 1 to Cycle Day 2
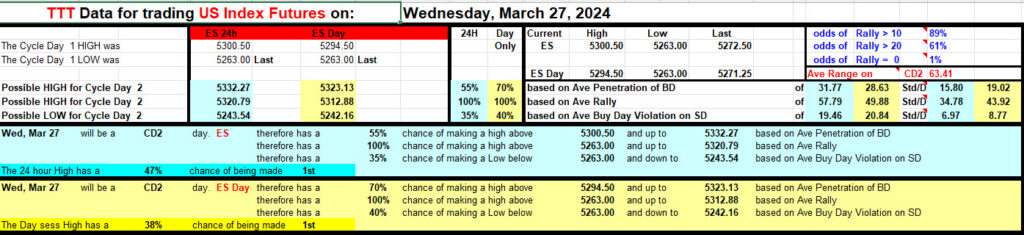
This leads us into Cycle Day 2: Price established a new cycle low at 5263. Next objective is for the price to rally, so we will be looking for strength above 5275. Clearing and converting this level potentially returns the price back to the upper balance between 5290 – 5300.
As always, our tactical trade plan remains unchanged…Stay in alignment with dominant intra-day forces. As such, scenarios to consider for today’s trading.
Bull Scenario: Price sustains a bid above 5275, initially targets 5290 – 5300 zone.
Bear Scenario: Price sustains an offer below 5275, initially targets 5265 – 5260 zone.
PVA High Edge = 5298 PVA Low Edge = 5281 Prior POC = 5290
*****The 3 Day Cycle has a 90% probability of fulfilling Positive Cycle Statistics covering 12 years of recorded tracking history. CLICK ON IMAGE TO EXPAND FULL CYCLE DAY 2 SPREADSHEET
Thanks for reading,
PTGDavid
Economic Calendar
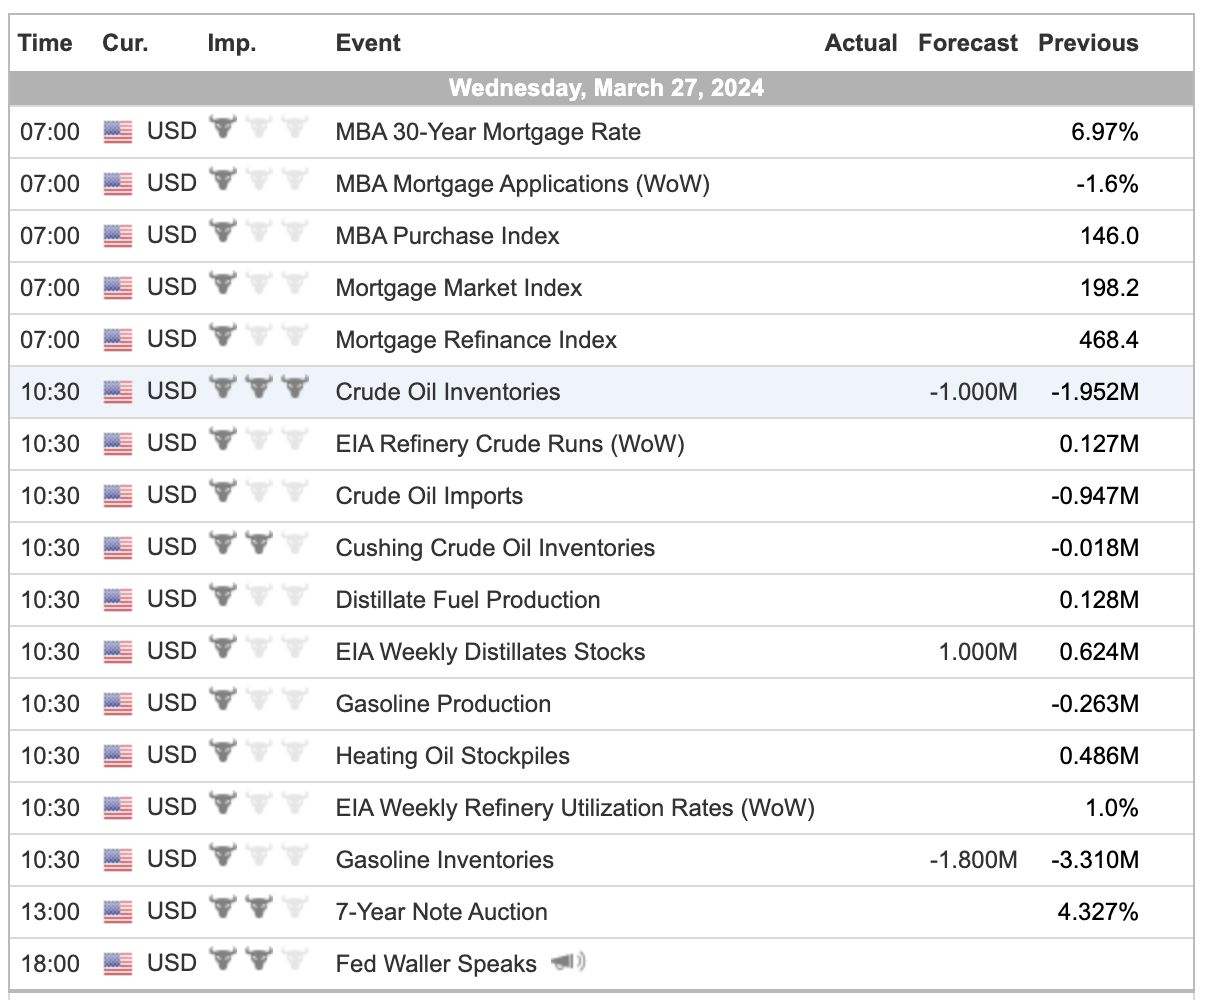
For a more complete Economic Calendar see: https://mrtopstep.com/economic-calendar/
Comments are closed