This post goes out as an email to our subscribers every day and is posted for free here around 2 PM ET. To get your real-time copy, sign up for the free or premium version here: Opening Print Subscribe.
ES 5600+ And The End of April Walk Away Trade
Follow @MrTopStep on Twitter and please share if you find our work valuable!
Our View
(CNW) is not a stock—it’s the state of which the markets and the world are in, Crazy, Nusts and Wild. Here’s just a small example of how:
After selling off on Globex, the ES rallied up to 5573.75, sold off to the 5540 area, and then rallied up to 5558, then out comes this:
8:48 AM – Bessent: Will see tariff revenue impact in upcoming tax bill
Sold off down to 5522.
9:11 AM – Amazon plan to show tariff costs a ‘hostile’ act, Leavitt says
A few seconds later, WH Press Secretary Leavitt announced: Trump will sign an Executive Order on auto tariffs later today.
This doesn’t even include all the earnings and economic reports that had already hit the tape. The ES then rallied up to 5570.50 and dropped back down to the 5535 area after the JOLTS report:
10:00:23 AM – JOLTS Job Openings (Mar): 7.192M vs. 7.490M expected
This signaled weaker labor demand, slower economic growth, increased competition for jobs (with a job openings-to-unemployed ratio at a four-year low of 1.0), and potential upward pressure on unemployment.
It’s very hard for me to gauge what the readers of the OP are thinking. Most of the time, I think you are just like me, concerned and bewildered. After years of being the top player in the world, our economy is riddled with debt, and investment safe havens like the treasury markets may not be all that safe.
The ES just sold off down to the 5536 area and rallied up to the 5570s again. It’s been the same pattern for the last five days—rally, drop, and pop. I think it’s fair to say that none of us know what the S&P is going to do next, but based on the overall price action and it being T+1, I really do not see anything in the way of going higher.
According to Jeff Hirsch from the Stock Trader’s Almanac, the technicals are flashing green. Stocks should be higher a year from now, but we are not out of the woods yet. The V-Bottom/Zweig Breadth Thrust Scenario has a few hurdles to clear.
The extreme volatility spike pushing the VIX above 50 and then retreating below 30 is also encouraging. These abrupt changes in volatility and market breadth have a solid history of calling market bottoms. While these technical developments are quite constructive, the nature of this decline and our other seasonal, post-election year, and chart readings are keeping us skeptical.
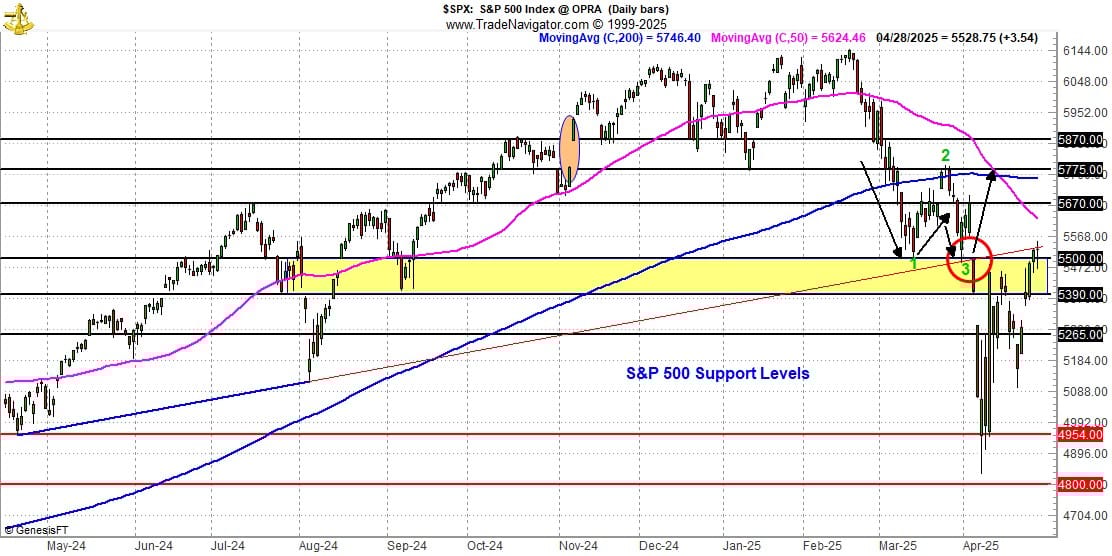
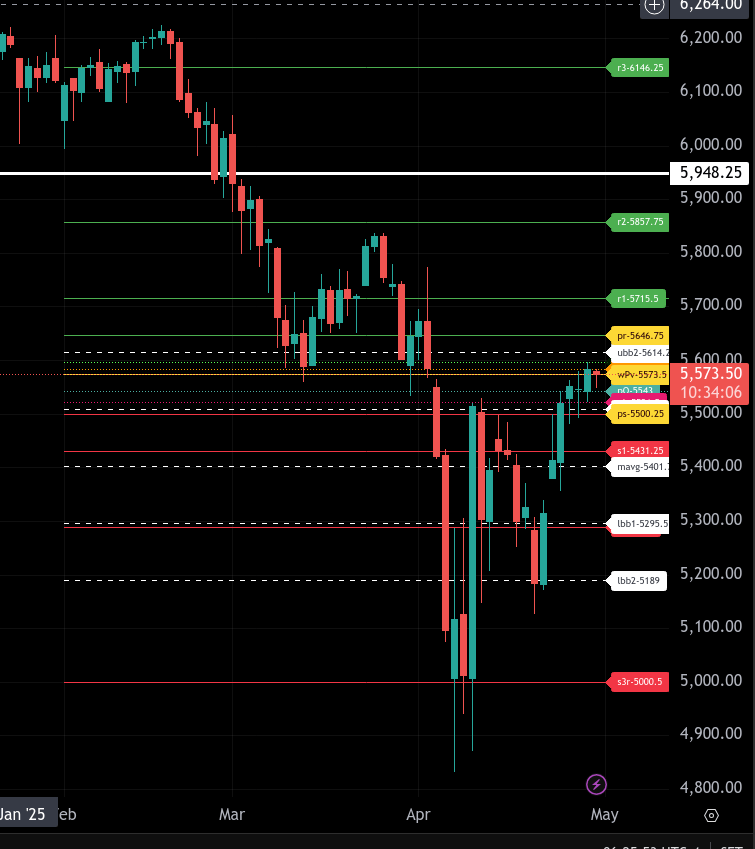
The S&P 500 is barely back above the 5500-resistance level. This is the bottom of that failed W-1-2-3 swing bottom at the beginning of April. It is also in line with the bottom of the gap from the April 2 tariff announcement to the open the next day on April 3. If we can clear this level, that would be constructive and suggest that this relief rally can continue.
But until we can take back the declining 50-day moving average, the 200-day moving average, and the election gap (orange circle), the market is likely to remain choppy through the summer.
And to further the upside bias, Goldman Sachs says…
Flow of funds check:
GS PB: Gross exposure still high (81st percentile 1-year; 94th for 3 years), while nets remain low (5th percentile for 1 year / 53rd for 3 years).
Buybacks:
We estimate 40% of SPX companies are now out of blackout (see 65% by end of week). The April to May corporate repurchase window is historically strong. This two-month period is the third best of the year with 20% of executions.
CTAs:
See ~3bn of SPX to buy in flat tape this week (expected demand in every scenario).
Month-end pension rebalance:
Small to buy, with this group modeled to BUY $4bn of US equities for month-end.
The ES remained bid right into the new highs at 5597.25—just 2.5 points off the recent high of 5599.75. In the end, it was a big day of drops and pops with a retest of the recent high. Hard to argue with that.
Our Lean
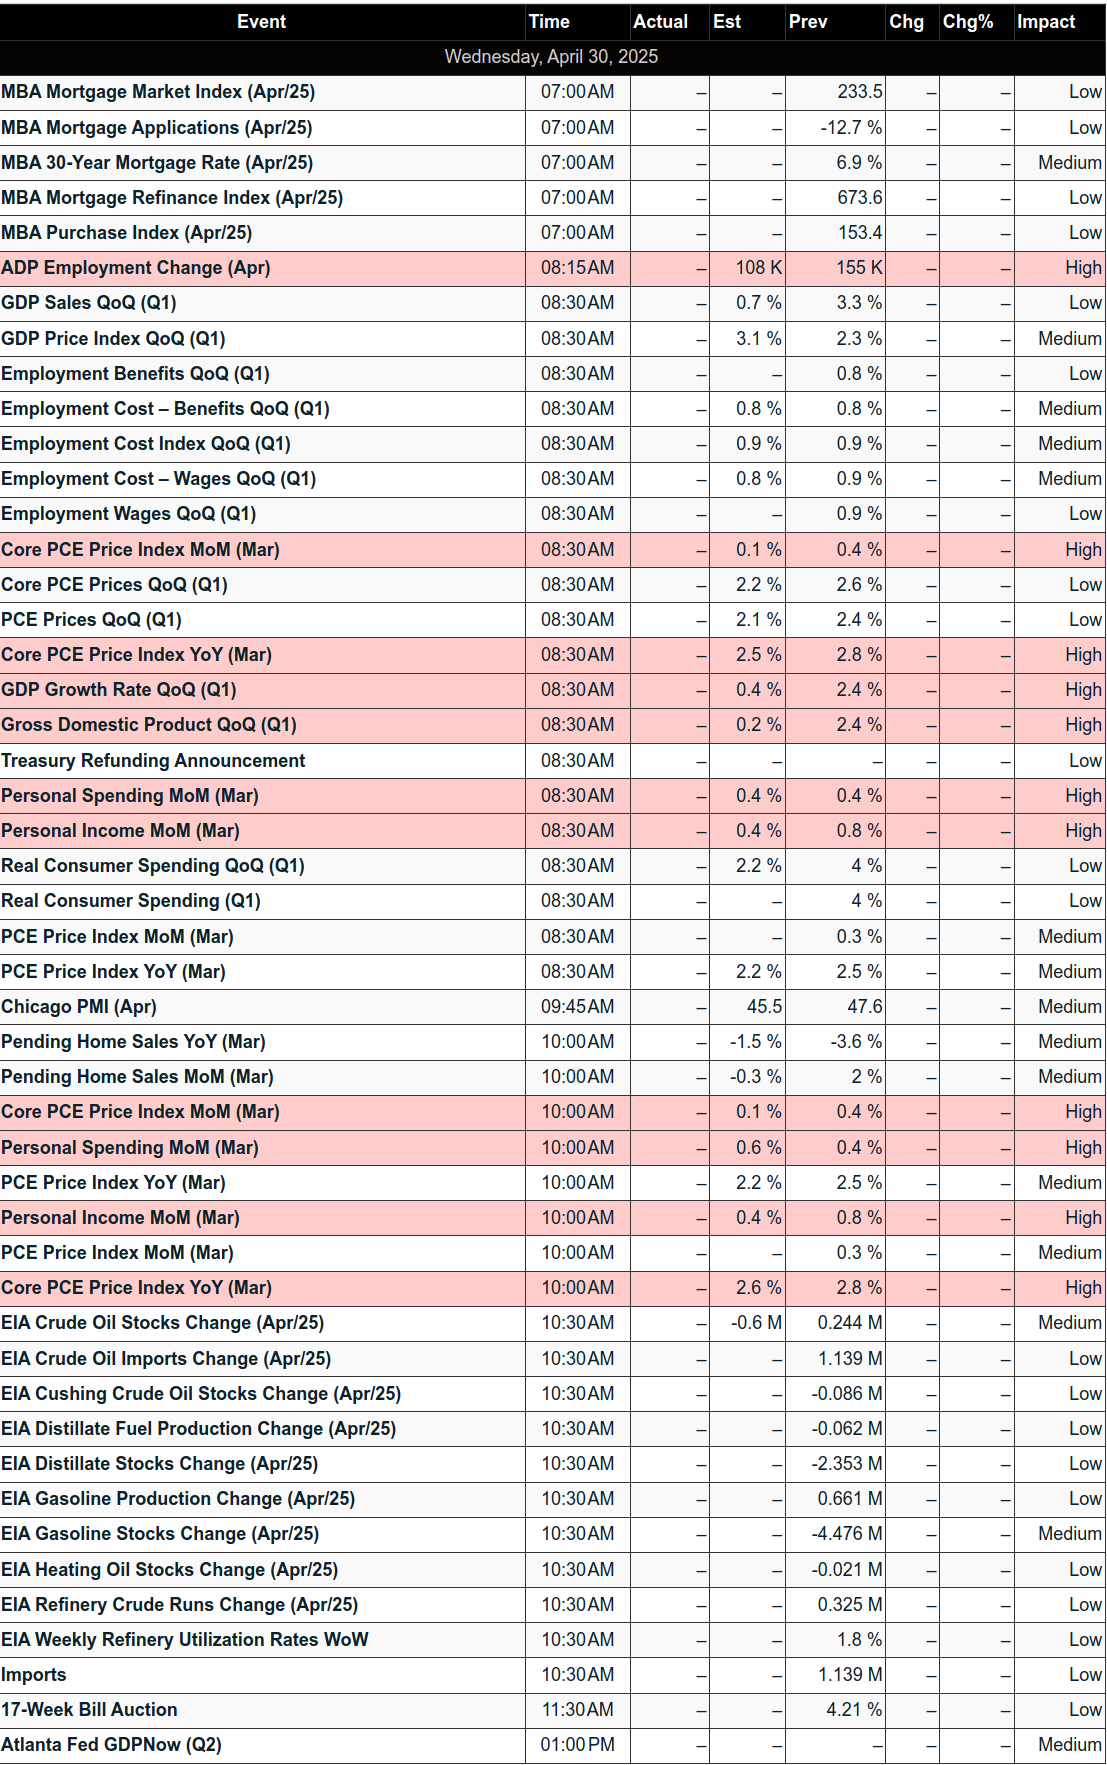
The fireworks start today: ADP, GDP, Employment Cost, Consumer Spending, Personal Income, PCE Index, Pending Home Sales, and earnings from heavyweights—Meta, Apple, and Microsoft report earnings after the bell. It’s also the last trading day of April, which is going to consist of a lot of rebalancing and some big daily swings.
According to HandelStats, the last trading day of April has seen the ES down 12 out of the last 20 occasions, with an average loss of 0.99% and an average gain of 0.34%. Additionally, the ES has now closed higher for the 6th day in a row and is up 450 points from its recent 5127.75 low to yesterday’s 5597.25 high.
I still think we are going up and want to continue to follow the recent price action of rally early, sell off, then make new highs. But I’m concerned about one of MrTopStep’s trading rules called the Walk Away trade. How it works is you’re supposed to start shorting the ES around 11:30 to 1:00. The idea is that by that time, the mutual funds have used up all their buying power, leaving the ES susceptible to a decline.
I want to be honest, the Walk Away trade used to work well, but I am not sure about it today. Also, the Stock Trader’s Almanac has the S&P up 18 of the last 27 occasions.
Our lean: I think there is a good chance of a trading range expansion and higher volumes today. In the past, I only paid attention to a handful of economic numbers, but they all seem to be market-moving now. If the ES gaps lower this morning, I’m a buyer, and a buyer of the pullbacks in the first half of the day. But I want to get a look at the price action. I still see the ES going above 5600 and then up into the 5800s.
HandelStats:
SPX Behavior on the Last Business Day of April: 2008–2024
As part of our ongoing exploration of end-of-month dynamics, this analysis examines how the S&P 500 (SPX) has historically performed on the final business day of April over the past 17 years.
Key Takeaways:
Over 17 observations, the SPX has closed up on only 5 occasions and down on 12 occasions.
This results in a down-day probability of 70.59%, compared to just 29.41% for up days, and 0% unchanged.
The total net change across all years on the last April trading day is -333.79 points, with an average change of -0.60%.
The largest single-day loss was in 2022, dropping -155.57 points (-3.63%).
The most recent two years (2023 and 2024) show a bounce followed by renewed weakness, highlighting the choppy and often bearish tone at month-end.
Day-of-Week Patterns:
The final trading day of April has most frequently landed on Fridays and Thursdays, reinforcing the market’s tendency to price in end-of-month activity ahead of the weekend.
Notably, Thursday-to-Friday transitions tend to be followed by Monday weakness, adding context for short-term traders managing post-month-end positions.
Implication for Traders:
The consistent bearish bias on the final April session presents a notable seasonal tendency. For tactical traders and fund managers, this could be an opportunity to lighten exposure or hedge ahead of April’s close — particularly in years when the market is already under pressure.
MiM and Daily Recap
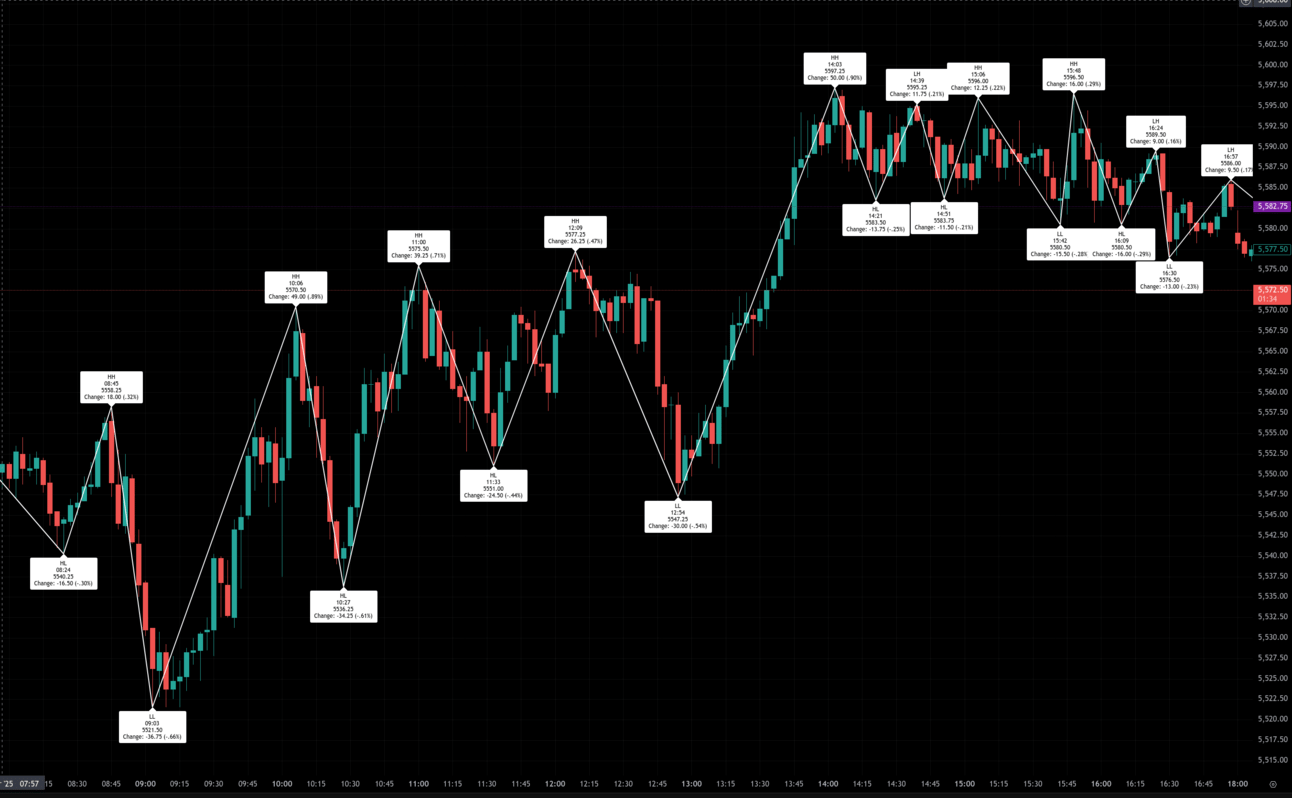
The S&P 500 futures (ES) opened Tuesday’s regular session at 5531.00 following an active overnight Globex range that reached as high as 5573.75 and as low as 5521.50. The early Globex action set a weak tone, bottoming at 5521.50 at 9:03 AM ET before the cash open, representing a 36.75-point decline from the 8:45 AM high of 5588.25.
At the 9:30 AM open, buyers stepped in and lifted the tape, propelling ES to 5570.50 by 10:06 AM, marking a 49.00-point rally (+0.89%) from the Globex low. However, this strength quickly faded, as the market retraced down to 5536.25 at 10:27 AM, shedding 34.25 points (-0.61%) in under 25 minutes.
Upward momentum returned late in the morning, and by 12:09 PM, ES climbed to a new high of 5577.25 — a 55.75-point move (+1.01%) from the 9:03 AM low. This strength proved short-lived, as sellers hit the tape into midday, dragging ES down to 5547.25 at 12:54 PM, a 30.00-point decline (-0.54%) off the high.
The market stabilized briefly and rallied again, topping at 5597.25 at 2:03 PM — the highest tick of the day — before softening into a series of minor pullbacks and failed higher highs. Subsequent attempts to reclaim strength stalled at 5595.25 at 2:39 PM and 5596.50 at 3:48 PM. Each high failed to exceed the earlier 2:03 PM peak with conviction. Dips to 5583.50 at 2:21 PM and 5580.50 at 3:42 PM served as near-term support but failed to launch new legs higher.
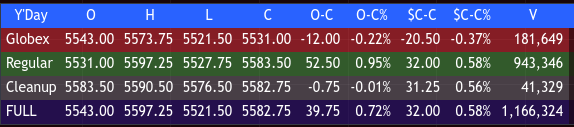
The regular session closed firmly at 5583.50, logging a gain of 52.50 points (+0.95%) from the open and up 32.00 points or +0.58% from the prior day’s close. Total volume in the regular session was 943,346 contracts, with the full day settling at 5582.75.
Tuesday’s tone leaned bullish, particularly in the regular session, where ES reversed early weakness and held gains into the close. Globex finished softer by 12.00 points (-0.22%), but the cash session more than offset that loss. Dip buyers were active through the morning and mid-afternoon, though the inability to cleanly break above the 5597 area suggested a measured tone.
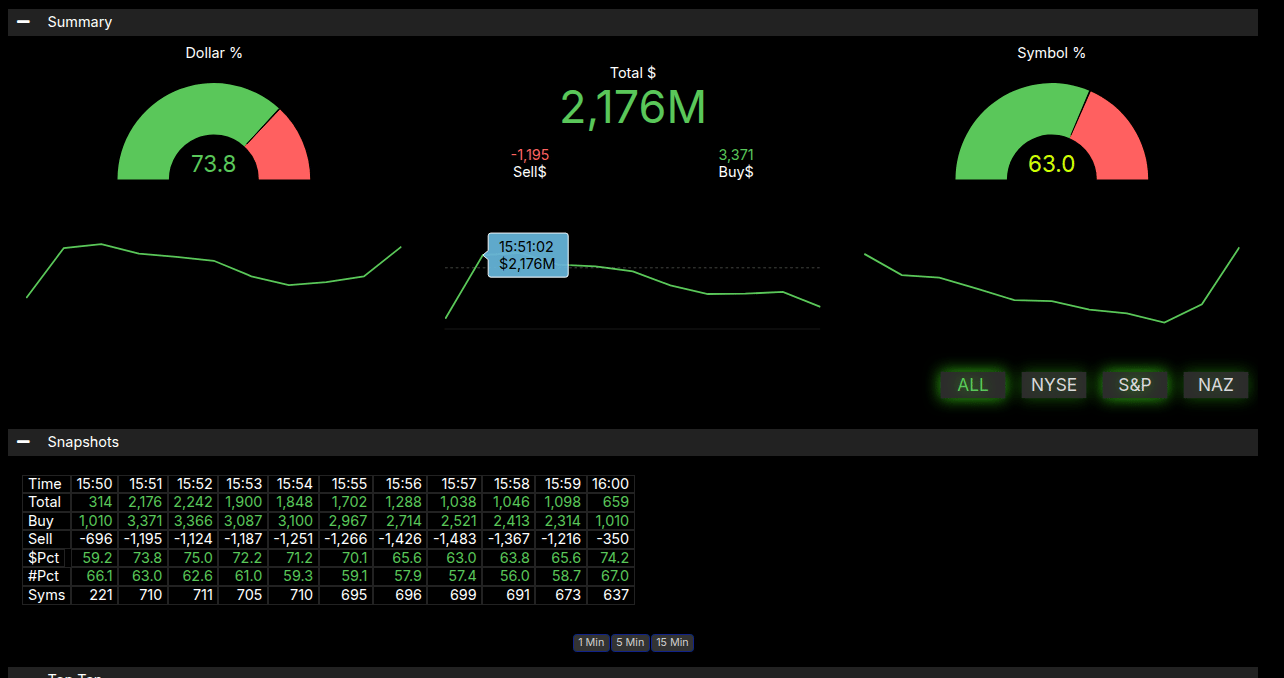
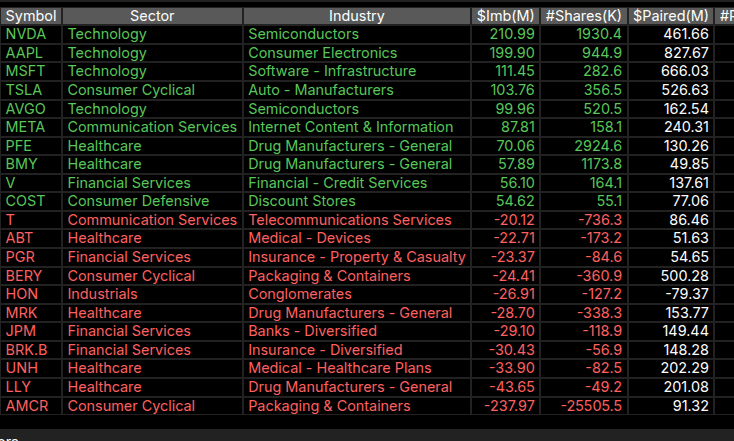
The Market-on-Close imbalance provided a notable late-session driver. MiM data showed a strong buy imbalance into the bell, with 73.8% of dollar flow and 63.0% of symbol flow leaning to the buy side. The imbalance peaked at $2.176 billion to buy around 3:51 PM, helping support prices in the final moments of trade. Notably, symbol flow came just under the +66% threshold for a strong imbalance, but dollar flow firmly met the criteria. That likely contributed to the stickiness near 5590 during the 3:45–4:00 PM window, with ES finishing the session just a few ticks off the day’s high.
Overall, the session marked a return to a constructive tone and dip demand, supported by institutional flow late. All eyes now shift to whether 5597 can be converted into support, or if the market consolidates below that ceiling into month-end positioning.
Technical Edge
Fair Values for April 30, 2025:
-
SP: 24.23
-
NQ: 100.5
-
Dow: 129.42
Daily Market Recap 📊
-
Tuesday, April 29, 2025
-
NYSE Breadth: 61.3% Upside Volume
-
Nasdaq Breadth: 79.6% Upside Volume
-
Total Breadth: 75.2% Upside Volume
-
NYSE Advance/Decline: 65.7% Advance
-
Nasdaq Advance/Decline: 61.2% Advance
-
Total Advance/Decline: 63.9% Advance
-
NYSE New Highs/New Lows: 28 / 16
-
Nasdaq New Highs/New Lows: 93 / 60
-
NYSE TRIN: 1.20
-
Nasdaq TRIN: 0.40
-
Weekly Market 📈
-
Week Ending Friday, April 25, 2025
-
NYSE Breadth: 62.7% Upside Volume
-
Nasdaq Breadth: 68.4% Upside Volume
-
Total Breadth: 66.1% Upside Volume
-
NYSE Advance/Decline: 80.1% Advance
-
Nasdaq Advance/Decline: 78.7% Advance
-
Total Advance/Decline: 79.2% Advance
-
NYSE New Highs/New Lows: 65 / 128
-
Nasdaq New Highs/New Lows: 162 / 313
-
NYSE TRIN: 1.03
-
Nasdaq TRIN: 0.72
-
Guest Posts — Polaris Trading Group
Prior Session was Cycle Day 3: Positive 3-Day Cycle as price rallied 117 pts (77.88%) closing near highs of the day. Momentum may take price higher before the next decline begins.
For a more detailed recap of the trading session, click on this link: Trading Room RECAP 4.29.25
Range for this session was 75 handles on 1.166M contracts exchanged..
FREE TRIAL link to PTG/Taylor Three Day Cycle
…Transition from Cycle Day 3 to Cycle Day 1
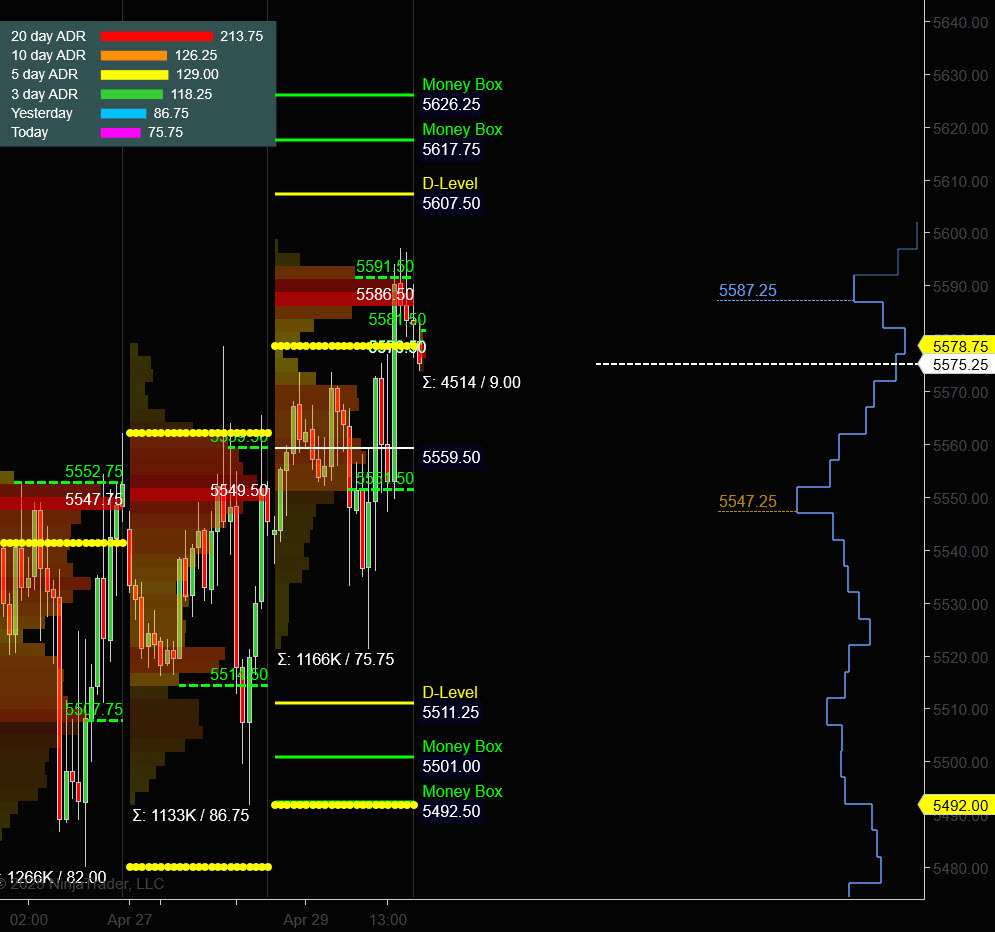
Transition into Cycle Day 1: Cycle dynamics remain intact and levels are now beginning to encompass the recent spike in Average True Range (118).
Today begins a new cycle with the Average Decline projection measuring 5441.50.
Prior session closed just off the high of day (5597.25) with bulls maintaining control, as Value Area continues to migrate higher, which is a bullish structural development.
Of course, nothing changes for PTG…Simply follow your plan. Take only Triple A setups and manage the $risk. ALWAYS HAVE HARD STOP-LOSSES in-place on the exchange.
PTG’s Primary Directive (PD) is to ALWAYS STAY IN ALIGNMENT with the DOMINANT FORCE.
As such, scenarios to consider for today’s trading.
Bull Scenario: Price sustains a bid above 5575+-, initially targets 5607 – 5617 zone.
Bear Scenario: Price sustains an offer below 5575+-, initially targets 5560– 5550 zone.
PVA High Edge = 5591 PVA Low Edge = 5551 Prior POC = 5586
Thanks for reading, PTGDavid
Trading Room Summaries
Polaris Trading Group Summary – Tuesday, April 29, 2025
Yesterday was a textbook example of patience paying off, as the market transitioned from tight consolidation to powerful expansion, with PTGDavid guiding the room through several profitable setups and strategic insights.
Positive Trades & Highlights
-
Early Bearish Setup Delivered: PTGDavid highlighted a bear scenario below 5550 with targets down to the 5515 zone. Price action followed through, validating the trade plan.
-
Major Long from Dip at 5540: After a brief technical hiccup with charts, David identified a key long opportunity at 5540. The bulls responded, and price rallied toward the DTS target of 5575, which was hit by 11:02 AM.
-
Continuation Long to 5585: The uptrend extended, with 5585 as the next target per DTS, and it was tagged quickly by 1:47 PM, reinforcing the strength of the day’s bullish rhythm.
-
Final Power Move into the Close: A MOC (Market on Close) buy imbalance of $2 billion propelled prices higher into the closing bell. David’s call at 84.50 provided another actionable entry for traders aiming to capture the late-session surge.
Lessons & Insights
-
Patience in Consolidation: David noted it was Day 3 of balancing, a key insight for traders learning to anticipate expansion after periods of low volatility.
-
Rule-Based Focus: He encouraged traders to focus on rule adherence, not just PnL, referencing SamuraiPips’s mental framework advice—reminding the room that maturity in trading stems from process, not emotions.
-
Trade Management Wisdom: “Take profit when it is there or it may quickly vaporize” was a key reminder during choppy price action.
Market Context
-
Tariff talk from Bessent and Trump’s pending executive order on auto tariffs created early volatility.
-
Macro headlines (e.g., China waiving tariffs on U.S. ethane) contributed to shifting sentiment, but the technical levels—particularly the VWAP-aligned LIS at 5550—held strong as a key inflection point.
-
The theme of T+1 and big players stepping in played out, especially in the afternoon session.
Overall, a strong day for those who followed the strategy and stayed nimble. Expansion from contraction rewarded disciplined traders with multiple high-probability entries and clean targets.
Discovery Trading Group Room Preview – Wednesday, April 30, 2025
-
Trade & Policy:
-
President Trump signed an executive order rolling back parts of the auto tariffs.
-
Commerce Secretary Lutnick claimed a new trade deal is “done” with an unnamed country.
-
Trump stated China would absorb U.S. tariffs and “deserved” the 145% rate.
-
The President escalated criticism of Fed Chair Powell; White House is reportedly studying his possible removal.
-
-
Economic Outlook:
-
Today’s key releases include:
-
ADP (8:15am ET), GDP & Employment Cost Index (8:30am), Chicago PMI (9:45am),
-
Core PCE, Pending Home Sales, Personal Income/Savings (10:00am), Crude Inventories (10:30am).
-
-
Consumer confidence dropped to a 5-year low.
-
China’s factory output hit lowest levels since Dec. 2023—early signs of U.S. tariff effects.
-
-
Earnings Watch:
-
After-hours movers:
-
Starbucks (SBUX) fell ~7% on weak Q2 earnings and declining China spend.
-
Super Micro (SMCI) dropped 15% after weak preliminary Q3 results.
-
Seagate (STX) jumped 9% on raised Q4 guidance.
-
-
Key reports today:
-
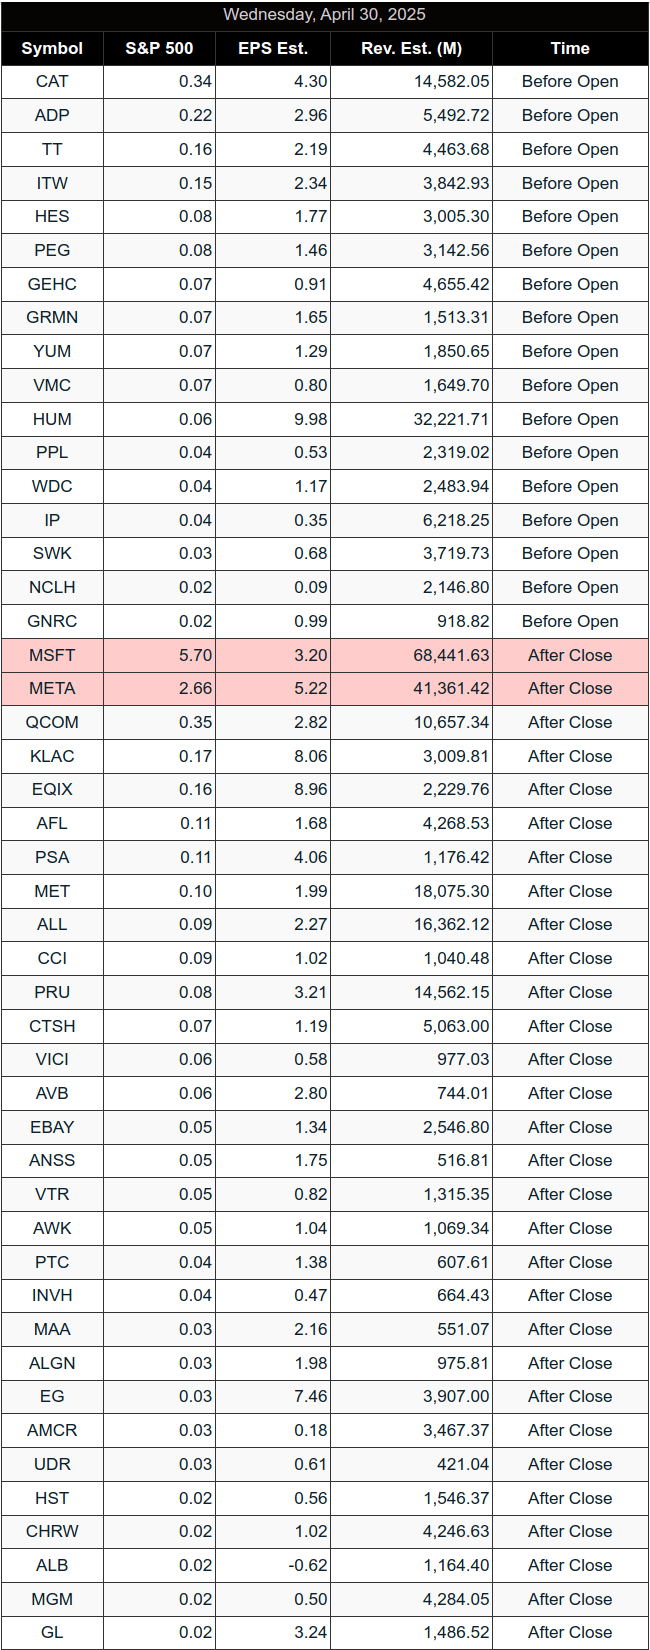
Premarket: CAT, HUM, STLA, UBS, YUM, among others.
-
After the bell: MSFT, META, QCOM, HOOD, EBAY, ALL, MET, and more.
-
-
-
Markets & Technicals:
-
Volatility is contracting: ES 5-day ADR is down to 123.25.
-
Whale bias remains bearish into the morning data.
-
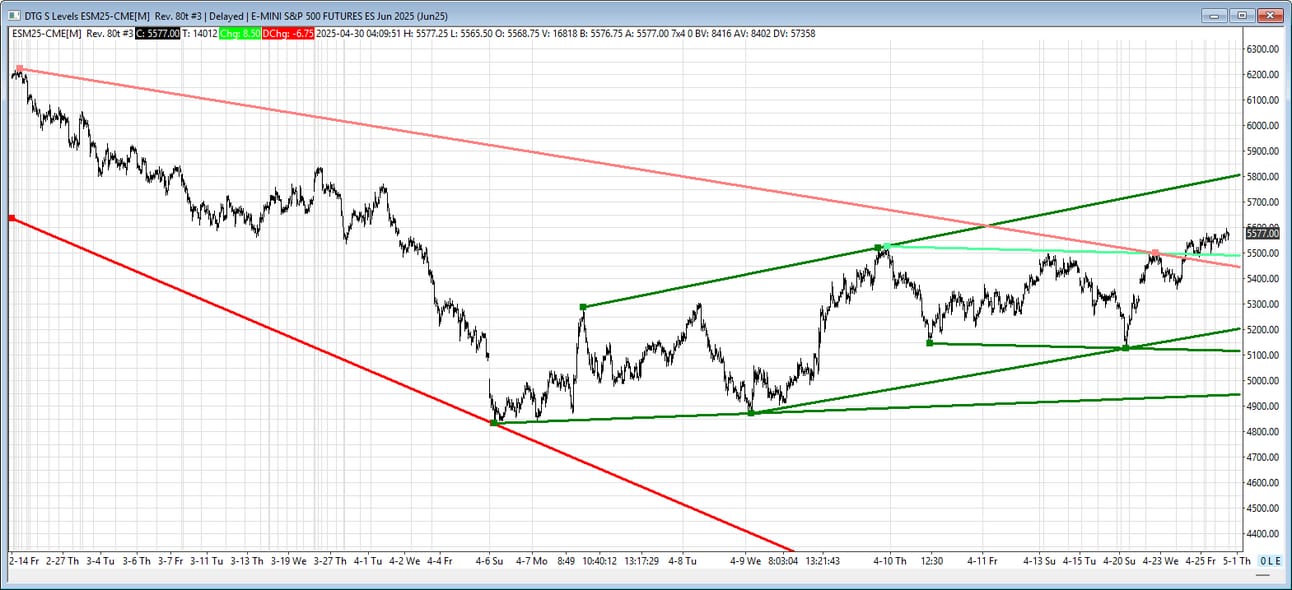
ES continues inside a short-term uptrend channel:
-
Potential Resistance: 5801/06
-
Support levels: 5491/86, 5440/44, 5198/03, 5110/05, 4940/50
-
-
ES
The bull/bear line for the ES is at 5573.50. This is the key pivot level for today and must be reclaimed and held to shift sentiment back in favor of the bulls. Price is currently printing right at this level in the Globex session, suggesting indecision into the open.
If buyers can hold above 5573.50, the next upside levels to monitor are 5582.75 (pivot close) and 5597.25 (previous session high). Clearing those opens the path toward 5614.25, and ultimately the upper range target of 5646.75. Continued strength through that level would put 5715.50 (R1) in play later in the week.
If price falls below the bull/bear line, support begins at 5543.00 (pivot open). Further weakness would target 5521.50 (prior low), followed by 5508.00 (ubb1), and then 5500.25, which marks the lower range target for today. A breakdown below this area would expose deeper support toward 5431.25.
Trend bias remains neutral at the bull/bear line, with a lean bearish if price moves and holds below 5573.50. A move back above 5597.25 would start to tilt momentum decisively back to the upside.
NQ
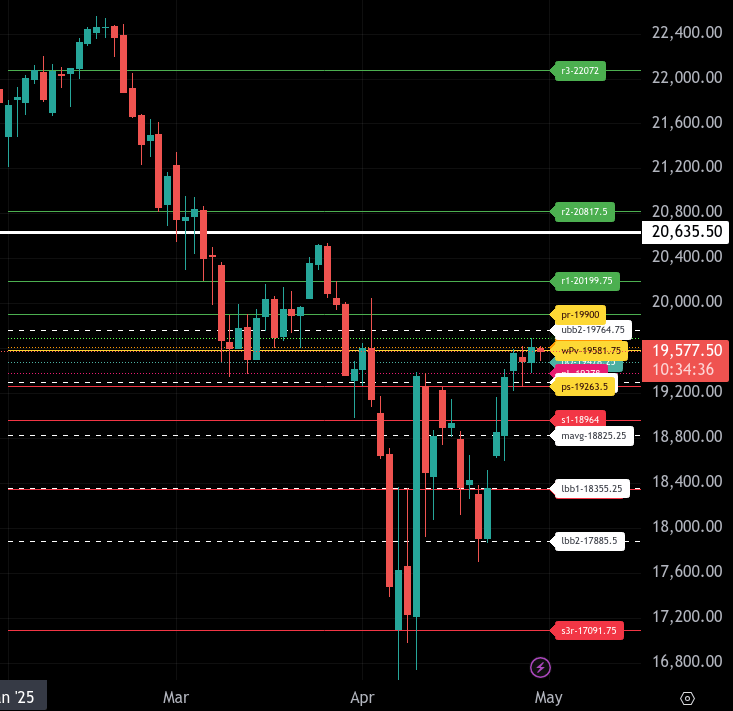
The bull/bear line for the NQ is at 19,581.75. This is the key pivot level for today. If price remains below this level, sellers are in control, and momentum favors the downside.
NQ is currently trading near 19,579.00, just below the bull/bear line, suggesting early weakness. If selling persists, look for support at 19,478.25 and 19,378.00 before the lower intraday range target at 19,263.50. Below that, additional support is layered at 19,295.00, 18,964.00, and a major structural level at 18,355.25.
To the upside, buyers must reclaim and hold above 19,581.75 to shift sentiment back to bullish. If successful, upside levels to watch include 19,614.75, 19,688.50, and 19,764.75 before reaching the first target at 19,900.00, which is today’s upper range target. Beyond that, resistance comes in at 20,199.75 and the extended target at 20,817.50.
Overall, NQ remains vulnerable below 19,581.75, and sellers have the edge until that level is decisively recovered.
Calendars
Economic Calendar
Today
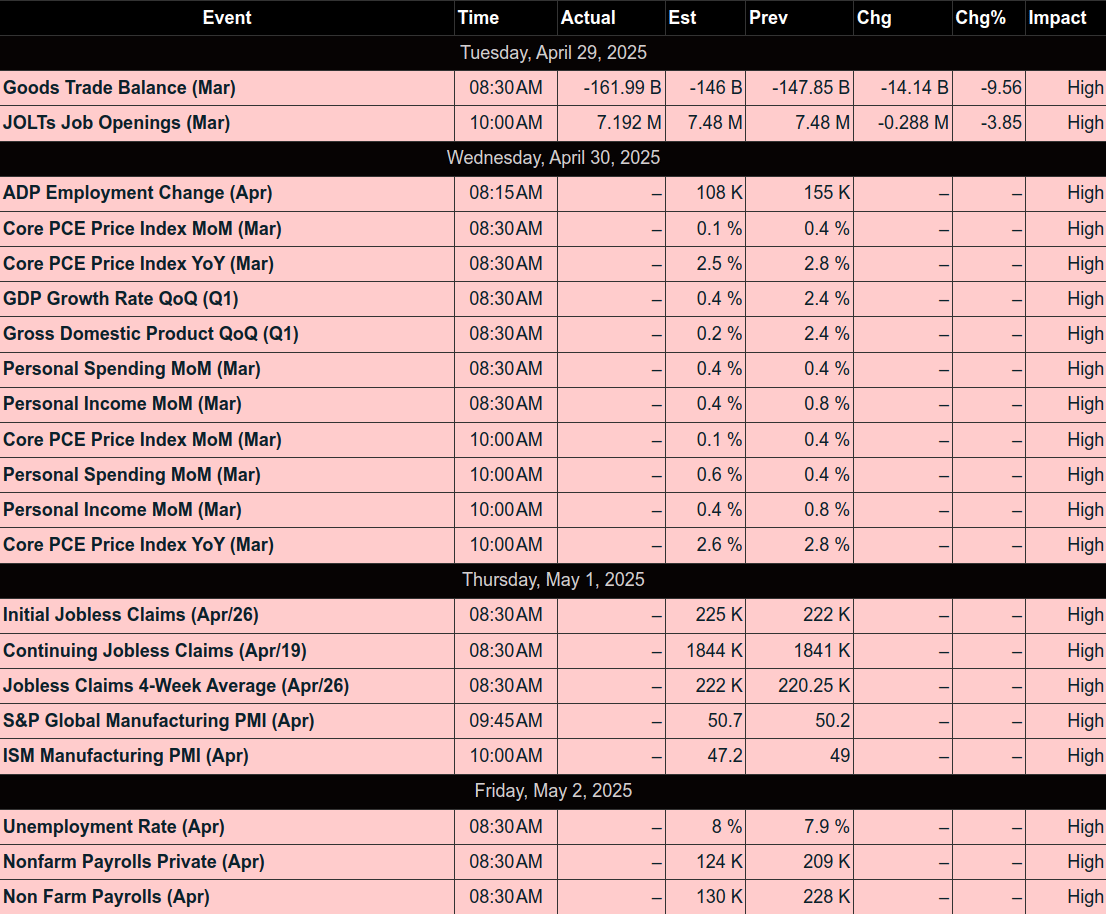
Important Upcoming
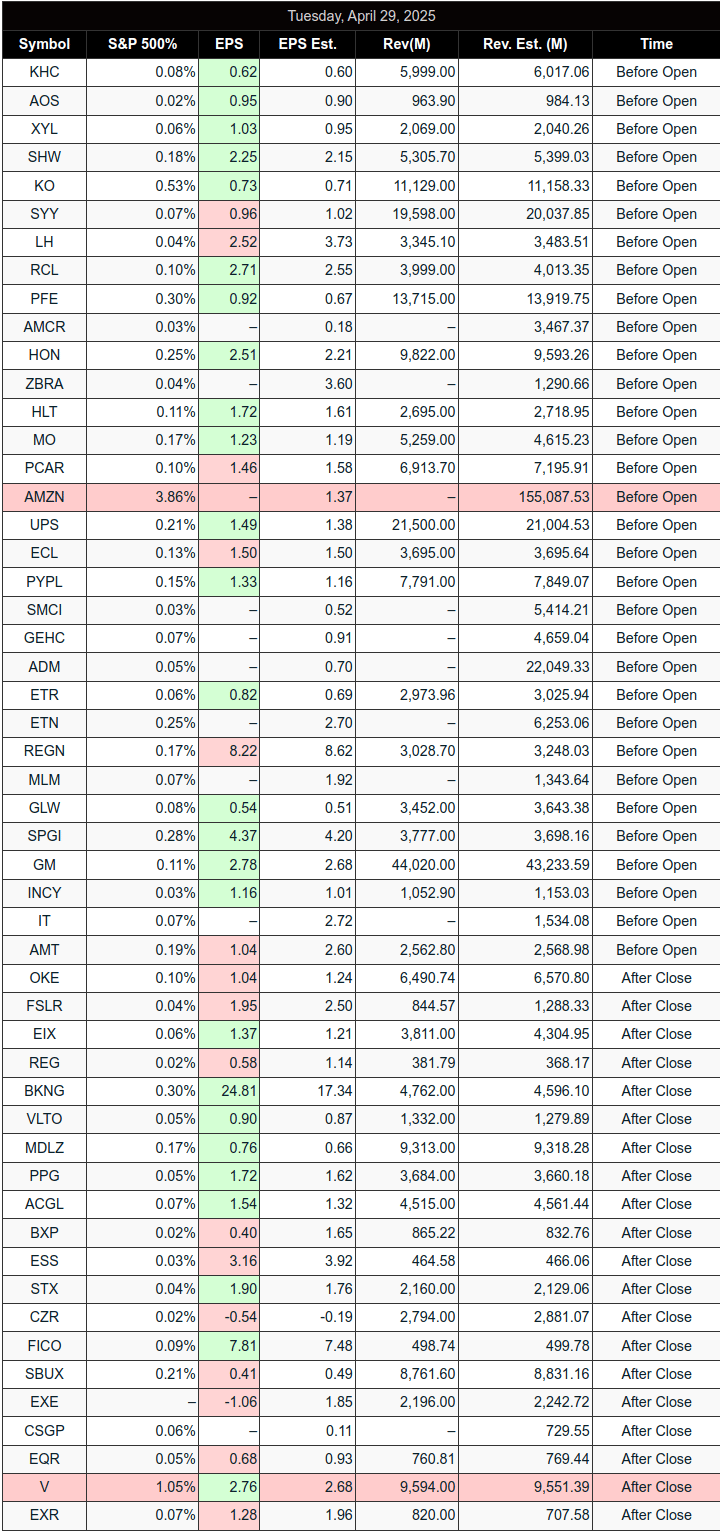
Earnings
Affiliate Disclosure: This newsletter may contain affiliate links, which means we may earn a commission if you click through and make a purchase. This comes at no additional cost to you and helps us continue providing valuable content. We only recommend products or services we genuinely believe in. Thank you for your support!
Disclaimer: Charts and analysis are for discussion and education purposes only. I am not a financial advisor, do not give financial advice and am not recommending the buying or selling of any security.
Remember: Not all setups will trigger. Not all setups will be profitable. Not all setups should be taken. These are simply the setups that I have put together for years on my own and what I watch as part of my own “game plan” coming into each day. Good luck!
This post goes out as an email to our subscribers every day and is posted for free here around 2 PM ET. To get your real-time copy, sign up for the free or premium version here: Opening Print Subscribe.
Comments are closed