This post goes out as an email to our subscribers every day and is posted for free here around 2 PM ET. To get your real-time copy, sign up for the free or premium version here: Opening Print Subscribe.
ES Hits Wall as Economic Reality Sinks In
Follow @MrTopStep on Twitter and please share if you find our work valuable!
Our View
Market Recap
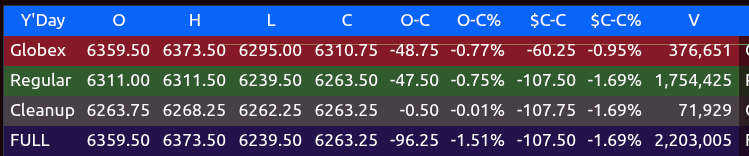
Globex Low: 6295.00
Day Session Open: 6311.00
High: 6311.50
Low: 6239.50
3:50 Imbalance MOC Buy: $2.6 billion
4:00 Cash Close: 6263.50
5:00 Close: 6263.25, down 1.69%
Volume: 2.2 million
Eeee… The ES sold off down to 6295.00 on Globex, down 1.2%, and the NQ traded all the way down to 23,031.50, down 1.33%. I think it works like this: when the S&P and Nasdaq looked their worst on April 7, everyone was bailing. After an 80-session rally and gains of 1638.50 points, everyone was scratching their heads in disbelief at how far the markets have rallied.
The ES traded 6311.00 on the 9:30 ET open of the regular session, traded 6311.50, and sold off 72 points down to 6239.50. After the low, the ES had a few decent short-covering rallies that failed. The ES traded 6280.25 as the 3:50 imbalance showed $2.6 billion to buy, traded 6263.50 on the 4:00 cash close, and settled at 6263.25, down 107.75 points or -1.69%, the largest daily drop since May 21, 2025.
JOBS Catastrophe
In the end, the brutal jobs report showed only 73k jobs in July, which was well below most economists’ expectations of 100K. Even more shocking were the massive downward revisions over the past two months. The economy added just 14,000 jobs in June, after the number was initially reported as 147,000. Only 19,000 jobs were added in May after initially being reported as 144,000. The combined revisions showed 258,000 fewer jobs in the economy, and the report from the Bureau of Labor Statistics suggested the economy and labor market are much weaker than previously thought, raising questions about whether the president’s tariff regime is keeping businesses from hiring.
So what does Trump do? He fired BLS commissioner Erika McEntarfer, accusing her without evidence. I think we all knew there were going to be side effects from Trump’s tariffs, and it’s evident that it’s holding back businesses from hiring.
The three-month average of approximately 35,000 jobs is the lowest since early 2020, during the initial economic fallout from the COVID-19 pandemic, when job growth plummeted to near-zero or negative levels due to widespread lockdowns. Prior to 2020, similar low job growth was observed during the 2008–2009 financial crisis, with monthly job gains averaging around 30,000–50,000 in late 2008 and early 2009, and negative growth in some months.
Do tariffs actually work? I guess, but a 2019 study by the National Bureau of Economic Research found that US consumers bore over 90% of the cost of tariffs on Chinese goods, with prices for goods like washing machines rising by about $86 per unit. When China retaliated with counter-tariffs, they hit US agricultural exports hard, costing farmers an estimated $16 billion in 2018–2019. And that doesn’t count the cost of disrupting the supply chains.
I have always said my main concerns are treasury yields and the dollar. After a five-day rally, the dollar (DXY) fell to 98.6941, marking a 1.27% decline from the previous session. The EUR/USD exchange rate rose to 1.1590, up 1.48% from the prior session. On a slightly more positive note, bond prices soared. The yield on the 10-year note dropped 13 basis points to 4.236%, while the 30-year bond yield pulled back 4.8 basis points to 4.837%. This pushed up the odds of a September rate cut: according to the CME’s Fed-funds futures, there is a 66.8% probability. Morningstar says the bond market now sees roughly 80% odds of a September cut, and Barron’s reported odds soared past 80%.
In the end, it seems like the S&P and Nasdaq hit a brick wall, with the end of July and the beginning of August seeing unseasonably negative stats colliding with extremely overbought conditions and shocking jobs data. In terms of the ES’s and NQ’s overall tone, it was all sell programs and sell stops. In terms of the ES’s overall trade, volume was high, but not for the size of the range, with 2.2 million contracts traded.
The week ahead has only eight economic reports, two Fed speakers, and 122 companies in the S&P reporting earnings. Palantir (PLTR) and Axon (AXON) report after market close on Monday, August 4th, with calls at 5 PM ET. Tuesday, August 5th is busy: Caterpillar (CAT) and Bayer (BAYRY) report before the open; AMD, Astera Labs (ALAB), Pfizer (PFE), and Amgen (AMGN) all report after the close. SiTime (SITM) reports after the close on Wednesday, August 6th, at 5 PM ET. Finally, Thursday, August 7th, sees Eli Lilly (LLY) and Gilead Sciences (GILD) reporting before the open (8:30 AM ET calls), while Ligand Pharmaceuticals (LGND) reports after the close.
Our Lean
WELCOME TO STAGFLATION
It only took a few minutes to know the direction of the ES. It gapped sharply lower and opened on its high of the day. I really think most people knew things were not going well, and the first clues were all the Bureau of Labor Statistics revisions: May and June nonfarm payrolls were revised down by a combined 258,000 in the July report, erasing 88% of previously reported gains for those months. May’s initial estimate of 144,000 new jobs was slashed to just 19,000, the steepest revision since March 2021. June was also revised down, from an initial report of 147,000 jobs to only 14,000 jobs added, and now this. I don’t think this is going to be an easy fix, and even if the Fed lowers rates, I’m not sure that’s going to lower inflation or put a lot of people back to work.
I have a hard time switching gears. I see it; I write about it, but because I’m not short, I try and buy it. While I did have a few trades go my way for 20 or 30 points, I tried to get more out of the trades. That type of trading does not work, and it throws you off the real price action. Not only that, you miss out on big moves that have better risk reward. Is the sell-off over? I don’t know, but the 6200 level is a key area.
Our lean: I don’t think the fallout of last week is over, but after a 230-point drop, I can’t rule out a few bounces. I don’t think Friday’s extremely disappointing job print will just disappear like everything else. It is 2:45 on Sunday afternoon, and my guess is we see some type of bounce on Globex. My gut says you can sell a big rip, but I am going back to trading less and picking my spots better.
Check out the monthly report from Bill Fritz, one of t traders in the room. A discussion on Metal and Energy:
Guest Post – SpotGamma:
Get instant access to our partners’ real-time market data and insights not available anywhere else. Here is last night’s Founder’s note getting you ready for today’s market and explaining the constraints in yesterday’s market. – MrTopStep

You’re Invited — SHARPEN YOUR SKILLS: TRACE
Wednesday, 8/6 | 12 PM ET
Why do some moves stall out, while others accelerate? Why does the market close on a trendline some days, but other times, spike or crash at the end of the day?
TRACE unveils hidden buying and selling pressure so you can spot support, resistance, and volatility for the S&P 500 each day – empowering you to optimize your entries and exits.
Join us for a free webinar on Wednesday, August 6, at 12 PM ET, for a deep dive into:
-
Gamma — Spot where market makers will hedge, which can either accelerate or reduce volatility
-
Delta Pressure — See how intraday shifts in market maker positioning affect buying & selling pressure
-
Charm Pressure — Explore how time influences positioning and can trigger unexpected price moves and pins
GEX-by Strike Bars — Visualize open interest and 0DTE exposure to identify where gamma will create intraday support & resistance
From “Zombie Market” to Vol Awakening
What a difference a week makes. The S&P 500 went from consistently hitting all-time highs with 6,450 touched on Wednesday to close Friday down 1.6% to 6,238.
This dramatic shift from “zombie market” to spiking realized volatility exemplifies the need for protective puts and/or VIX calls as insurance, as we highlighted in the daily pre-market Founder’s Notes throughout last week. Insurance like this grows increasingly important as markets pivot from complacency to concern
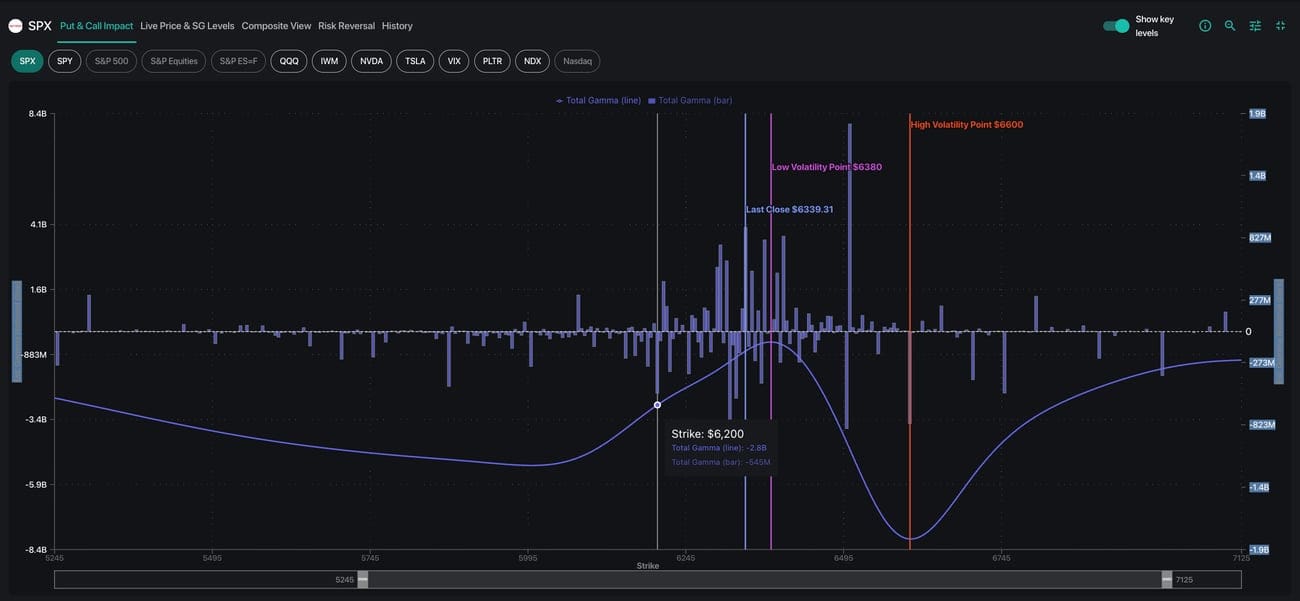
On Wednesday evening both META and MSFT delivered blowout earnings, initially suggesting the bull run would continue. However, the real damage arrived Friday when disappointing NFP data combined with ongoing tariff headline risks pushed the market below the critical 6,300 pivot level.
This awakened volatility from the summer slumber, as the VIX surged from 15 to 20 by week’s end. Our Volatility Dashboard had been highlighting the unusually low IV and the risk of this exact scenario for weeks: with 1-month realized vol compressed to just ~6%, any catalyst could trigger a sharp vol expansion.
Single Stock Moves: The Healthcare Highlights
This past week saw UNH drop to a 5-year low. However, the stock showed an unusual upside skew premium despite being driven to recent lows – an anomaly where call options 100 points out-of-the-money were trading with very sizeable premiums of 63 cents above at-the-money options.
The positive skew premium indicated elevated call demand from retail buyers hoping for recovery. However, when the stock bounced from $240 to $243 the call premiums actually lost value because the IV collapsed faster than the increase in price.
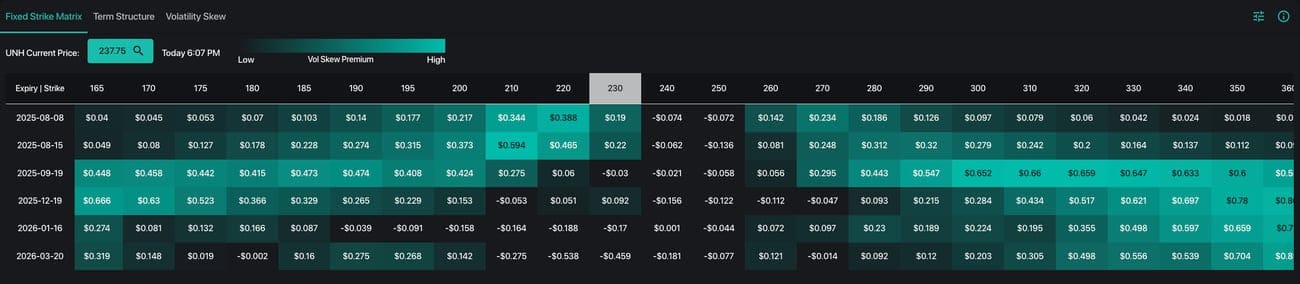
This positioning created a prime selling opportunity as the market was pricing in an absurd rally scenario – making these overpriced calls attractive candidates for premium selling strategies when skew premiums become excessive relative to realistic expectations.
Another healthcare stock on traders’ radar was Novo Nordisk (NVO), which plunged -18% on Tuesday following disappointing trial results before bouncing at the $45 put wall on Friday. Following the initial selloff, the stock saw heavy demand for upside structures rather than outright equity purchases, reflecting limited trader conviction.
Next Week’s Outlook: Navigating the New Regime
The question we now face: Is this a mild correction allowing vols to reset a bit and call skews to cool, or is this the start of something more severe? Our positional analysis suggests the former, since we don’t see the massive imbalances that characterized the July & August 2024 selloff.
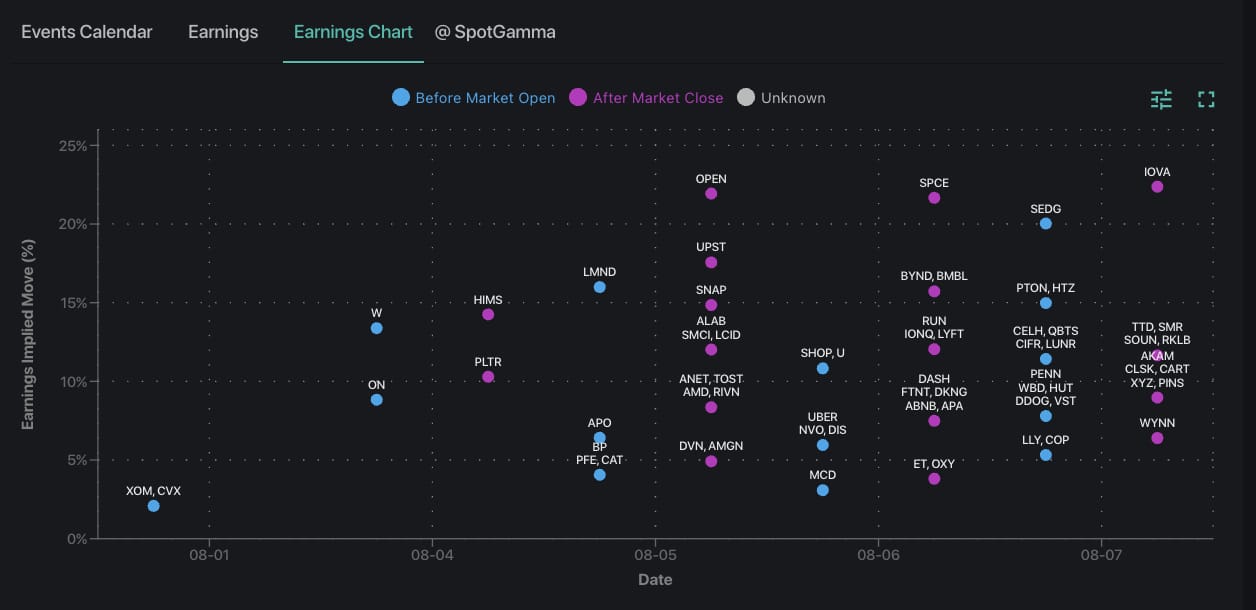
The upcoming calendar brings lighter fundamental headlines with 11% of S&P 500 market cap reporting earnings, but several key events still bear watching:
-
Earnings from Energy, Healthcare, and Utilities sectors
-
CPI (8/12)
The market’s zombie phase appears to be ending, replaced by more traditional price discovery. For active traders, this environment offers significantly more opportunities than the recent low-volatility grind – the key is having the right tools to navigate the increased volatility.
We encourage all traders to stay informed with the latest options analysis, and remember: in volatile markets, having the right data and tools makes all the difference.
MiM and Daily Recap
Intraday Recap:
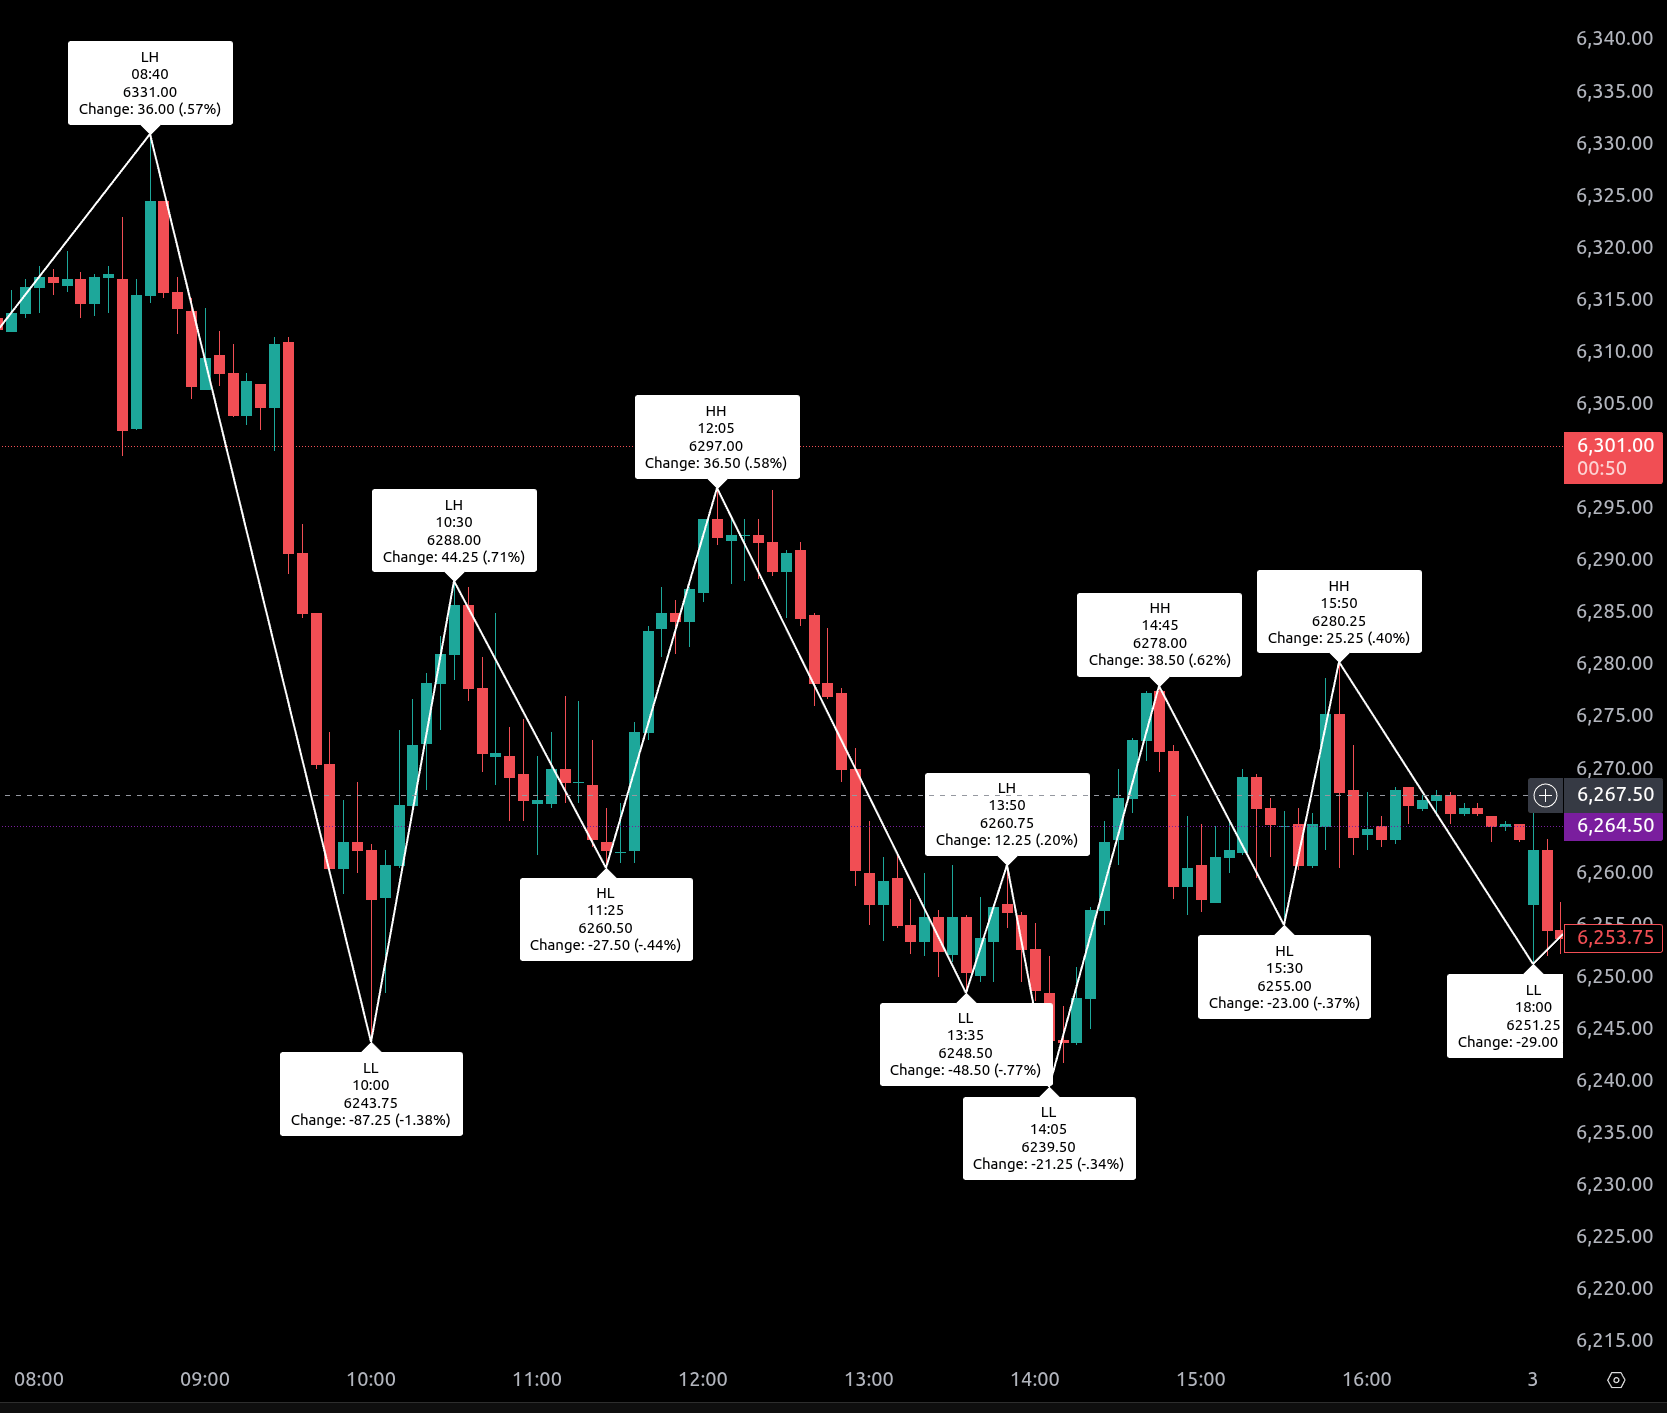
Friday’s session opened with a continuation of overnight weakness. The ES began the Globex session at 6359.50, falling swiftly to a low of 6346.25 by 20:15. A modest bounce led to a lower high at 6372.50 at 23:30, before sellers regained control. The market resumed its slide, reaching 6295.00 at 06:45, marking a total loss of 64.50 points from the overnight high.
Heading into the regular session, the ES opened at 6311.00, went up half a point and fell, plunging to 6243.75 by 10:00, down 87.25 points (-1.38%) from the pre-market morning high.
A volatile rebound carried prices up to 6288.00 at 10:30 before another leg down found a higher low at 6260.50 by 11:25. From there, a midday rally peaked at 6297.00 by 12:05, gaining 36.50 points from the morning low.
The afternoon action saw a series of lower highs and higher lows. Another retracement took prices to 6239.50 at 14:05, establishing the low of the day, before a push to 6278.00 at 14:45. This move stalled, and a sequence of tightening swings followed, with a lower high at 6280.25 at 15:50 and the final low of the session printed at 6251.25 at 18:00.
The regular session closed at 6263.50, down 47.50 points from the open and down 107.50 points (-1.69%) from the prior cash close. The full session settled at 6263.25, reflecting a 96.25-point loss (-1.51%) from the previous day. Total volume was elevated, with 2.2 million contracts traded.
Market Tone & Notable Factors:
Friday’s tone was decisively bearish, marked by persistent selling pressure across both sessions and failed intraday rallies. Sellers controlled the tape from the outset, with lower highs capping each recovery attempt and deep pullbacks establishing lower lows throughout the day.
Volume was notably strong, particularly in the cash session, where over 1.75 million contracts exchanged hands, signaling active institutional participation. The broad-based nature of the selling and rejection of bounce attempts reinforced the risk-off sentiment.
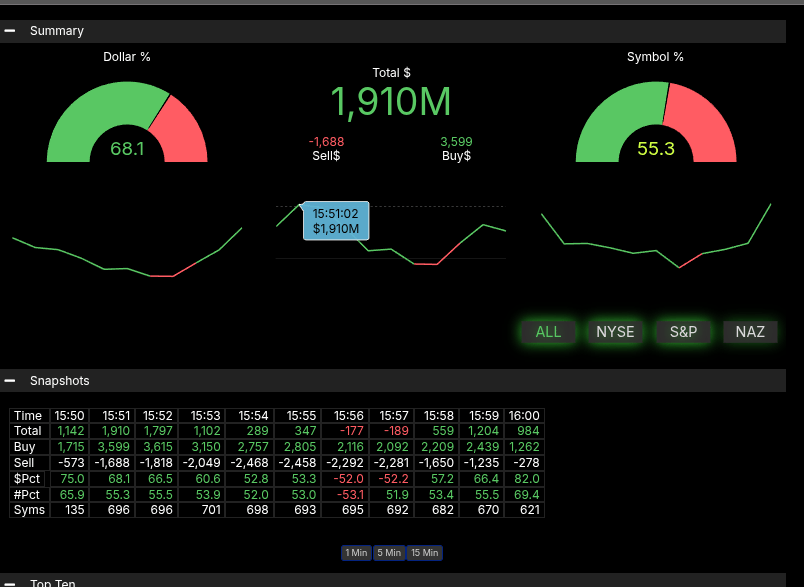
Market-on-Close (MOC) imbalance data showed a strong buy imbalance of $1.91 billion, with 68.1% of the notional flow on the buy side. However, the symbol imbalance ended at just 55.3%, failing to cross the 66% threshold for a notable skew. The MOC appeared to help stabilize prices slightly into the 4:00 PM close, but was not strong enough to trigger a sustained reversal.
In summary, the ES closed out the week with a sharp pullback, reversing gains from earlier sessions and resetting short-term bullish momentum. The heavy selling, coupled with failed bounce attempts, leaves a cautious tone heading into the new week.
Technical Edge
Fair Values for August 4, 2025:
-
SP: 27.6
-
NQ: 118.24
-
Dow: 125.23
Daily Breadth Data 📊
For Friday, August 1
-
NYSE Breadth: 27% Upside Volume
-
Nasdaq Breadth: 36% Upside Volume
-
Total Breadth: 35% Upside Volume
-
NYSE Advance/Decline: 30% Advance
-
Nasdaq Advance/Decline: 26% Advance
-
Total Advance/Decline: 28% Advance
-
NYSE New Highs/New Lows: 35 / 96
-
Nasdaq New Highs/New Lows: 50 / 229
-
NYSE TRIN: 1.15
-
Nasdaq TRIN: 0.66
Weekly Breadth Data 📈
For Week Ending August 1
-
NYSE Breadth: 32% Upside Volume
-
Nasdaq Breadth: 37% Upside Volume
-
Total Breadth: 35% Upside Volume
-
NYSE Advance/Decline: 31% Advance
-
Nasdaq Advance/Decline: 21% Advance
-
Total Advance/Decline: 25% Advance
-
NYSE New Highs/New Lows: 217 / 133
-
Nasdaq New Highs/New Lows: 438 / 322
-
NYSE TRIN: 0.95
-
Nasdaq TRIN: 0.46
Today’s BTS Levels:
ES
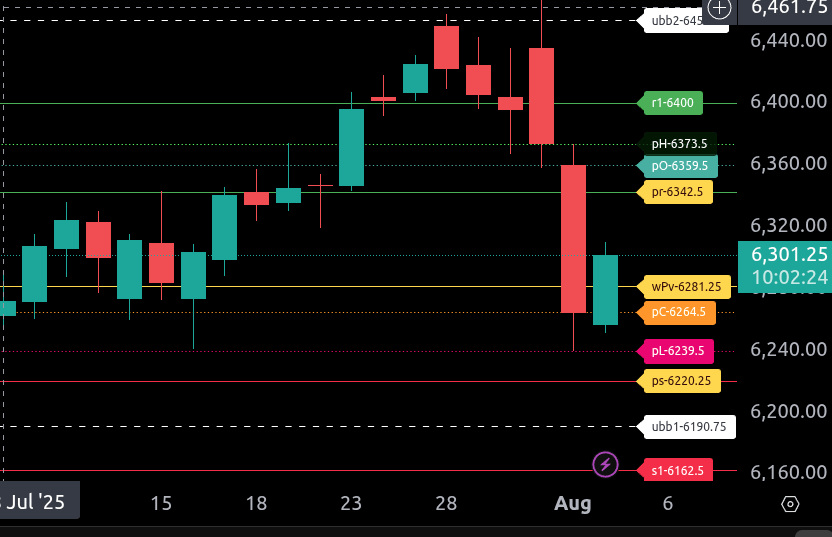
The bull/bear line for the ES is at 6281.25. This is the key pivot level for today’s session. Price must hold above this area for bullish sentiment to develop.
Currently, ES is trading at 6301.50 in the Globex session, showing strength above the bull/bear line. If this level holds, the upside targets are 6342.50, with further resistance at 6359.50 and 6373.50. A breakout above those zones could bring 6400.00 into play.
On the downside, watch for support at 6264.50 and 6239.50. If selling intensifies, look for price to test the lower range target of 6220.25. A deeper flush could bring 6190.75 or even 6162.5 into focus.
Reminder, we are still in a long-term bullish trend. Holding above 6281.25 favors continued attempts higher; slipping below reopens risk toward deeper support.
NQ
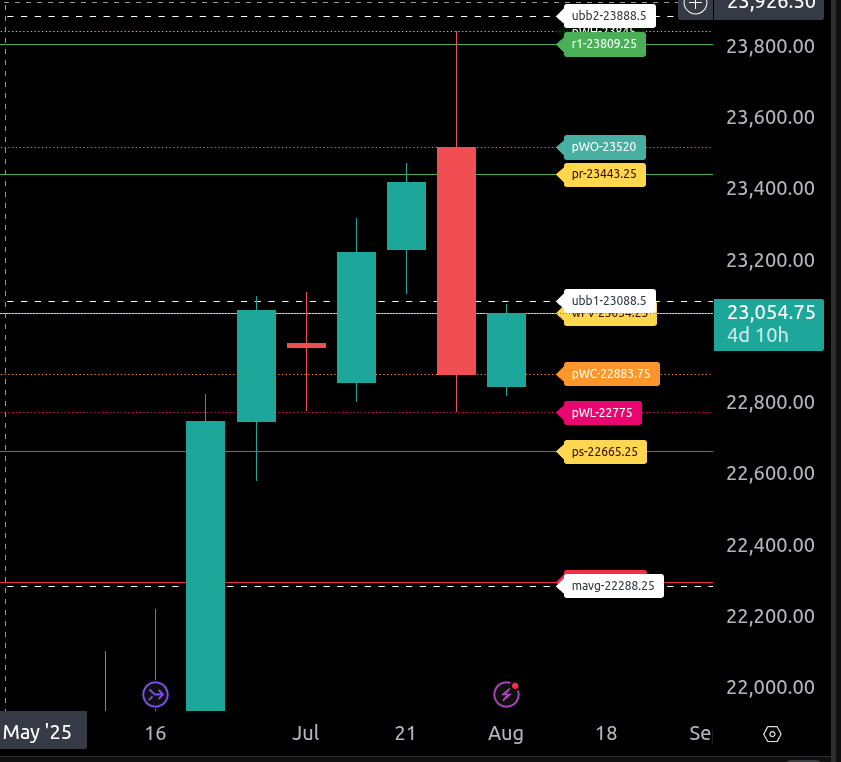
The bull/bear line for the NQ is at 22,954.75. This level serves as our critical pivot for determining directional bias today. Currently, NQ is trading at 23,043.00, just above the bull/bear line, suggesting the potential for bullish continuation if this level holds.
If price remains above 22,954.75, the immediate upside targets are 23,242.25 and 23,512.75, with the upper intraday range target sitting at 23,609.25. A strong move above 23,609.25 opens the door for a test of 24,070.75.
If NQ loses 22,954.75, downside pressure may resume, with initial support at 22,883.75, followed by the lower range target of 22,667.25. Below that, deeper support sits at 22,396.75 and then 22,275.00.
Staying above the bull/bear line keeps the door open for recovery toward resistance. However, a sustained breakdown below it shifts the focus to lower supports and continued selling pressure.
Calendars
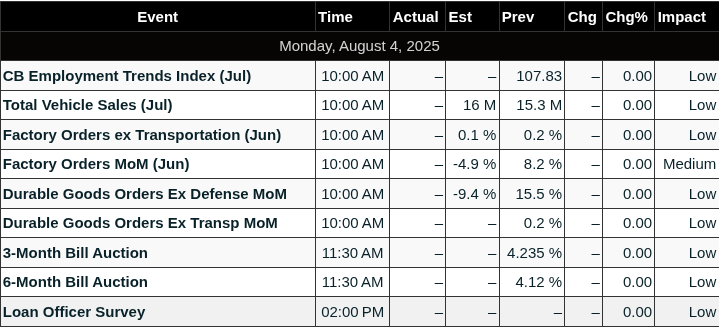
Today’s Economic Calendar
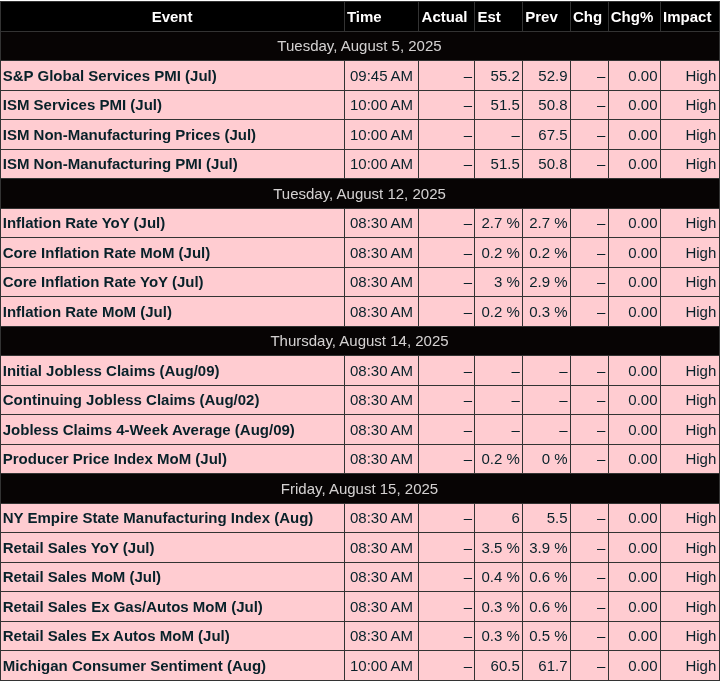
This Week’s Important Economic Events
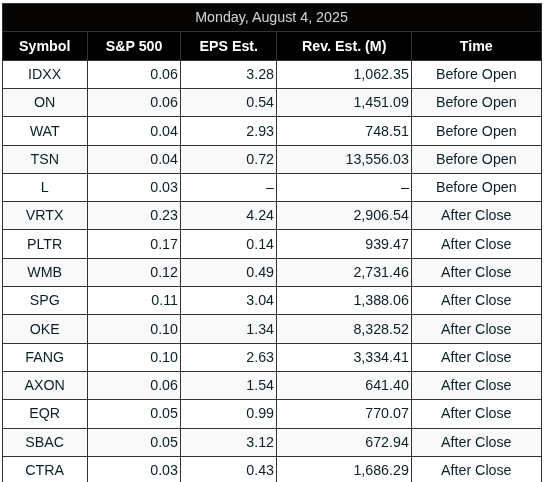
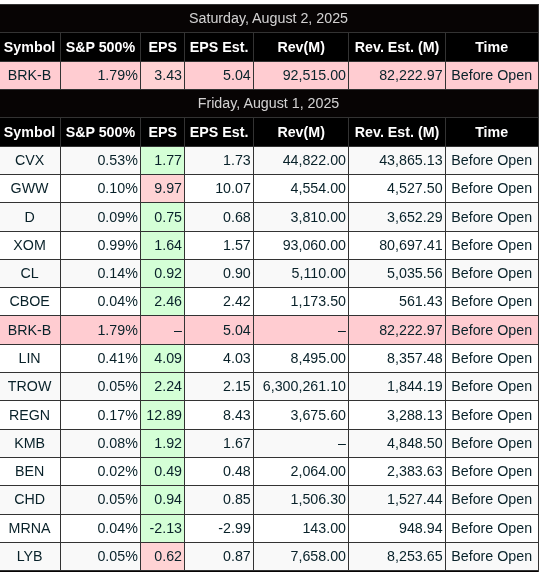
Today’s Earnings
Recent Earnings
Room Summaries:
Polaris Trading Group Summary – Friday, August 1, 2025
The session was characterized by volatility and bearish sentiment initially due to weaker-than-expected Nonfarm Payrolls data and downward revisions to previous months. This triggered increased expectations of a Federal Reserve rate cut in September, spurring notable intraday price movements.
Key Events and Sentiment:
-
Pre-Market: Overnight selling exceeded lower targets, tagging 6295. The key level identified for bulls was 6330 to neutralize bearish momentum.
-
Economic Data Impact:
-
Nonfarm Payrolls were significantly weaker (73K vs. expected 104K), with substantial downward revisions to prior months.
-
The ISM Manufacturing PMI also came in below expectations (48.0 vs. 49.5), adding further bearish pressure.
-
Traders reacted to the news by pricing in a higher likelihood (75%) of a Fed easing in September.
-
Trades and Strategies:
-
PTGDavid highlighted the importance of “POWER OF ALIGNMENT” in trades, emphasizing discipline, clear entries, and capital preservation, particularly important on volatile Fridays.
-
A strong example provided was the “A4 short,” demonstrating an ideal execution of a planned trade setup.
-
Traders emphasized “one and done” trades as optimal, avoiding overtrading after capturing the initial high-probability setups.
-
Manny reported executing a planned short around the 6294 level successfully later in the session.
Technical Insights:
-
Key levels noted were 6265 (previous quarter’s high), identified as critical for the weekly close.
-
Fibonacci retracements were actively discussed, emphasizing clarity in measurement points for accurate trade entries and exits.
-
The 89 EMA trading rules chart was shared again for educational reinforcement, indicating disciplined adherence to technical tools.
Lessons Learned & Positive Highlights:
-
Importance of maintaining discipline (“Don’t hesitate on entries”) especially during volatile news events.
-
Avoidance of forced trades was consistently emphasized by members who missed initial moves but wisely chose to stay patient rather than chase the market.
-
Effective utilization of alignment strategy and Fibonacci retracements for entry precision.
Final Market Observations:
-
The market experienced a “Normal Cycle Day 2” (Balancing/Consolidation/Stabilization) after heightened volatility earlier.
-
Late session strength with a $2.6 billion MOC BUY imbalance indicated bullish interest into the close, stabilizing earlier bearish momentum.
Overall Impression:
The session underscored the necessity of discipline, clarity in trade setups, and effective execution. Positive trades hinged on pre-planned setups with patience and avoidance of reactive trading under stress. The day’s volatility offered valuable lessons in trading discipline, strategic patience, and technical alignment.
Key takeaway: Adherence to clear trading rules and setups, capital preservation, and discipline were repeatedly affirmed as essential practices.
Affiliate Disclosure: This newsletter may contain affiliate links, which means we may earn a commission if you click through and make a purchase. This comes at no additional cost to you and helps us continue providing valuable content. We only recommend products or services we genuinely believe in. Thank you for your support!
Disclaimer: Charts and analysis are for discussion and education purposes only. I am not a financial advisor, do not give financial advice and am not recommending the buying or selling of any security.
Remember: Not all setups will trigger. Not all setups will be profitable. Not all setups should be taken. These are simply the setups that I have put together for years on my own and what I watch as part of my own “game plan” coming into each day. Good luck!
This post goes out as an email to our subscribers every day and is posted for free here around 2 PM ET. To get your real-time copy, sign up for the free or premium version here: Opening Print Subscribe.
Comments are closed