This post goes out as an email to our subscribers every day and is posted for free here around 2 PM ET. To get your real-time copy, sign up for the free or premium version here: Opening Print Subscribe.
ES Keeps Climbing, But for How Long?
Follow @MrTopStep on Twitter and please share if you find our work valuable!
FREE Two-Week Offer for the Opening Print Premium. Open up the Lean and other premium features for the next Two Weeks!
Our View
The ES sold off during the overnight Globex session down to 5909.25, then rallied to 5991.25 and opened Tuesday’s regular session at 5943.50. From there, it settled into an upward grind all the way up to 5987.25. (NVDA +3.10%, META +0.11%, MSFT +0.81%, APPLE +1.7%, AMZN +1.05%, GOOG -0.90%, TSLA +3.31%)
I’m all about following the programs, and the program that started on Monday followed through into Tuesday’s trade—until after the ES made its high at 5991.25. It traded sideways until around 2:50, when several 500-lot ES sell orders started showing up, beginning at the 5948.50 level and down to 5981.50. Initially, the ES absorbed the selling, but as the total sell volume increased, the ES began to soften. Then the NQ started going offered, and the ES dropped to the 5868 area.
Several years ago, there was an ES trader who cleared through Gelber Trading in Chicago—a full clearing member of the CBOT and the CME. He had an account that traded the ES, and he went by the name “The Crazy Russian.” He had an uncanny way of boxing in the ES by layering in 1k-lot offers and bids. For several months, people thought he was connected to the Fed. In reality, he was a young trader from Chicago of Russian descent, who had worked on the CME floor for five years and developed a trading system. I’m not sure whether he started losing money or someone reported him to the NFA or CFTC, but he just disappeared.
My S&P desk used to execute large SUP contracts from when the multiplier was $500—buying and selling 20k ES at a time. I didn’t execute those orders myself; a guy from Spear, Leeds & Kellogg (Goldman) did. I would see the hedge fund’s direct line light up and cue John to sell the ES up on Globex, and the $22 billion fund would fire off anything from 2.5k ES to 20k at a clip. It was different back then. The ladder going into the last hour would thicken up, and at times you could sell total bids of 15k in 5–6 ticks or 20k ES offered in 8 ticks.
I get it—a lot has happened since then. The credit crisis, clearing firms blowing up, and the flash crash have all contributed to the overall decline in the ES’s daily volume, like yesterday’s uninspiring 1.1 million contracts traded.
I bought yesterday’s open like I said I would in the lean. Recently, buying the gap-down has been a high-percentage trade. The ES rallied 10 bucks, reversed, and I got out at a small profit. The ES rallied again, I tried to sell it, and it did nothing but go higher as the tech buy program showed back up.
If there’s been one pattern to latch onto since the ES started going up in May, it’s either buying the lower opens or the early weakness. Whatever your view on the US stock market is, you can’t hide from the $1 trillion a year in interest on the national debt. I’m going to say we don’t need to hear from any more talking heads, we’ve heard it over and over: the US is heading into an economic crisis. And for the most part, it’s not a question of if, but when.
Our Lean
In the past, I didn’t really care what the heads of big banks or hedge funds had to say. I thought it was like listening to CNBC, with everyone going the same way. But now I wonder: how much longer can the Treasury continue the surge in spending?
Paul Tudor Jones calls the paradox an economic “kayfabe,” a term from professional wrestling. Those who know the numbers aren’t sustainable are happy to suspend disbelief while the show continues, which I can’t disagree with.
That said, the ES and NQ have continued to go up after record gains in May. Can the ES keep going up? With ES volume around 1 million contracts and considering the current uptrend, buying the early pullback has been the pattern. But I also don’t think you’re supposed to take ES 6000.00 lightly.
MiM and Daily Recap

Intraday Recap
Tuesday’s regular session opened at 5943.50 and initially dipped to 5941.75 shortly after the bell. That brief weakness was quickly reversed, sparking a steady morning rally. By 9:30 AM, the ES had already tagged 5985.25, up over 40 points from the opening dip.
A shallow pullback to 5943.50 at 9:45 AM was met with continued buying interest, and the uptrend resumed into midday. The ES reached its session high of 5991.25 at 13:21 PM, capping a 50.75-point move off the 9:33 AM higher low at 5940.50.
After topping out, the index began to fade. Sellers gained traction in the afternoon, pushing the ES down to 5968.25 by 2:09 PM—a 23.00-point decline from the high. A recovery attempt lifted it back to 5985.25 at 3:00 PM, but this lower high was followed by a weaker structure into the close.
The final hour was mostly chop in a 13-point range.
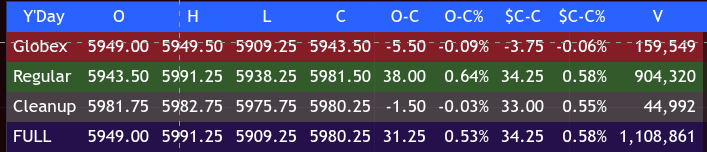
On a session basis, the regular trading hours closed at 5981.50, up 34.25 points or +0.58% from the prior day’s close. The full session—including Globex and Cleanup—settled at 5980.25, a 31.25-point gain (+0.53%). The overnight Globex low was 5909.25.
Market Tone & Notable Factors
The tone was bullish early, continuing Monday’s strength, and driven by sustained program flows. But momentum waned after midday, with the market unable to break higher beyond 5991.25. The subsequent pattern of lower highs into the close hinted at short-term exhaustion and possible distribution.
Volume reached 904,320 contracts during the regular session and 1,108,861 contracts for the full day.
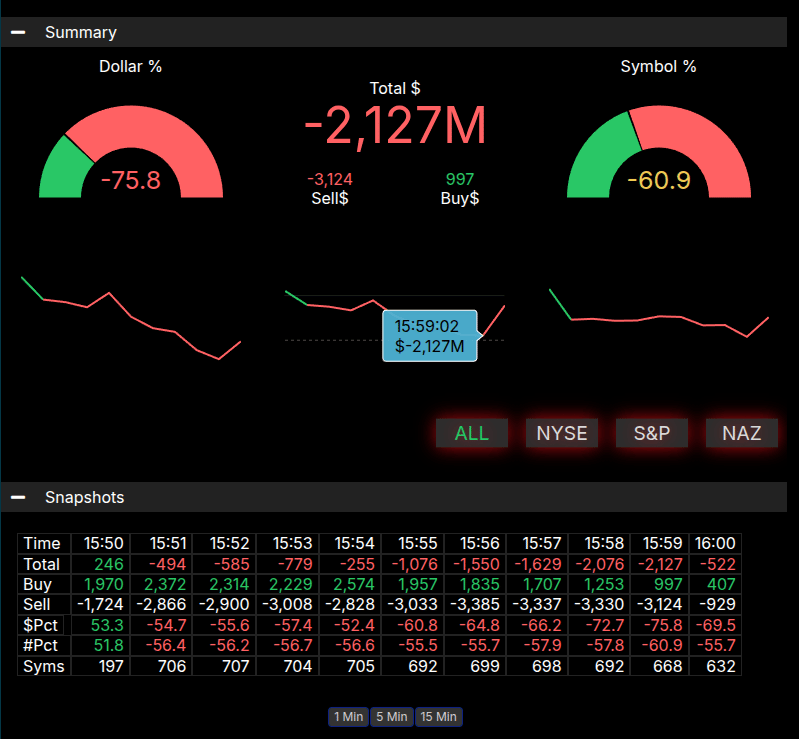
The Market-on-Close imbalance highlighted the weakness into the bell. At 3:59 PM, the MiM showed a -$2.13B net sell imbalance, with 75.8% of dollar flow on the sell side and a -60.9% symbol skew. While not exceeding the -66% threshold, the imbalance was significant and pressured prices late.
In summary, the ES posted respectable gains but stalled after an early push. With overhead resistance now established at 5991.25, the ability of buyers to hold the 5960s will likely dictate near-term direction into Wednesday.
Technical Edge
Fair Values for June 4, 2025:
-
SP: 9.44
-
NQ: 39.03
-
Dow: 57.73
Daily Market Recap 📊
-
For Tuesday, June 3, 2025
-
NYSE Breadth: 70.15% Upside Volume
-
Nasdaq Breadth: 71.34% Upside Volume
-
Total Breadth: 71.18% Upside Volume
-
NYSE Advance/Decline: 69.35% Advance
-
Nasdaq Advance/Decline: 67.65% Advance
-
Total Advance/Decline: 60.04% Advance
-
NYSE New Highs/New Lows: 81 / 31
-
Nasdaq New Highs/New Lows: 181 / 68
-
NYSE TRIN: 0.96
-
Nasdaq TRIN: 0.82
-
Weekly Market 📈
-
For week ending Friday, May 30, 2025
-
NYSE Breadth: 54.25% Upside Volume
-
Nasdaq Breadth: 58.94% Upside Volume
-
Total Breadth: 57.24% Upside Volume
-
NYSE Advance/Decline: 68.24% Advance
-
Nasdaq Advance/Decline: 59.85% Advance
-
Total Advance/Decline: 63.02% Advance
-
NYSE New Highs/New Lows: 153 / 59
-
Nasdaq New Highs/New Lows: 278 / 204
-
NYSE TRIN: 1.73
-
Nasdaq TRIN: 1.02
-
Guest Posts — Polaris Trading Group
Prior Session was Cycle Day 1: Normal CD1 as price declined during the GLOBEX establishing a new cycle low @ 5909.25.
Fantastic trading session as both upper and lower price levels outlined in prior DTS Briefing 6.3.25 were fulfilled, extending upwards to the CD1 Penetration (MA) Level 5990 handle.
Mutual Fund Monday (MFM) ignited the rally with today noted as “Continuation Tuesday” fulfilling upside range objectives. Additional upside levels target between 6003 – 6022. Range for this session was 82 handles on 1.108M contracts exchanged.
For a more detailed recap of the trading session, click on this link: Trading Room RECAP 6.3.25
FREE TRIAL link to PTG/Taylor Three Day Cycle
…Transition from Cycle Day 1 to Cycle Day 2
Transition into Cycle Day 2: Typically for CD2 we would be anticipating MATD trading range rhythms to adjust for the latest range breakout rally.
Price closed near the high of the day…As such failure to extend opens the door for a reversionary pullback to explore for renewed buyers.
We’ll be targeting the 5950 handle as a reference level of interest should a decline unfold.
Of course, nothing changes for PTG…Simply follow your plan. Take only Triple A setups and manage the $risk. ALWAYS HAVE HARD STOP-LOSSES in-place on the exchange.
PTG’s Primary Directive (PD) is to ALWAYS STAY IN ALIGNMENT with the DOMINANT FORCE.
As such, scenarios to consider for today’s trading.
Bull Scenario: Price sustains a bid above 5980+-, initially targets 5990 – 6005 zone.
Bear Scenario: Price sustains an offer below 5980+-, initially targets 5965 – 5960 zone.
PVA High Edge = 5987 PVA Low Edge = 5952 Prior POC = 5982
Thanks for reading, PTGDavid
Trading Room Summaries
Polaris Trading Group Summary – Tuesday, June 3, 2025
Yesterday was a strong trending day in the ES market, with clean technical reactions to key levels and textbook fulfillment of the PTG Daily Trade Strategy (DTS) targets. The session started with a bearish tone in the overnight session but reversed in the RTH session, favoring the bulls who maintained control throughout. Precision in target hits and alignment with dominant force principles offered excellent trading opportunities and valuable lessons.
Key Positive Trades & Highlights:
-
Overnight Bear Target Fulfilled:
The 5915 DTS lower target was hit precisely pre-market, which also aligned with the Cycle Day 1 projection (5917.50). This established a solid base for bullish scenarios. -
Reversal at Key LIS Levels:
ES rebounded from 5915 and reclaimed the 5935 Line in the Sand (LIS), turning the tide for buyers. PTGDavid emphasized that this level was critical for bulls to defend — and they did. -
Bullish Continuation Unfolds:
Once 5935 held, the session transitioned into an uptrend:-
5950 and 5955 bull targets fulfilled
-
D-Level (5967.50) and CD1 Penetration (5969.55) tagged
-
Afternoon target zone tagged precisely: 5985.25 (Money Box upper edge) and 5990.44 (Penetration MA level)
-
-
Incredible Accuracy:
PTGDavid highlighted the “sick accuracy” of the price action respecting predefined levels — a strong testament to the DTS framework’s effectiveness. -
Momentum Context:
Blibby71 and DanV added broader perspective: SPX, NQ, and QQQ all took out May highs, reinforcing macro momentum. Historical stats (since 1953) suggest strong follow-through after May strength.
Lessons Learned:
-
Stay Aligned with the Dominant Force:
The primary directive was reinforced throughout the day — when bulls control the LIS, bias should align accordingly. -
Trust the DTS Framework:
Multiple levels, from 5915 to 5990, were respected or fulfilled nearly to the tick. Following Triple A setups with proper risk management was again proven effective. -
Mindset Matters:
A great trading psychology reminder was shared via Mark Douglas’s Trading in the Zone video. Observing internal dialogue and maintaining discipline was encouraged. -
Note from David:
Narrow Open Ranges (12 handles today) often lead to Trend Day development — a lesson for anticipating price behavior early.
Market Close Summary:
-
The market closed firm, with a consistent bid throughout the day, though there were no runaway moves into the close.
-
Price is poised just below the 6003 ATR Bull Target — a key level to watch for tomorrow.
Final Note:
A disciplined, structured day with multiple technical confirmations. PTG traders who followed the plan were rewarded with clean opportunities and valuable technical and psychological reinforcement.
Quote of the Day:
“If it’s tough to buy, it’s likely going higher.” – PTGDavid
Discovery Trading Group Room Preview – Wednesday, June 4, 2025
-
Macro & Geopolitics:
-
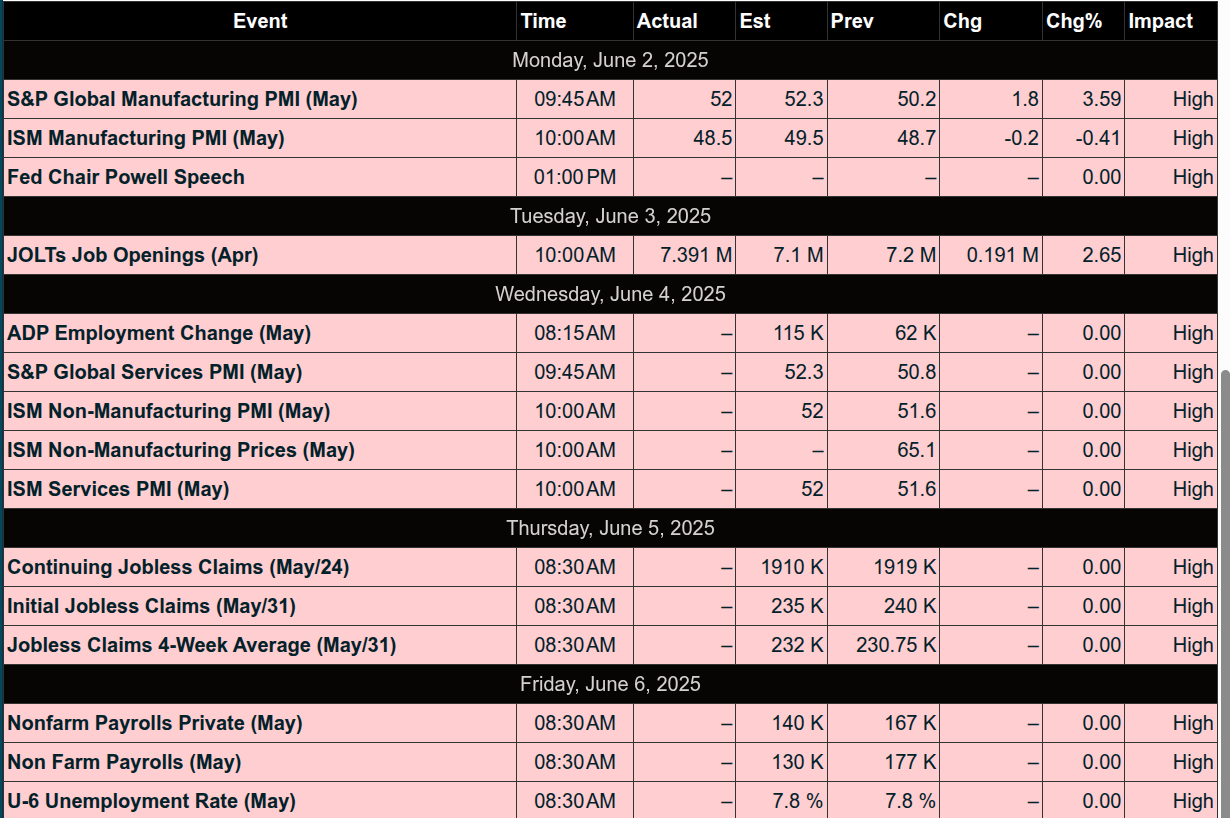
April JOLTS data surprised to the upside, signaling labor market strength despite Trump-era tariffs. This tees up Friday’s May jobs report.
-
OECD cut global economic forecasts, projecting U.S. growth slowing to 1.5% by 2026. Urges swift trade deals as Trump pushes for final offers amid looming reciprocal tariffs.
-
Trump’s social media comments on Xi Jinping spooked markets, casting doubt on near-term US-China trade progress.
-
Europe strengthens ties with China; Airbus may land a 200–500 plane order, with Macron and Merz eyeing a July visit to Beijing.
Politics & Fiscal Policy:
-
Elon Musk slammed Trump’s tax bill as a “disgusting abomination” and hinted at dialing back political donations.
-
CBO and others estimate the tax bill could add $3.3–$4T to the national debt. Senate now reviewing the House-passed legislation.
Markets & Earnings:
-
Nvidia (NVDA) surpassed Microsoft (MSFT) as the world’s most valuable company ($3.444T market cap), up 50% since April on AI server momentum.
-
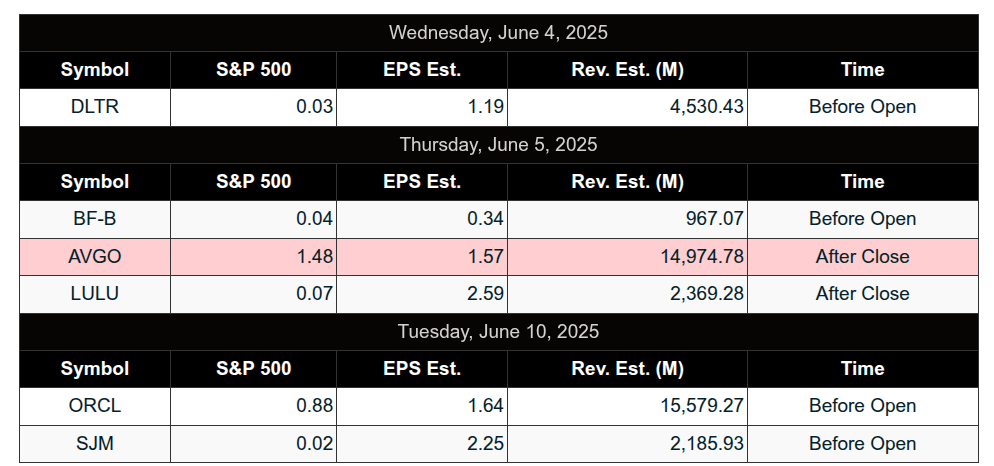
Dollar Tree (DLTR) headlines premarket earnings.
Economic Calendar:
-
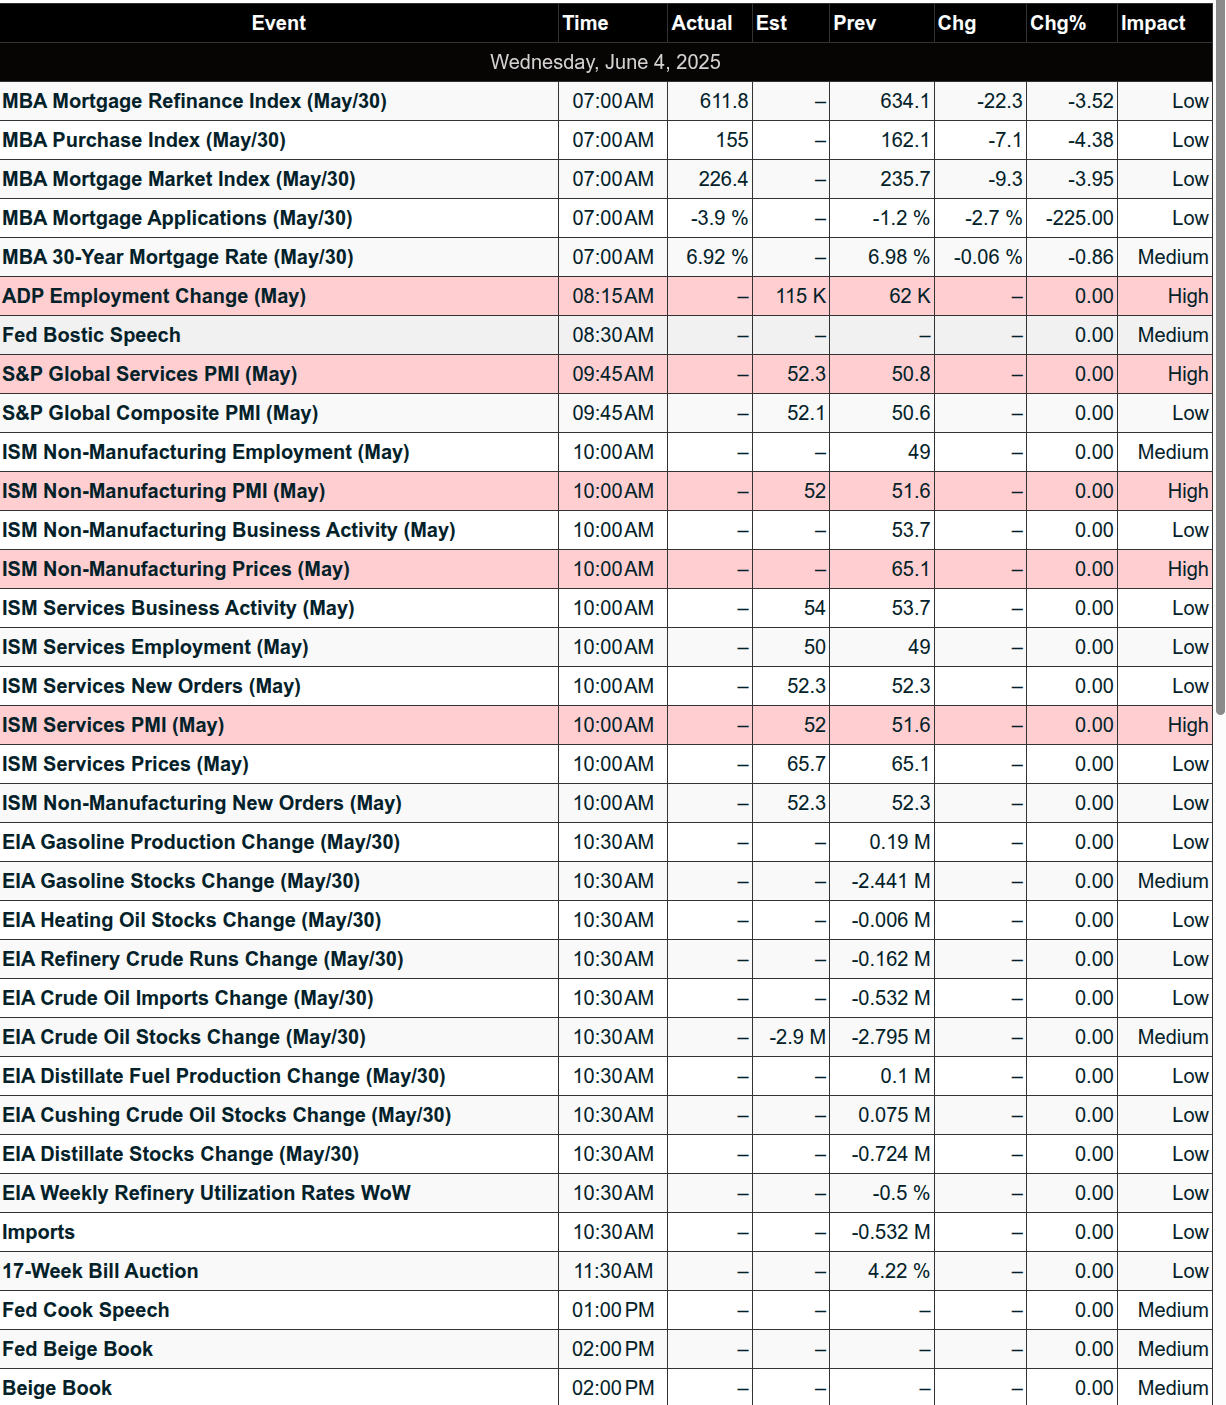
Key data today: ADP Employment (8:15am ET), ISM Services PMI (10:00am ET), Fed Beige Book (2:00pm ET).
-
Fed speakers: Bostic and Cook at 8:30am ET.
Market Technicals:
-
Volatility remains muted; ES 5-day ADR at 87.25 points.
-
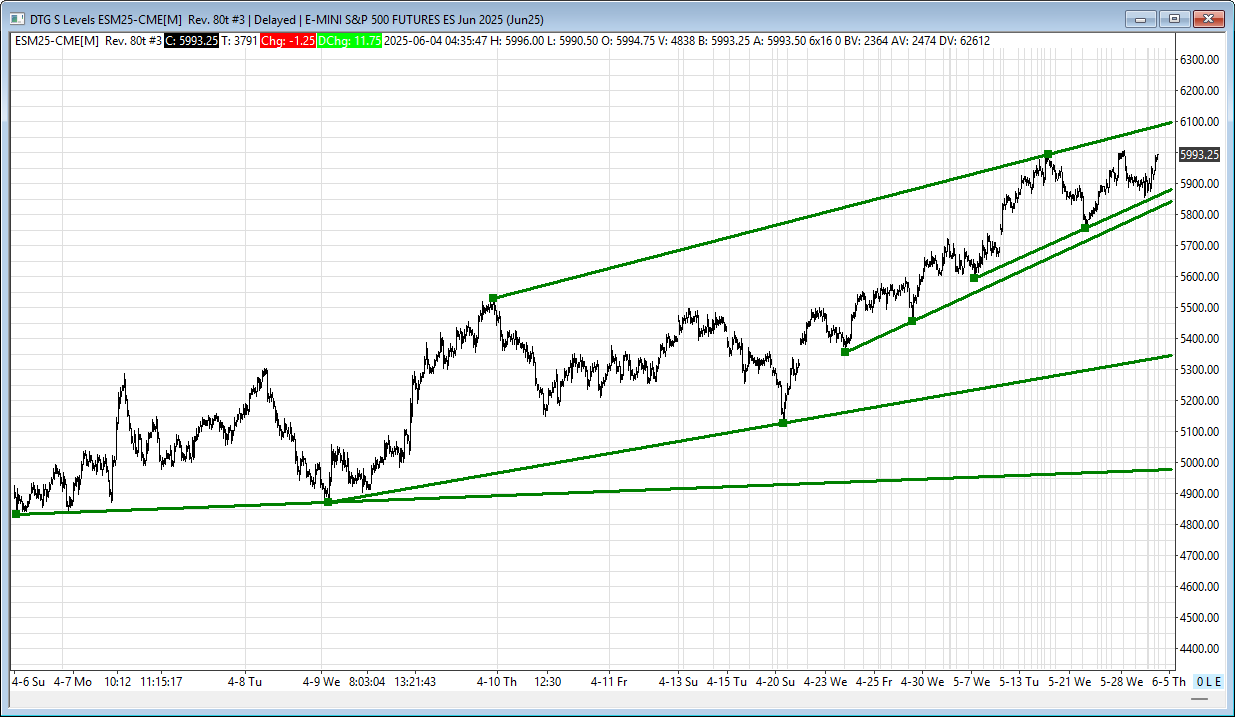
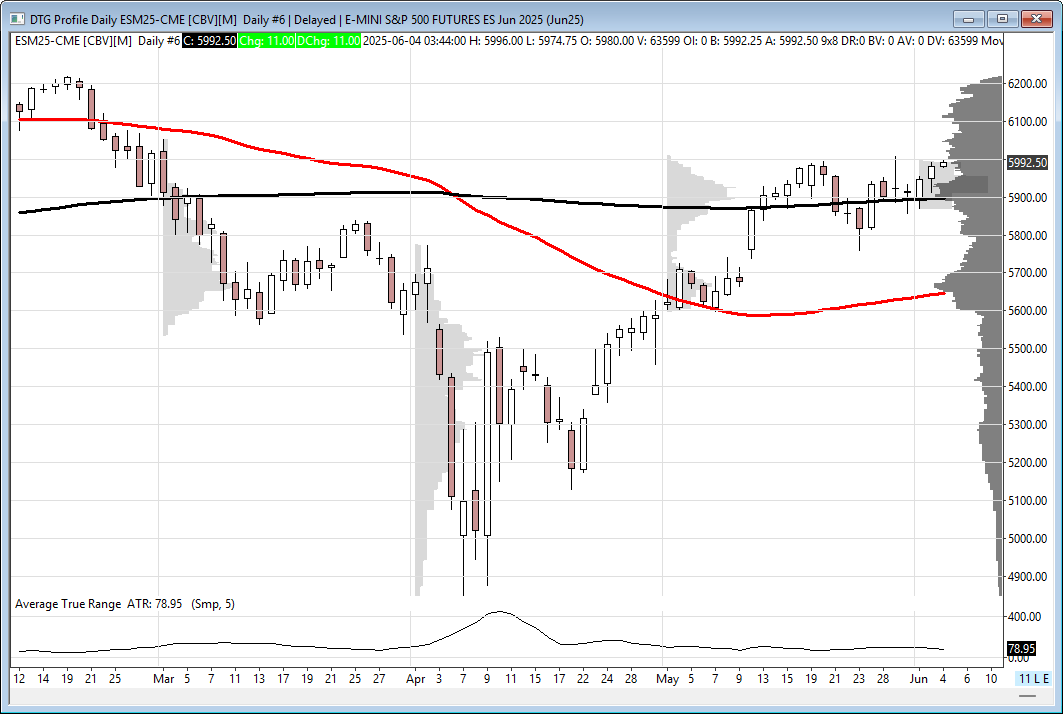
ES trades near its May high (6008) after bouncing from 200-day MA (5897.25). Key levels:
-
Resistance: 6091/94
-
Support: 5872/75, 5825/28, 5343/48, 4978/83
-
-
No large trader bias detected overnight.
-
ES
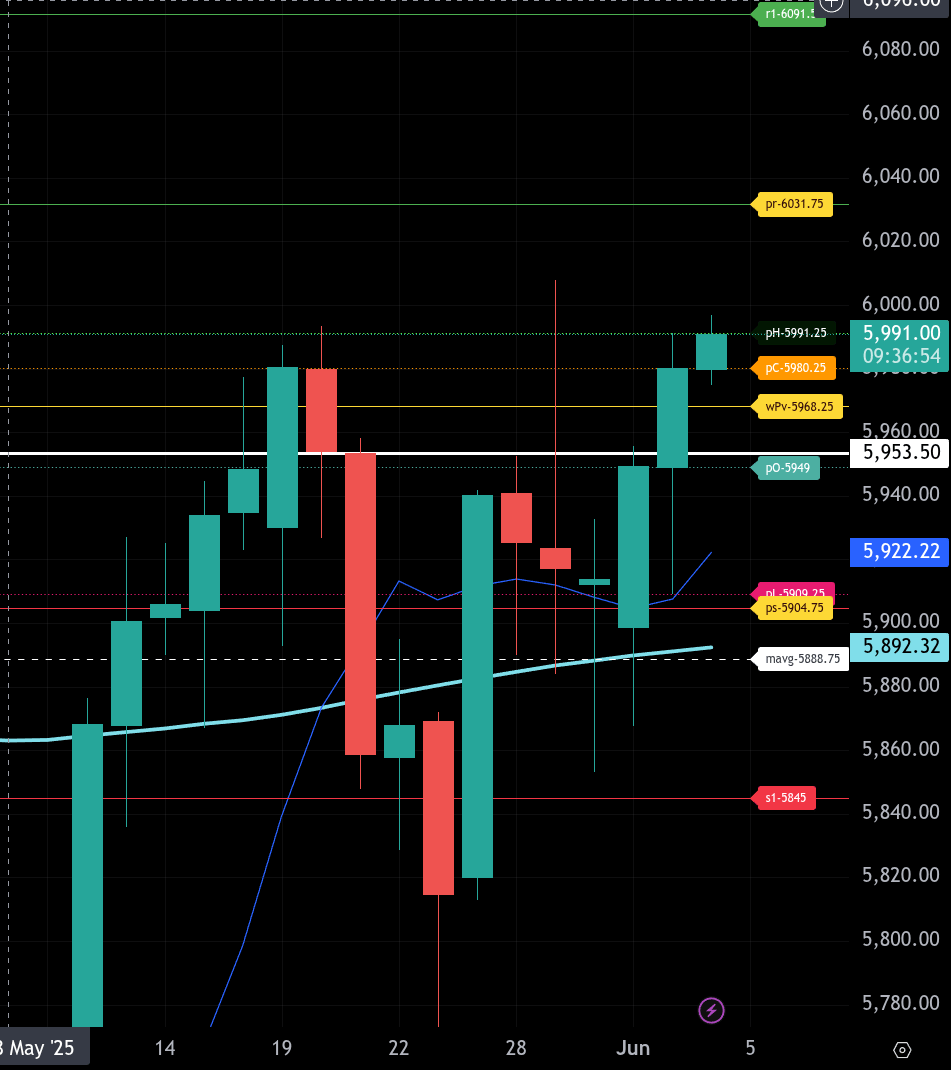
The bull/bear line for the ES is at 5968.25. This level marks the pivot that separates bullish and bearish intraday sentiment. Currently, ES is trading around 5991.00, above the bull/bear line, which gives the bulls an early edge going into the regular session.
If ES holds above 5968.25, the market has potential to continue its upward trajectory, targeting the upper intraday range level at 6031.75. Above that, additional resistance is seen at 6091.50. The high from yesterday was 5991.25, which also aligns with initial resistance—holding above it could confirm momentum.
On the downside, if ES fails to hold 5968.25, watch for a pullback to 5949 and then 5909 and the lower range target at 5904.75. Below that is support at 5888.75. If that level breaks, the next support zone is 5845.00.
The tone remains constructive above 5968.25. However, a break back below that level would shift control to the sellers, opening the path to retest downside range targets.
ES is now the proud owner of prices above 5953.50, putting our models into a longer bull trend. NQ has been there since May 19th. We now favor a longer-term basis for buying dips.
NQ
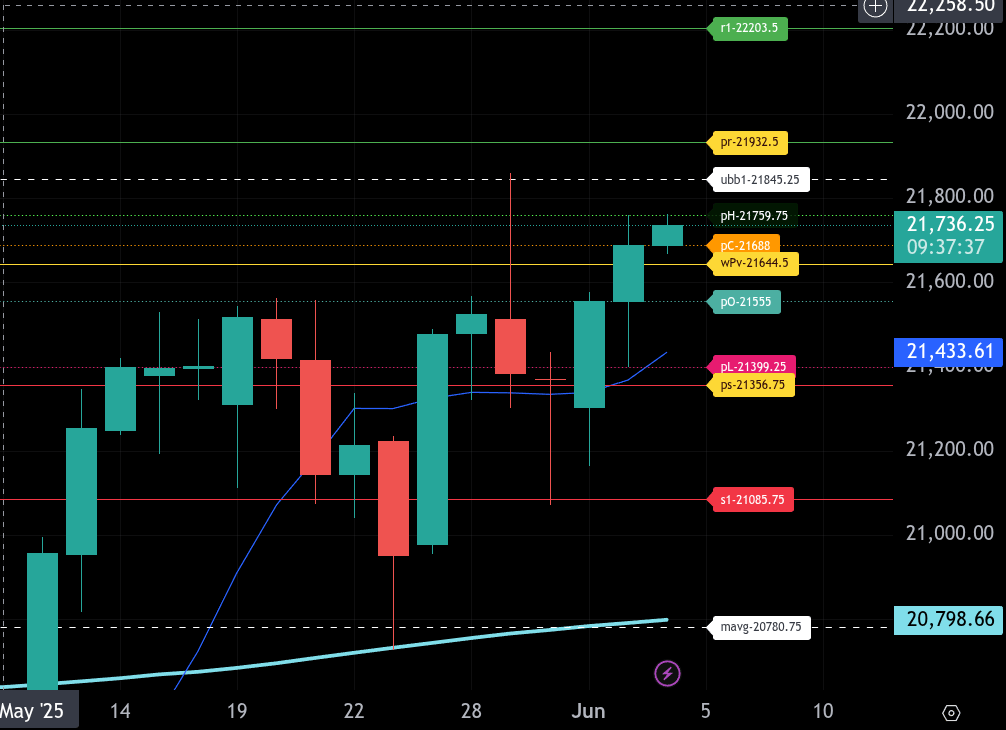
The bull/bear line for the NQ is at 21,644.50. Holding above this level favors buyers and sets the tone for continued upside exploration. A break back below would shift momentum toward sellers and call for caution.
Currently, NQ is trading around 21,738.75, comfortably above the bull/bear line. The price action overnight has pushed into prior highs, suggesting bullish control early in the session.
The upper range target for today is 21,932.50. If NQ can push through the recent overnight high of 21,759.75, this target becomes viable. Beyond that, 22,203.50 stands as the next major resistance.
On the downside, if price loses 21,644.50, we look to initial support at 21,555.00 followed by the lower range target at 21,356.75. A breach of this level opens the door to deeper support near 21,085.75.
Overhead resistance sits at 21,759.75, then 21,845.25, followed by 21,932.50. Support levels to watch below are 21,688.00, then 21,644.50, with stronger support at 21,555.00 and 21,399.25.
Trend remains bullish above 21,644.50. Watch for follow-through above 21,759.75 to confirm continuation.
Calendars
Economic
Today
Important Upcoming / Recent
Earnings
Upcoming
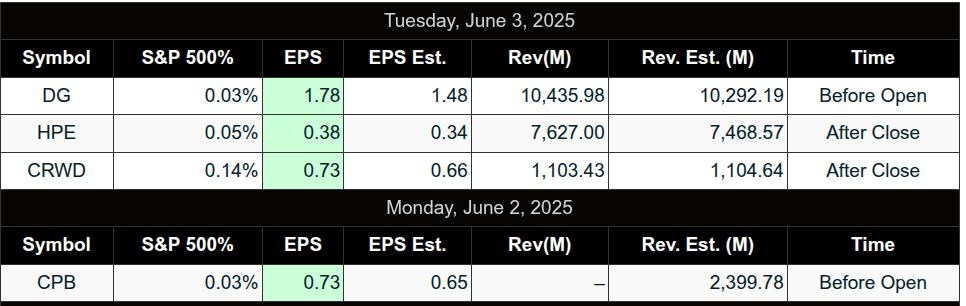
Recent
Affiliate Disclosure: This newsletter may contain affiliate links, which means we may earn a commission if you click through and make a purchase. This comes at no additional cost to you and helps us continue providing valuable content. We only recommend products or services we genuinely believe in. Thank you for your support!
Disclaimer: Charts and analysis are for discussion and education purposes only. I am not a financial advisor, do not give financial advice and am not recommending the buying or selling of any security.
Remember: Not all setups will trigger. Not all setups will be profitable. Not all setups should be taken. These are simply the setups that I have put together for years on my own and what I watch as part of my own “game plan” coming into each day. Good luck!
This post goes out as an email to our subscribers every day and is posted for free here around 2 PM ET. To get your real-time copy, sign up for the free or premium version here: Opening Print Subscribe.
Comments are closed