This post goes out as an email to our subscribers every day and is posted for free here around 2 PM ET. To get your real-time copy, sign up for the free or premium version here: Opening Print Subscribe.
Expect the Unexpected
Follow @MrTopStep on Twitter and please share if you find our work valuable!
Our View
The ES and NQ both opened low and sold off hard in the first hour of trading. The ES traded down to 5744.00, while the NQ (the weak link) made a low at 20,075.25. After hitting the lows, the ES chopped around a bit, and that’s when I put this out in the room:
See Time & Sales
IMPRO : Dboy : (11:30:50 AM) → “I got this feeling that we see a pop.”
IMPRO : Dboy : (11:31:47 AM) → “Screw some shorts, then sell ’em again.”
IMPRO : Dboy : (11:32:56 AM) → “Just seems too easy.”
IMPRO : Dboy : (11:59:33 AM) → “There she blows.”
The ES rallied 131.75 points up to 5875.75, and the NQ rallied 657.25 points up to 20,732.50. Then, at 3:39 PM, the wheels came off the wagon, and both the ES and NQ dropped like a rock. The ES sold off down to the 5810 level and then dropped further to 5769.25 down 107.50 points as the MIM came out showing $4.5 billion to sell. It sold off to 5775, and the NQ dropped to 20,324.00, a 408.25 point drop. It was clear that the imbalance had been leaked, as the market dropped sharply before 3:50 PM.
Why did I post that when the markets looked so bad? One reason was that the ES found support at 5744 (5750) and the NQ at 20,490. The other reason was that it was getting too easy to short, and it felt oversold.
After the ES rallied to the highs, I sold it several times with tight stops. When the ES sold off, I picked up 50 points it ran another 50 and that’s when I posted this:
IMPRO : Dboy : (3:55:00 PM) → “Bounce time now.”
The ES then rallied back up to 5840 (71.25 points).
#GS End-of-Day Notes (Rubner)
-
CTA volumes are large on the open and the close.
-
Buyback desk orders stop at 3:50 PM.
-
Some added hedges ahead of Trump tonight.
-
Leveraged ETF strategies act as synthetic short gamma.
-
Lots of incoming on the sell-off into the close, not many on the rally back.
We have seen some wild moves over the last three sessions—Friday’s big late rally, Monday’s big drop—but I think yesterday’s trade topped them all. I know the headlines play a big part in this, but I would say this is extreme.
I know people think Trump is crazy, but he’s a dealmaker. He got Ukraine to sign the mineral deal, and on Fox Business, there was talk that he’s going to announce easing up on Canada and Mexico tariffs, he may roll them back as early as tomorrow. Seems like The Art of the Deal means extreme market swings.
Our Lean
The PitBull thinks we rally today—I hate fading him—but even if we do, I don’t think the decline is over. I still think you have to fade the big rips, and the algos seem to agree.
There are five economic reports coming out this morning, starting with the ADP number, and no Fed speak on the schedule.
All I can say is… expect the unexpected.
From StockTraders Almanac:
Post-Election Years Plague Republicans
The fear on The Street is palpable and it’s hitting levels associated with interim lows and rebounds. We have warned all year that this type of chop and volatility is to be expected in post-election years, especially in Q1. With the S&P 500 dipping further into the red for the year, we turn to page 28 of the 2025 Stock Trader’s Almanac, “Post-Election Year Performance by Party.”
Historically, more bear markets and negative market action have plagued Republican administrations in the post-election year whereas the midterm year has been worse for Democrats. New republican administrations tend to come in and get down brass tacks more so than new democrats. This generates market uncertainty and Trump 2.0 has moved faster and further and covered more ground than any we can remember.
Join me tomorrow on my members-only webinar for a deeper dive into this phenomenon and my current outlook Not a member? Sign up today! And get a Free 2025 Stock Trader’s Almanac and much more.

MiM and Daily Recap


The ES traded lower during the Globex session, opening at 5874.00 and reaching a high of 5884.00, but ultimately drifted lower to 5812.00 before closing at 5819.00, down 55.00 points (-0.94%). The regular session followed a more volatile trajectory, starting at 5819.00 and establishing a session low of 5744.00 before rebounding.
The ES printed its first lower high at 5835.75 by 09:09 AM, marking an early decline. The market continued its downtrend, bottoming out at 5744.00 at 10:21 AM, a drop of 91.75 points (-1.57%). A bounce followed, creating a lower high at 5782.75 (10:33 AM) before pulling back again.
Momentum shifted mid-session, with an extended rally pushing the ES to a new high of 5807.25 (12:27 PM), a 62.50-point gain (1.09%) from the preceding low. A brief consolidation brought a 26.25-point pullback (-0.45%) at 12:51 PM, before another strong leg higher.
The bullish continuation pushed the ES to 5875.75 (15:24 PM), marking the day’s highest print. However, the market swiftly retraced into the close, dropping 107.50 points (-1.83%) to 5768.25 at 15:51 PM. A final recovery attempt lifted the index back to 5840.00 at 16:24 PM, but the session ultimately ended in negative territory.
The overall tone of the market was mixed, with strong intra-day volatility. The deep morning pullback (-1.57%) was met with aggressive buying, but the later-day surge to new highs was undone by an equally aggressive selloff into the close. The regular session closed at 5790.75, down 72.00 points (-1.23%) from the prior day’s close.
In the end, traders saw both strong downside and upside momentum, making it a day of tactical reversals rather than trend continuation. Expect more volatility in the sessions ahead. Total volume for the full session came in at 3,241,741 contracts, reflecting heightened participation and increased volatility throughout the trading day.
Technical Edge
MrTopStep Levels:

Fair Values for March 5, 2025:
-
SP: 9.84
-
NQ: 37.11
-
Dow: 64.05
Daily Market Recap 📊
-
NYSE Breadth: 23% Upside Volume
-
Nasdaq Breadth: 51% Upside Volume
-
Total Breadth: 47% Upside Volume
-
NYSE Advance/Decline: 23% Advance
-
Nasdaq Advance/Decline: 39% Advance
-
Total Advance/Decline: 33% Advance
-
NYSE New Highs/New Lows: 42 / 289
-
Nasdaq New Highs/New Lows: 59 / 688
-
NYSE TRIN: 0.84
-
Nasdaq TRIN: 0.61
Weekly Market 📈
-
NYSE Breadth: 50% Upside Volume
-
Nasdaq Breadth: 44% Upside Volume
-
Total Breadth: 47% Upside Volume
-
NYSE Advance/Decline: 52% Advance
-
Nasdaq Advance/Decline: 35% Advance
-
Total Advance/Decline: 41% Advance
-
NYSE New Highs/New Lows: 119 / 232
-
Nasdaq New Highs/New Lows: 213 / 680
-
NYSE TRIN: 1.00
-
Nasdaq TRIN: 1.23
Guest Posts — Polaris Trading Group
Prior Session was Cycle Day 3: Positive 3-Day Cycle (91%) secured, although it occurred during a late day rally, following a morning of aggressive long liquidation. Albeit not the strongest of cycles as the current broader bias remains negative. Range for this session was 140 handles on 3.241M contracts exchanged.
FREE TRIAL link to PTG/Taylor Three Day Cycle
For a more detailed recap of the trading session, click on this link: Trading Room RECAP 3.4.25
…Transition from Cycle Day 3 to Cycle Day 1
Transition into Cycle Day 1: Price has already fulfilled the historical max average decline (5763.50) during the previous high-volatility session. Further weakness may unfold, though since the targeted decline was exceeded, the next rally may begin at any time.
Risk Meter is pegged to Maximum, so expectation is for continued wide ranging intra-day swings, so extra caution is warranted.
Of course, nothing changes for PTG…Simply follow your plan. Take only Triple A setups and manage the $risk. ALWAYS HAVE HARD STOP-LOSSES in-place on the exchange.
PTG’s Primary Directive (PD) is to ALWAYS STAY IN ALIGNMENT with the DOMINANT FORCE.
As such, scenarios to consider for today’s trading.
Bull Scenario: Price sustains a bid above 5820+-, initially targets 5855 – 5870 zone.
Bear Scenario: Price sustains an offer below 5820+-, initially targets 5790 – 5775 zone.
PVA High Edge = 5825 PVA Low Edge = 5757 Prior POC = 5791
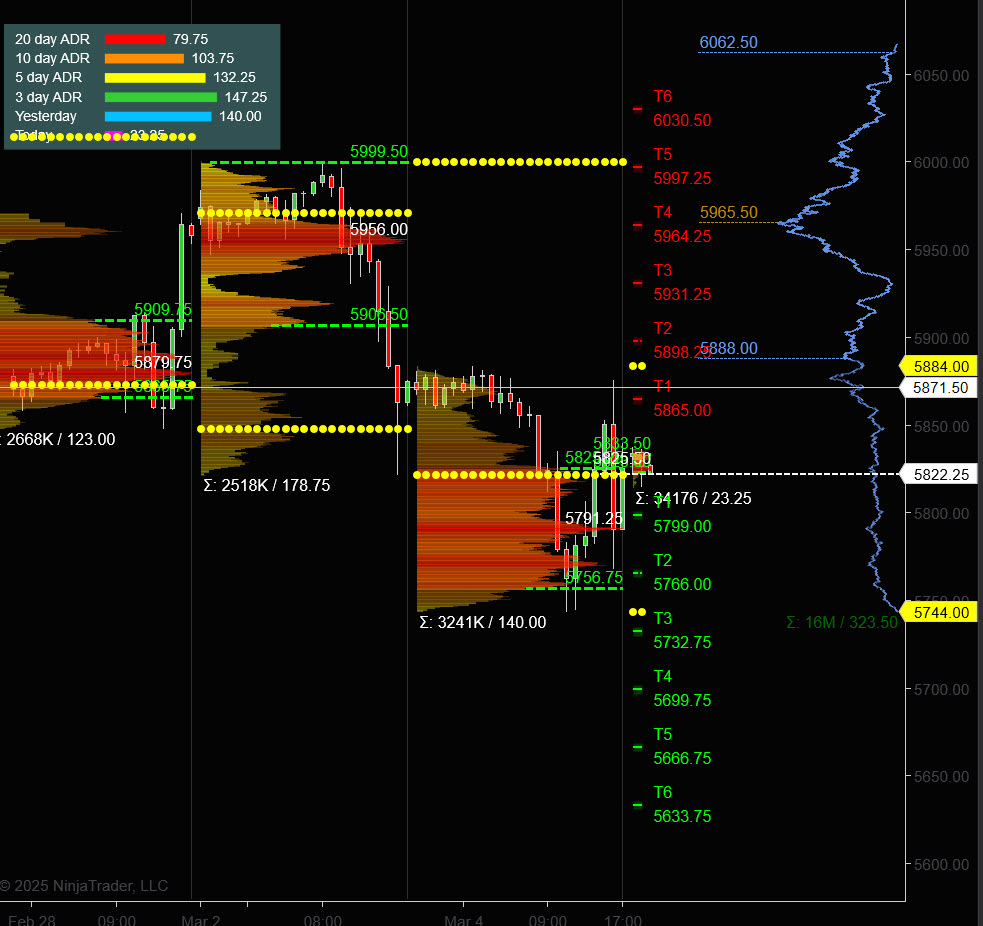
ES (Profile)
Thanks for reading, PTGDavid
Economic Calendar
Trading Room Summaries
Polaris Trading Group Summary – Tuesday, March 4, 2025
The trading day was characterized by volatility, strategic long and short opportunities, and an end-of-day rug pull that provided a dramatic close.
Morning Session: Early Setups & Bullish Responses
-
The day opened with a bearish lean below the Primary Level (PL) and Open Range, requiring a shift in structure for bulls to gain control.
-
The first A10 Long trade hit its targets early, setting a positive tone.
-
Crude Oil (CL) Open Range Short hit its first target at 67.12.
-
There was significant two-way traffic, with bulls defending key levels.
-
The 5750 level on ES became a crucial support, with multiple tests and strong buy responses.
Midday: European Close & Bullish Breakout
-
The European session closed with a sharp sell-off, which turned into a bargain-basement buying opportunity for bulls.
-
The target zone of 5780-85 was reached, solidifying the bullish case.
-
The 3-Day Cycle Statistics were satisfied, reinforcing the bullish trend.
-
Lunch break commenced with bulls maintaining control and dip-buying opportunities being favored.
Afternoon Session: Squeeze & Rug Pull Finale
-
A short squeeze kicked in, driving prices higher as bulls took control.
-
The 3-Day Cycle Statistic remained intact, further supporting bullish momentum.
-
Power Hour initiated a strong push, squeezing shorts before the market reversed.
-
Final hour saw an aggressive sell-off (Rug Pull), with a $4.4B Market on Close (MOC) sell imbalance fueling the drop.
-
The day closed with a reminder of volatility’s presence in futures trading.
Key Lessons & Takeaways
-
Recognizing key levels (5750 & 5780-85) was crucial for trade execution.
-
Opportunistic buying after sharp drops (European close) proved profitable.
-
The market can shift quickly – squeezing shorts before an aggressive sell-off.
-
Understanding Market on Close imbalances can provide an edge.
-
Volatility remains high—adaptability is key.
Discovery Trading Group Room Preview – Wednesday, March 5, 2025
-
Market Selloff Deepens
The S&P 500 followed the Nasdaq in erasing post-election gains, with high volatility continuing amid escalating tariff tensions. The latest tariffs on Mexico, Canada, and China fueled the market downturn. Commerce Secretary Lutnick hinted at possible tariff relief, but Trump’s address to Congress reaffirmed his commitment to tariffs, dismissed concerns about market turbulence, and vowed to end Biden’s chip subsidy law.🔹 Market Performance & Sector Moves
-
The S&P 500 has shed $3.3 trillion in market cap in under two weeks, now down ~2% in 2025.
-
The Nasdaq is down 5% YTD, while the Dow Jones hovers near breakeven.
-
The Russell 2000, which initially surged post-election, is now down 8% since Nov. 5.
-
Tesla (TSLA) has been hit hard, falling over 30% in 2025 on declining sales.
-
International defense stocks (Germany, South Korea, Japan) have soared 100%+ in recent months, driven by Trump’s pause on Ukraine military aid.
🔹 Key Technical Levels & Volatility Outlook
-
S&P 500 E-mini Futures (ES) remain in a short-term downtrend, closing below its 200-day MA (5848.25). Bears now have significant room to operate.
-
Resistance levels: 5973/68s, 6161/58s
-
Support levels: 5736/33s, 5657/54s, 5609/04s
-
Volatility remains elevated, with the 5-day average daily range exceeding 132 points.
-
Whale traders show a slight bearish bias ahead of the 8:15 AM ET ADP report.
🔹 Earnings & Economic Data Watchlist
-
Earnings Premarket: YMM, YPF
-
Earnings After the Bell: ARCC, MRVL, MDB, VEEV, ZS
-
Economic Calendar Highlights:
-
ADP Employment Report (8:15 AM ET)
-
S&P Global Services PMI (9:45 AM ET)
-
ISM Services PMI & Factory Orders (10:00 AM ET)
-
Crude Oil Inventories (10:30 AM ET)
-
Fed Beige Book (2:00 PM ET)
-
🔹 Bottom Line
Markets remain highly volatile as tariff concerns overshadow expectations of tax cuts and deregulation under the Trump administration. Traders should watch for further reactions to today’s economic data and earnings releases, with a focus on whether the S&P 500 can reclaim its 200-day moving average or if sellers continue to dominate.

-
ES -Week to Week


The intraday bull/bear line for ES today is at 5790. Holding above this level could provide buyers with momentum toward 5844 and 5898.50 (our range high target for the day), with a potential push to 5911.50 as the upper-range target. If bullish momentum strengthens further, a move toward 5991.75 is our extended upper target today.
If sellers regain control below 5790, expect a test of 5744, which aligns with the lower boundary of the current structure. A breakdown below this level could open the door to 5700.25 our range low target. Further weakness might bring the market toward 5606.75, with 5550 acting as a key support level below.
The bear/bull longer-term trend remains bearish as the market continues to sell off after rejecting higher levels. Prices need to print above 6062.50 to turn us into a bullish long-term trend.
NQ – Week to Week


The bull/bear line for NQ today is at 20,400.95. This level determines the directional bias—trading above it leans bullish, while staying below it suggests continued weakness.
Currently, NQ is trading near 20,502, hovering close to this key level. If buyers can hold above 20,527, we may see a push towards 20,732.5 and further into the 20,839.75 resistance our range high area for the day. A break beyond that could test 21,308.
However, if NQ fails to hold 20,400.95, expect pressure towards 20,203, followed by 20,075.25. A deeper decline could target 19,933.75 which is our range low target on the day.
We remain in a longer trend bearish mode with prices needing to move above 21,681 to change that around.
Calendars
Today

Important Upcoming

Earnings


Affiliate Disclosure: This newsletter may contain affiliate links, which means we may earn a commission if you click through and make a purchase. This comes at no additional cost to you and helps us continue providing valuable content. We only recommend products or services we genuinely believe in. Thank you for your support!
Disclaimer: Charts and analysis are for discussion and education purposes only. I am not a financial advisor, do not give financial advice and am not recommending the buying or selling of any security.
Remember: Not all setups will trigger. Not all setups will be profitable. Not all setups should be taken. These are simply the setups that I have put together for years on my own and what I watch as part of my own “game plan” coming into each day. Good luck!
This post goes out as an email to our subscribers every day and is posted for free here around 2 PM ET. To get your real-time copy, sign up for the free or premium version here: Opening Print Subscribe.
Comments are closed