This post goes out as an email to our subscribers every day and is posted for free here around 2 PM ET. To get your real-time copy, sign up for the free or premium version here: Opening Print Subscribe.
Fed Rate Decision Day: The Eye Of The Storm
Follow @MrTopStep on Twitter and please share if you find our work valuable!
FREE Two-Week Offer for the Opening Print Premium. Open up the Lean and other premium features for the next Two Weeks!
Our View
I have to be honest—there are days to trade and days not to trade, and the last two days have definitely been the latter. In the future, I am going to cut way back or not trade at all during the two-day Fed meetings.
As you all know, I don’t mind writing a big report, but I don’t think there’s anything I can say that hasn’t already been said. The markets are in a state of flux. One thing that is concerning is the yield on the 10-year note, which closed at 4.185%, the highest end-of-day level since September.
According to The Wall Street Journal, the dot plot will be the main event: markets expect 14–16 of the 19 dots to cluster at 3.50% or lower for end-2025 (consistent with three total cuts this year), but a much wider 2026 spread, with only 5–7 dots currently penciling in any additional easing, and several likely showing no cuts at all. This dispersion is something the Journal frequently describes as a “barometer of Fed fractures,” especially if hawkish outliers from Dallas or Cleveland pull the median higher while dovish San Francisco or Minneapolis dots stay aggressively low.
In its broader coverage, the Journal has emphasized that the SEP bridges Powell’s “data-dependent” language with hard numbers. So a hawkish tilt—particularly an upward nudge to the longer-run neutral rate toward 3.0%—would reinforce the paper’s narrative of elevated rates persisting, putting renewed pressure on bonds and the dollar. On the other hand, a dovish surprise (such as a clear median for two 2026 cuts) could ignite “soft-landing euphoria” and extend the 2025 equity rally.
If there was any standout, it was Bitcoin. It surged as the Fed policy reignited risk flows back into crypto/Bitcoin. MicroStrategy added $963 million, lifting the company’s total holdings to over 273,000 BTC, valued at more than $25 billion.
Our View
I don’t know if this will be the case today, but in most cases, the index markets don’t move very much until after 1:00 p.m.
There was a story that came out last night: Kevin Hassett, National Economic Council Director and leading candidate to succeed Jerome Powell as Federal Reserve Chair in May 2026, stated at a Wall Street Journal CEO Council event that he would rely solely on his own independent judgment and data—not external pressure—when deciding interest rates. He said there is currently “plenty of room” to cut rates, potentially by more than the 25 basis points expected at Wednesday’s FOMC meeting, and emphasized he would resist easing if inflation rose sharply from 2.5% to 4%.
Hassett stressed a “firm commitment to not being partisan” and to always “do the right thing,” underscoring his intention to preserve the Fed’s independence while signaling notable dovish flexibility.
Our Lean
I think I’ve been OK on my directional calls, and I told people not to get long above 6900 last Friday.
In all honesty, I don’t know how the rate cut will affect the ES and NQ today, but like I said yesterday, I think it’s all going to come down to Powell’s 2:30 ET press conference.
Market Recap
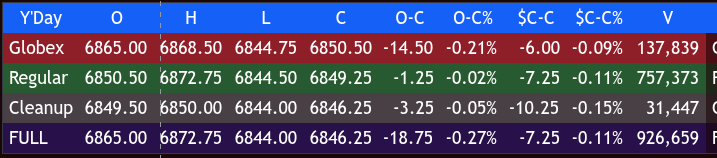
The ES traded up to 6868.50 on Globex and opened Tuesday’s regular session at 6850.50, down 6 points or -0.09%.
After the open, the ES traded down to 6847.25, then rallied back up to the Globex high at 6868.50 at 10:00. It pulled back to 6854.50 at 10:45, traded up to a new high at 6873.00 at 11:35, and then sold off down to 6855.00 at 12:50.
From there, it traded up to 6864.00, sold off down to 6852.50 at 1:55, drifted down to 6850.50 at 2:40, rallied up to 6857.50 at 3:00, traded 6851.50 at 3:25, then traded down to 6845.75.
It traded 6852.50 as the 3:50 cash imbalance showed $2.2 billion to buy, then sold off down to 6844.50 at 3:55 and traded 6849.25 on the 4:00 cash close. After 4:00, the ES traded down to the RTH low at 6844.50 and settled the full session at 6846.25, down 7.25 points or -0.11% from yesterdays full close and down -18.75 from today’s open.
The NQ settled at 25,699.75, up 35.75 points or +0.14%.
In the end, it was a mindless day of trading—chop up, then chop down.
In terms of the ES’s overall tone, the early rally was a sale. In terms of the ES’s overall trade, volume was higher than expected at 1.257 million contracts traded.
Guest Posts

S&P 500 (ES)
Prior Session was Cycle Day 1: Hotdog Day
“Buy ’em cheap… if you’ve got the courage.”
Today’s tape was the definition of Hotdog Day — mustard-ready but no real meat — as traders collectively held their breath waiting for tomorrow’s FOMC fireworks. But even in the lull, Cycle Day 1 played its rhythms with textbook precision.
Cycle day 1 Low…6844.00
For greater detail of how this day unfolded, click on the Trading Room RECAP 12.9.25 link.
…Transition from Cycle Day 1 to Cycle Day 2
Transition into Cycle Day 2: The Fed’s Grand Finale – Wild-Card Edition
The curtain has officially lifted on the Federal Reserve’s last performance of 2025, and the crowd is already pricing in an 88.6% chance of a 25 bps rate cut—a consensus so lopsided it practically screams, “Don’t screw this up, Jerome… or whoever’s about to take your chair.”
But make no mistake, this is no ordinary FOMC.
Not when:
-
The dot plot is about to tell on everyone,
-
Forward guidance could tilt the entire 2026 playbook, and
-
The list of candidates to replace JPOW has been trimmed down to a handful of brave souls willing to inherit this monetary circus.
That’s right—call it what it is:
⭐ A full-blown Wild-Card Meeting. ⭐
Markets will hang on every syllable.
Every eyebrow twitch in the presser.
Every hint the dots shift from “steady glide path” to “we’re winging it like the rest of you.”
For traders, this means a familiar battle plan:
Expect volatility. Respect the levels. Stay nimble.
The real move is often post-presser, when the algo mêlée cools and the humans regain custody of the charts.
Strap in.
Fed Day isn’t just a macro event—it’s a liquidity-powered storyline with plot twists they definitely didn’t teach in Economics 101.
Key Links:
Of course, nothing changes for PTG…Simply follow your plan. Take only Triple A setups and manage the $risk. ALWAYS HAVE HARD STOP-LOSSES in-place on the exchange.
PTG’s Primary Directive (PD) is to ALWAYS STAY IN ALIGNMENT with the DOMINANT FORCE.
As such, scenarios to consider for today’s trading.
Bull Scenario: Price sustains a bid above 6845+-, initially targets 6860 – 6865 zone.
Bear Scenario: Price sustains an offer below 6845+-, initially targets 6835 – 6830 zone.
PVA High Edge = 6865 PVA Low Edge = 6850 Prior POC = 6860
/
ESZ
Thanks for reading, PTGDavid
MiM
MOC Recap
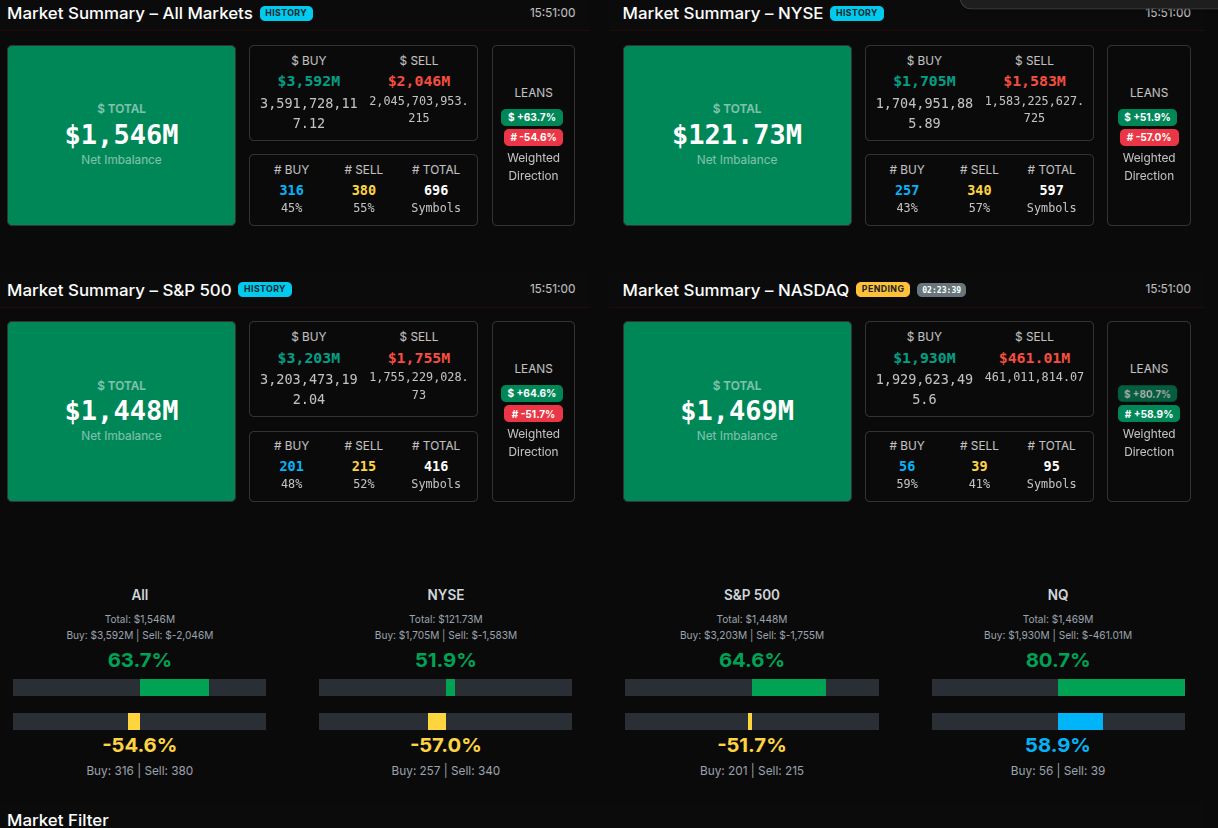
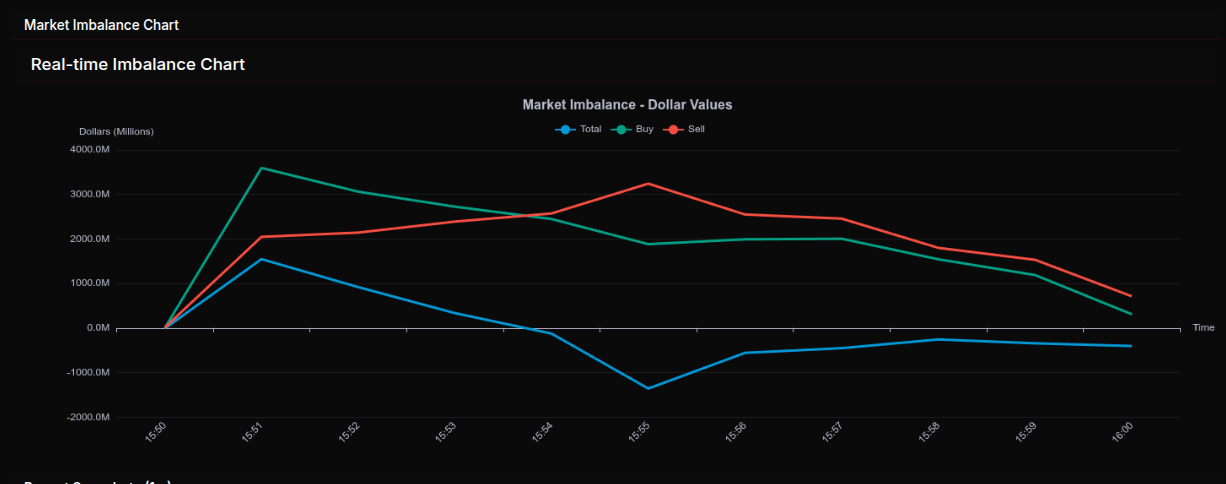
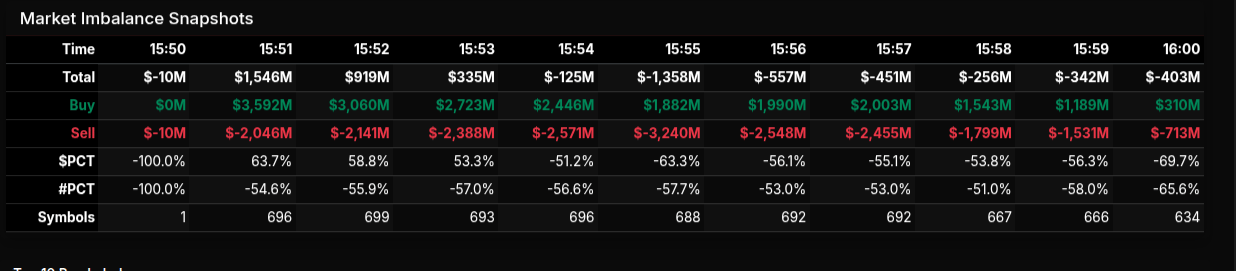
The 15:51 read opened with a strong $1.55B buy imbalance, driven by a surge of buy programs that briefly overwhelmed the sell side. Buy interest peaked immediately at $3.59B, while sells sat at $2.05B, giving the tape a decisive early buy lean. However, this strength proved fleeting. From 15:52 forward, the buy side bled lower while sell pressure persisted, pulling the total imbalance down from $919M to –$1.36B by 15:55. That pivot marked the transition: the auction shifted from buy-dominated to sell-controlled. A mild buy attempt resurfaced at 15:56–15:57 ($1.99B → $2.00B buys), but heavy sell interest kept the net negative all the way into the close. By 16:00, the MOC settled at –$403M, confirming a sell-side finish.
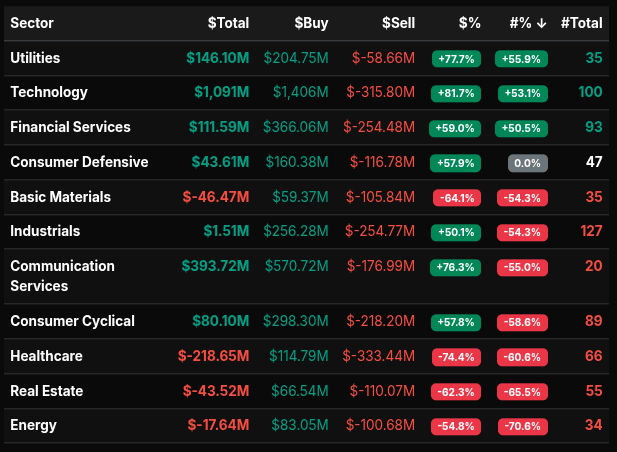
Sector flows showed meaningful divergence. Utilities (+77.7% / +55.9% symbol%), Technology (+81.7% / +53.1%), Financial Services (+59.0%), and Communication Services (+76.3%) carried the largest rotation toward buyers. These were wholesale-lean categories, with Tech especially notable given its 100-symbol participation. On the other side, Healthcare (–74.4% / –60.6%), Energy (–54.8% / –70.6%), Real Estate (–62.3% / –65.5%), and Basic Materials (–64.1% / –54.3%) showed concentrated sell programs. Healthcare and Energy, both below –66%, were clear liquidation sectors.
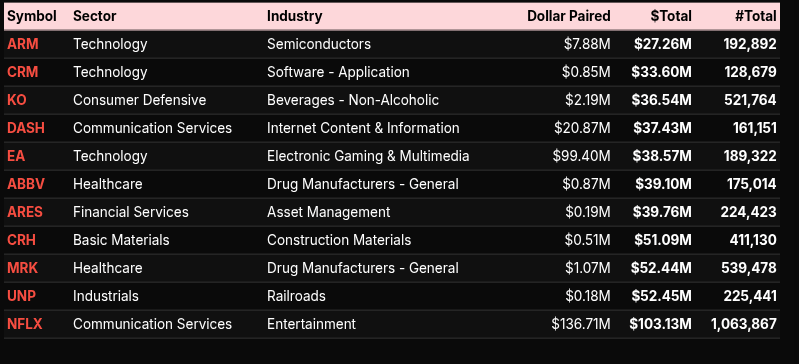
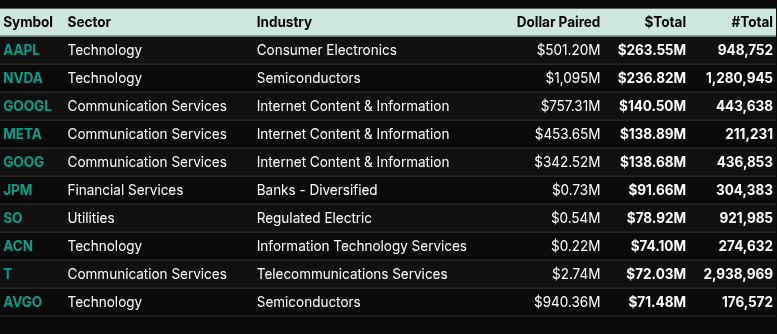
Symbol-level flows echoed this. The heaviest dollar buyers included AAPL ($263.6M), NVDA ($236.8M), GOOGL/META/GOOG (~$138–$140M each), JPM, and AVGO, showing deep institutional support in mega-cap Tech and key financials. On the paired-flow list, NFLX ($103M) and CRH/MRK/UNP ($50M+) showed sizable rotational flows. On the sell-lean side, Healthcare names (ABBV, MRK) and Energy components were consistently net-sold.
Overall, the MOC auction began with an aggressive buy surge, transitioned into a strong mid-auction unwind led by Healthcare/Energy selling, and closed negative after failing to reclaim buy momentum into 16:00.
Technical Edge
Fair Values for December 10, 2025:
-
SP: 6.6
-
NQ: 29.31
-
Dow: 47.67
Daily Market Recap 📊
For Tuesday, December 9, 2025
• NYSE Breadth: 52.3% Upside Volume
• Nasdaq Breadth: 60.4% Upside Volume
• Total Breadth: 59.3% Upside Volume
• NYSE Advance/Decline: 54.7% Advance
• Nasdaq Advance/Decline: 55.9% Advance
• Total Advance/Decline: 55.4% Advance
• NYSE New Highs/New Lows: 88 / 27
• Nasdaq New Highs/New Lows: 154 / 100
• NYSE TRIN: 1.03
• Nasdaq TRIN: 0.81
Weekly Market 📈
For the week ending Friday, December 5, 2025
• NYSE Breadth: 50.5% Upside Volume
• Nasdaq Breadth: 53.6% Upside Volume
• Total Breadth: 52.5% Upside Volume
• NYSE Advance/Decline: 48.5% Advance
• Nasdaq Advance/Decline: 52.4% Advance
• Total Advance/Decline: 51.0% Advance
• NYSE New Highs/New Lows: 273 / 72
• Nasdaq New Highs/New Lows: 441 / 297
• NYSE TRIN: 0.90
• Nasdaq TRIN: 0.93
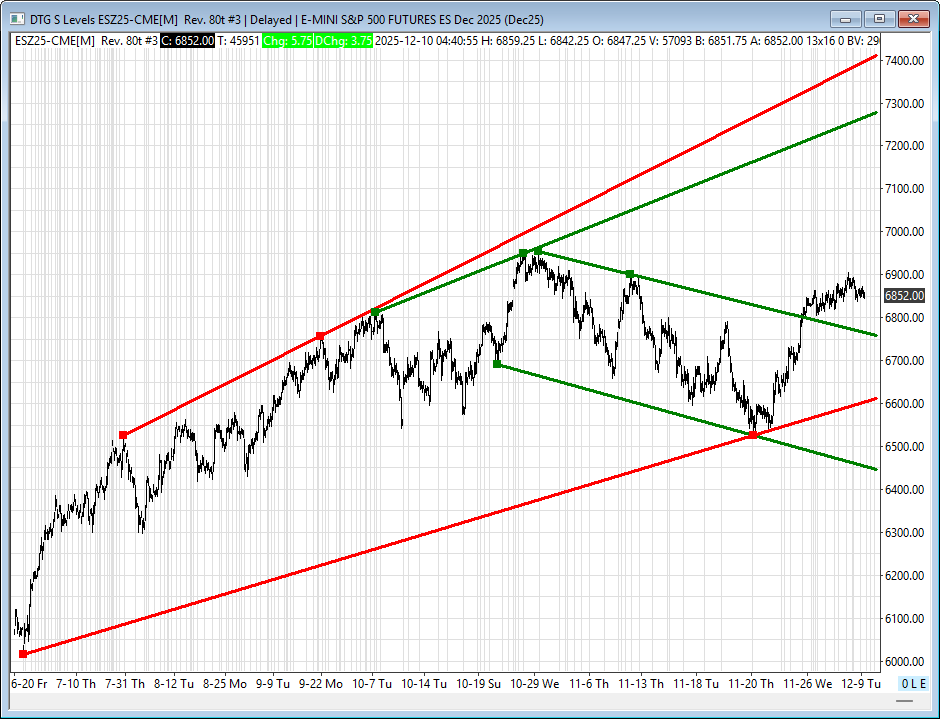
ES Levels
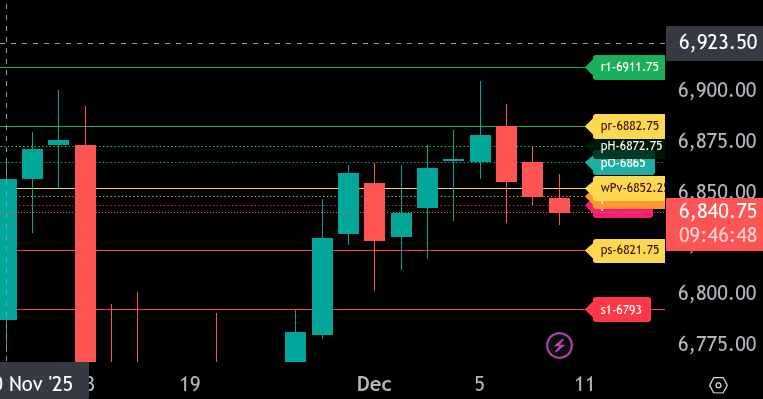
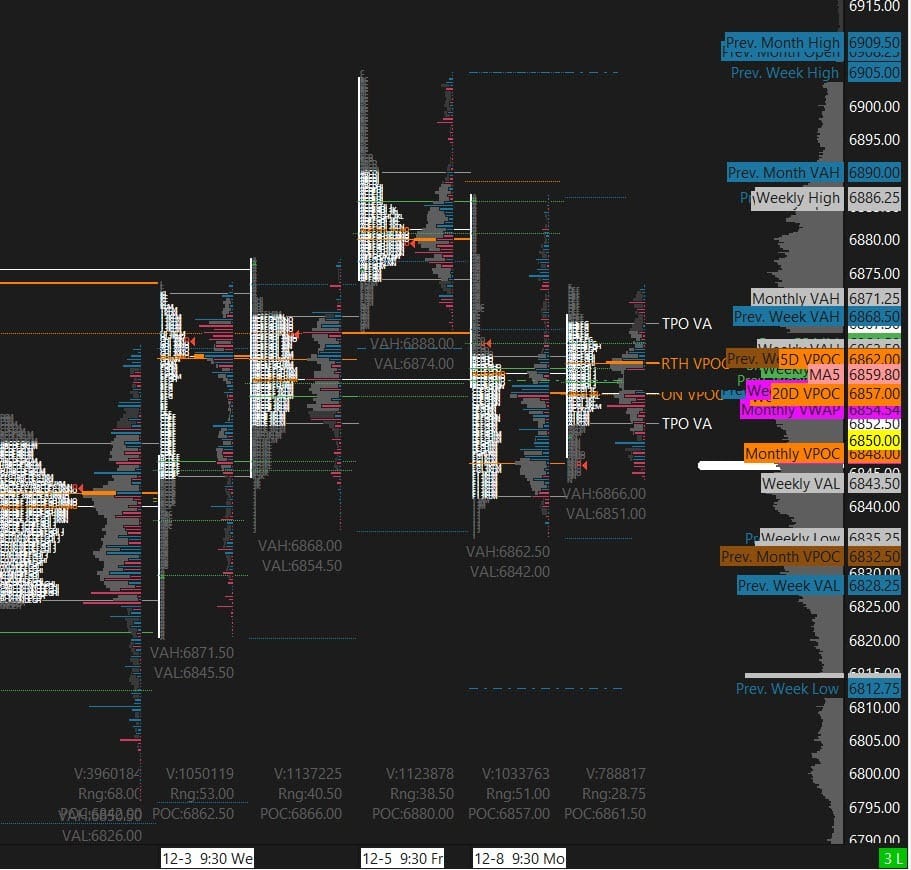
The bull/bear line for ES is at 6852.25. ES is trading below this level near 6841.00, keeping momentum pressured unless it can reclaim 6852.25.
The upper range target is 6882.75. The lower range target is 6821.75.
Resistance levels sit at 6865, 6872.75, and 6911.75. A push through 6852.25 opens the path toward 6865 and 6882.75.
Support levels sit at 6848.25, 6844, 6821.75, and deeper support at 6793. Holding above 6821.75 is key to preventing a slide toward 6793.
Below 6852.25, bias remains soft. Reclaiming the bull/bear line would shift intraday tone upward toward the upper range target.
NQ Levels
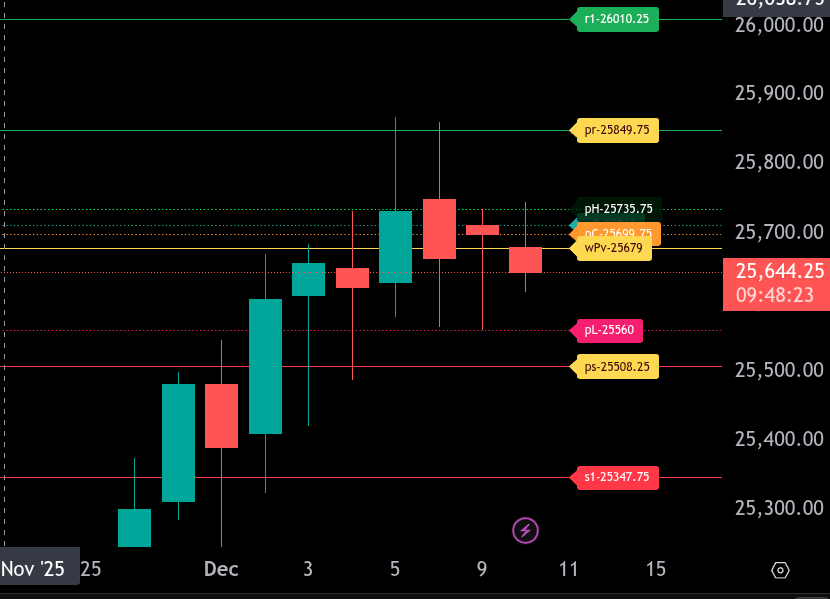
The bull/bear line for the NQ is at 25,679.00. NQ is trading below this level near 25,644.00 during Globex, keeping momentum pressured unless price can reclaim 25,679.00.
The upper range target is 25,849.75. The lower range target is 25,508.25.
Resistance levels sit at 25,713.00, 25,735.75, and 26,010.25. A push through 25,679.00 opens the path toward 25,713.00 and then 25,849.75.
Support levels sit at 25,560.00, 25,508.25, and deeper support at 25,347.75. Holding above 25,508.25 is key to preventing a slide toward 25,347.75.
Below 25,679.00, bias remains soft. Reclaiming the bull/bear line would shift intraday tone upward toward the upper range target.
Calendars
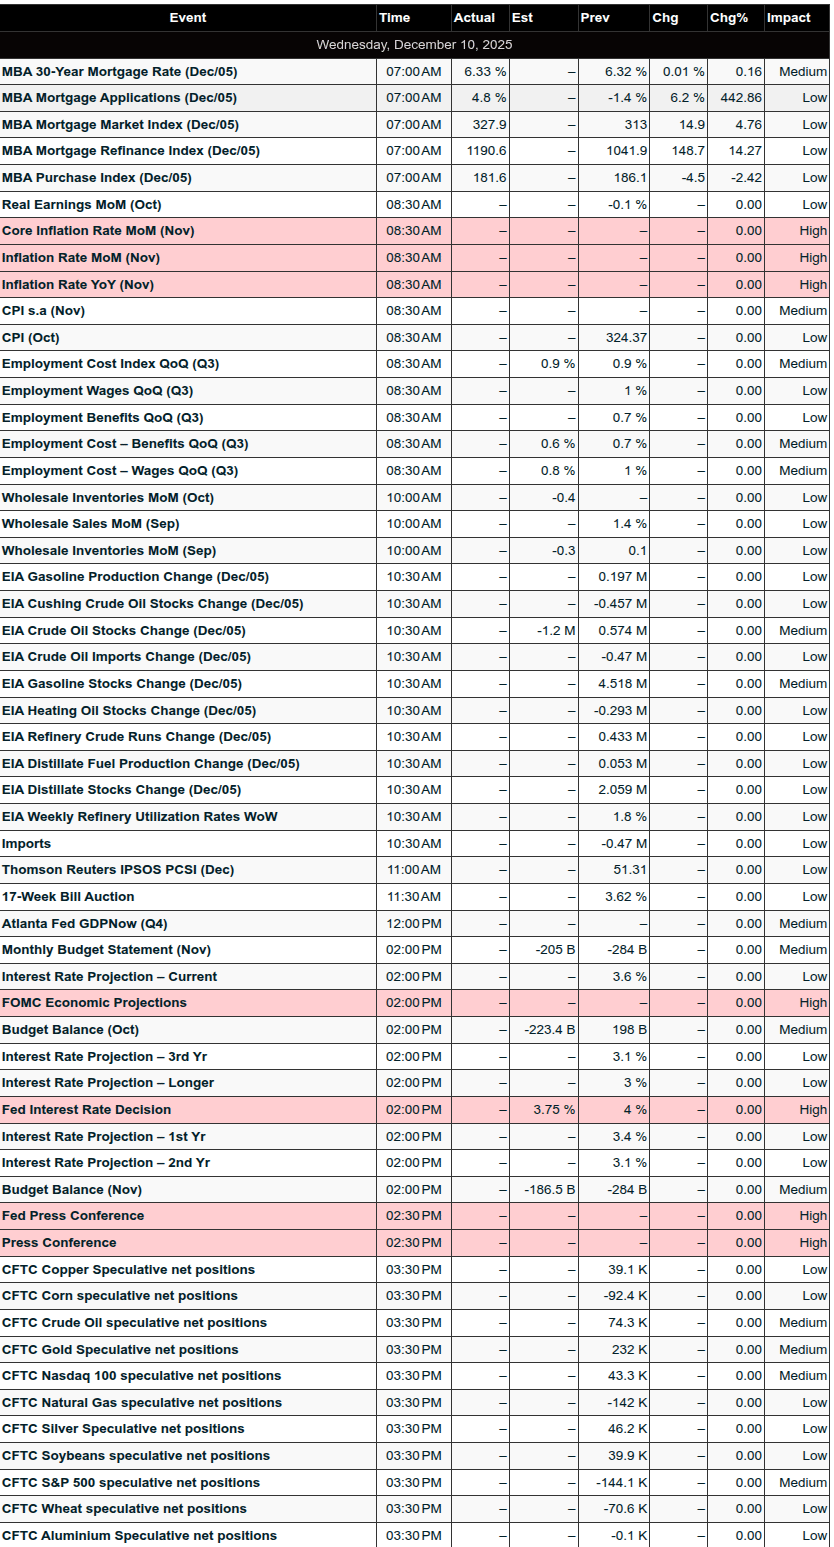
Economic
Today
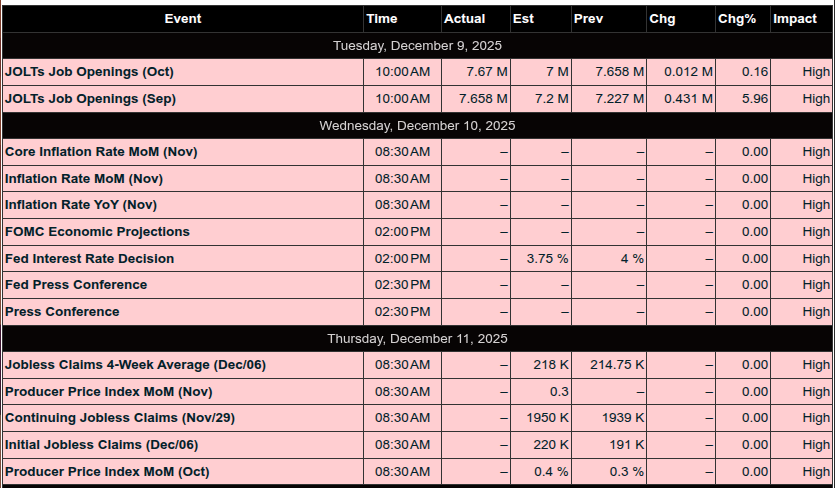
Important Upcoming / Recent
Earnings
Upcoming
Recent
Trading Room Summaries
Polaris Trading Group Summary – Tuesday, December 9, 2025
Tuesday was a Cycle Day 1 with 6855 called out early by PTGDavid as the Line in the Sand — a level that continued to attract price action like a magnet throughout the session. The market was mostly rotational with periods of trend and consolidation. It was also a “Hotdog day” as described by David — meaning relatively low volatility ahead of Wednesday’s much-anticipated FOMC event.
Key Trades & Highlights
1. Manny’s Support Buy (6846–6850 ES)
-
Executed Early: Manny led the charge with a textbook execution of Trade Plan #1.
-
Results:
-
+5 pts at 9:35 AM
-
+10 pts by 9:53 AM
-
+12 pts, then +18 pts hitting ONH (6868.50) by 10:03 AM
-
-
Lesson: Clear trigger + confirmation (delta flip, buyer absorption) led to a powerful rally. Patience and trade plan discipline paid off.
2. Continuation Long (6856–6860 ES)
-
Triggered Mid-Morning: Trade Plan #4 came into play once price held above key level with strong buyer support.
-
Results:
-
+5 pts (reported at 11:04 AM)
-
+10 pts at 11:15 AM (exit at 69s)
-
-
Lesson: Following balance and VWAP development allowed for entry into the continuation move, emphasizing patience for the setup to form.
3. Bosier’s Tactical Shorts & Levels
-
Multiple ES shorts including entries at 62.5, 54.5, and bid at 48.5, based on structure and A/D insights.
-
Actively watching bond market influence and internal market breadth, which added context for intraday turns.
-
Lesson: Market internals and related asset correlations (like bonds) remain key tools for confirming trade direction.
4. Market Internals & Imbalances
-
JOLTS beat forecast (7.67M vs. 7.12M) adding intraday volatility.
-
MOC Imbalances:
-
+$2.2B buy imbalance flipped to -$1.5B sell imbalance — absorbed easily with minimal late-day impact.
-
-
Lesson: Economic data and end-of-day flows add layers to narrative — use them to adjust risk expectations.
Key Lessons & Takeaways
-
Patience = Profits: Waiting for the trade plan triggers and not chasing price gave Manny and others the edge yesterday.
-
Plan the Trade, Trade the Plan: Manny’s early Support Buy was a clear example of executing a pre-defined strategy with conviction.
-
Line in the Sand (6855): Acted as both magnet and pivot throughout the day — recognizing how often price returns to key levels is valuable.
-
Psychological Edge: Slatitude39 shared insights into a CME Mindset Webinar (Dec 11), reinforcing that mental game is just as important as the technicals.
-
Market Conditions: Low volatility ahead of the Fed created a waiting game midday. Awareness of macro context helped avoid overtrading.
Market Behavior
-
Morning: Strong directional push off support with multiple profit-taking levels hit.
-
Midday: Consolidation around VWAP and LIS (6855), less directional clarity.
-
Afternoon: Price held LIS but faded into the close — minor weakness despite bullish intraday scenarios.
Looking Ahead
-
FED Day Today: Expect increased volatility and volume. Yesterday was the calm before the storm.
-
Trade Playbook Setups: Several from Tuesday (like Support Buy & Continuation Long) may reset depending on how we open relative to 6855 and developing structure.
Summary:
A strong execution day for those who stuck to the plan. Manny’s disciplined trading and trade streaming stood out. The market gave clean setups early, then turned into a waiting game as the session matured. Focus now shifts to preparing for the expected fireworks on Fed Day.
Discovery Trading Group Room Preview – Wednesday, December 10, 2025
Markets are in a holding pattern ahead of today’s FOMC announcement at 2:00pm ET and Powell’s press conference at 2:30pm ET. A 25bps rate cut—the third this year—is expected, but future policy direction remains unclear. The updated dot plot is anticipated to show a divided Fed, with rates likely on hold through early 2026.
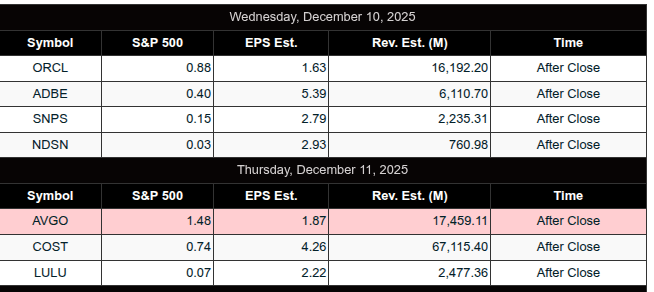
Key Earnings: Oracle (ORCL) reports after the bell with focus on AI-related growth; Oracle Cloud revenue expected up 68% YoY. Adobe (ADBE), NDSN, and SNPS also report post-close; Chewy (CHWY) reports premarket.
Notable Movers:
-
Silver surged past $60/oz, up 100% since May, fueled by Fed cut speculation and supply concerns.
-
SpaceX targets a $1.5T IPO in 2026, lifting space sector peers—EchoStar +12%, Rocket Lab +4%.
Trade Tensions: US-Indonesia tariff deal faces collapse over implementation delays, risking barriers on US exports.
Levels to Watch (ES):
-
Resistance: 7271/76, 7410/15
-
Support: 6783.50 (50-day MA), 6761/56 (TL), 6609/14, 6444/39
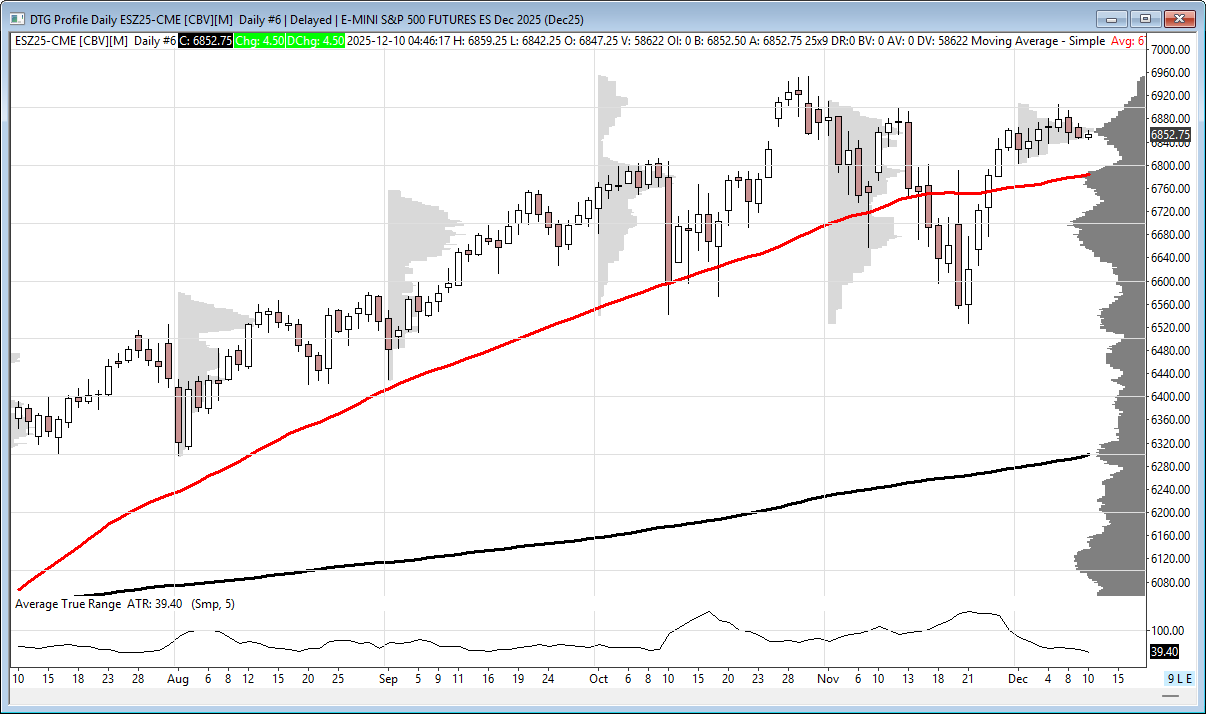
Volatility: Muted so far; ES ADR dropped to 47.25. Expect larger moves post-Fed.
Economic Data Today:
-
Employment Cost Index – 8:30am ET
-
Crude Oil Inventories – 10:30am ET
Affiliate Disclosure: This newsletter may contain affiliate links, which means we may earn a commission if you click through and make a purchase. This comes at no additional cost to you and helps us continue providing valuable content. We only recommend products or services we genuinely believe in. Thank you for your support!
Disclaimer: Charts and analysis are for discussion and education purposes only. I am not a financial advisor, do not give financial advice and am not recommending the buying or selling of any security.
Remember: Not all setups will trigger. Not all setups will be profitable. Not all setups should be taken. These are simply the setups that I have put together for years on my own and what I watch as part of my own “game plan” coming into each day. Good luck!
This post goes out as an email to our subscribers every day and is posted for free here around 2 PM ET. To get your real-time copy, sign up for the free or premium version here: Opening Print Subscribe.
Comments are closed