This post goes out as an email to our subscribers every day and is posted for free here around 2 PM ET. To get your real-time copy, sign up for the free or premium version here: Opening Print Subscribe.
From 2008 to Today: Echoes of a Crisis?
Follow @MrTopStep on Twitter and please share if you find our work valuable!
On Friday, the ES made a low at 6754.00, rallied up to 6800.00 at 12:18, chopped around not far off the highs, and then sold off down to the 6754 area at 1:51. It rallied up to 6776.25 at 2:27, pulled back to 6765.60 at 2:54, then rallied up to a 6775.75 double top at 3:39. It traded 6772.50 as the 3:50 cash imbalance showed $1.9B to sell, traded 6765 on the 4:00 cash close, and settled at 6764.00, down 2.75 points or -0.04%.
In the end, the government shutdown and the Jewish holiday didn’t have much effect on the upside trajectory of the ES and NQ. In terms of the ES’s overall tone, it acted fine. In terms of the ES’s overall trade, volume was decent at 1.31 million contracts traded.
It’s Saturday morning, and I am looking out the double doors of my bedroom over the pool, and the sky is filled with beautiful clouds and the sun is bright. But less than a mile away, the waves in the Atlantic Ocean are getting larger and larger. I don’t know when or where the hurricane is going to land, but I know it’s coming. But I am not just talking about the weather in Florida—I am also talking about the markets, which are both building up for something big.
Then I thought to myself, how long can some of the smartest people in the world, i.e., the ‘talking heads’, be wrong? I am just a regular guy, and if someone asked me what my best attributes are, I would say that I have common sense and have seen just about everything when it comes to the stock market, both the good and bad.
Date
Name / Entity
Key Warning
9/30
Ken Griffin
Citadel CEO
“Echoes of dot-com bubble” in AI; crash if returns fail soon; valuations stretched.
9/28
David Einhorn
Greenlight Capital CEO
AI boom as “biggest capital-destruction since dot-com”; recession, job risks.
9/23
Mark Spitznagel
Universa Investments CEO
Stocks may surge 20% then crash 1929-style from AI euphoria, policy shocks.
9/13
David Rosenberg
Economist (ex-Merrill Lynch)
“Gigantic price bubble”; negative S&P returns and correction ahead.
7/26
Albert Edwards
Société Générale strategist
“Everything bubble” to burst as higher yields hit valuations.
6/6
Robert Kiyosaki
Rich Dad author / investor
“Biggest crash in history”; move to gold, silver, Bitcoin.
5/6
Paul Tudor Jones
Tudor Investment founder
Tariffs on China could drive markets to “new lows,” like 1987.
4/7
Bill AckmanPershing Square CEO
Post-tariff “economic nuclear winter” from trade wars.
3/27
Marc ChaikinChaikin Analytics founder
First crash warning since 2022; “Tech Wreck” risk ahead.
2/1
Elliott Management
$70B+ activist hedge fund
Trump policies fueling “speculative bubbles”; record shorts.
1/30
Steve Cohen
Point72 CEO
Cautious on valuations; Trump policies and inflation risky.
1/–
Nouriel Roubini
NYU economist
“Stagflation” from inflation + slow growth to hit stocks.
I know I’ve said this many times, but from 1979 on, I have been part of every major stock market event, and I know I have never seen anything like this, other than the 2007 credit crisis when the Fed significantly increased its use of the discount window to provide liquidity to prevent a collapse of the financial system during the 2007–2009 global financial crisis.
In response to mounting pressure and bank runs, the Fed extended lending periods, lowered the discount rate, and ultimately saw borrowing through the discount window peak in October 2008 after the Lehman Brothers collapse. If you remember, JPMorgan acquired Bear Stearns—the first of the two to go out of business—but Bear Stearns was acquired by JPMorgan Chase with a Federal Reserve loan. The government allowed Lehman Brothers to fail, which added to the 2008 financial crisis.
I don’t know what’s going to happen, and I know some people think Friday’s new all-time high at 6800.00 is going to be the high. I’ve heard this over and over—that the high is in, the markets are going to crash—and while I can’t rule out some type of selloff or pullback, I still think there is more room on the upside. When it comes to the stock market, you are supposed to let the “good times roll”, but be vigilant. The economic and geopolitical risks both seem to be going in the same direction—up.
Like I said, this reminds me of the credit crisis—but a lot worse.
It’s 8:10 p.m. Sunday night and the ES made a high at 6783.50. So far, the ES is up xx points since the government shutdown started. One of the problems with thinking the ES and NQ go lower is the total lack of volume.
The Week Ahead
Fed Hell Week Part II is on tap. There are 20 Fed speakers, including Powell speaking at 8:30 a.m. Thursday morning, and five economic reports. The jump in Fed speak comes before the Fed imposes a “blackout” the week before each FOMC meeting, starting October 21.
Our View
There is no doubt that investors are nervous. The ES made its 31st record close, the YM its 11th record, and RTY (Dow Jones and Russell) both closed at a record, while the NQ closed down 0.30%. So far, all the concerns haven’t added up to much downside, but Goldman Sachs Chief Executive David Solomon was quoted as saying he wouldn’t be surprised by a stock market “drawdown” in the next year or two, “given the run we’ve had.”
When asked if there was an AI bubble, he sidestepped the question and said, “I think that there will be a lot of capital that’s deployed that will turn out to not deliver returns, and when that happens, people won’t feel good.” I agree with all of the above and agree that there will be a letdown at some point—it’s just a matter of when. Next week? Next month? Next year? In two years?
I don’t think the stock market is going up for the next two years, but I do think it will go up after our government officials get off their asses and pass a funding bill.
Our Lean
I don’t know how long the markets can keep shrugging off the government shutdown, but it sure has helped the metals and Bitcoin. While gold also keeps hitting records, silver and platinum futures have skyrocketed, notching their longest weekly winning streaks in years. Silver is up 7 weeks in a row, the most since August 2020, and platinum has climbed for 9 consecutive weeks, its longest such stretch since May 2006. Bitcoin traded up to $125,000.
I think you have to approach the new highs with an air of caution. This doesn’t mean you can’t buy the pullbacks, but the rally may narrow. The ES has been up 8 out of the last 12 sessions, with Friday being down only 1.75 points.
Our lean: If the volume is not too low, I think you have to sell the early rallies. The gap should set the early tone. And keep an eye out for a double pump, then buy the pullbacks. It may not be as easy for the bulls…
From Goldman Sachs
What Is the Economic Impact of a US Government Shutdown?
US Congressional Democrats and Republicans are at odds over funding the federal government, resulting in a shutdown that started October 1 and is expected to last until lawmakers reach an agreement. A shutdown only affects programs funded by Congressional appropriations, also known as discretionary spending.
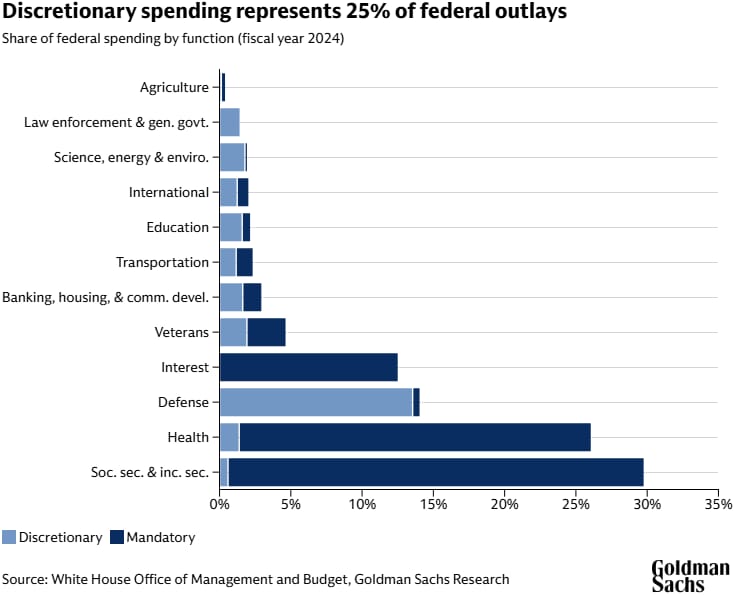
For each week of a shutdown, the direct effect of furloughed federal workers would reduce fourth-quarter annualized real GDP growth (quarter-on-quarter) by about 0.15 percentage points, according to Goldman Sachs Research. Reopening would result in an equally sized positive effect on growth in the first quarter, assuming the shutdown ends before then.
That estimate assumes the shutdown affects around 900,000 federal employees and generally follows the same pattern as prior shutdowns. If the Defense Department or other agencies can fund some operations from other sources, the effect on growth would be slightly smaller, Goldman Sachs Research economists Alec Phillips and Ronnie Walker write in a report.
Gold Forecast to Break Record Highs
The price of gold is forecast by Goldman Sachs Research to rise 6% through the middle of 2026 (as of September 24), underpinned by fresh demand from key groups of buyers who have contributed to a series of record price highs. Gold has risen more than 40% in 2025 and is on pace for its third straight year of double-digits gains.
Gold is predicted to rise to $4,000 per troy ounce by the middle of next year, Goldman Sachs Research analyst Lina Thomas writes in the team’s report. Their forecast is driven by strong structural demand from central banks and easing from the US Federal Reserve (which supports demand for gold from exchange-traded funds).
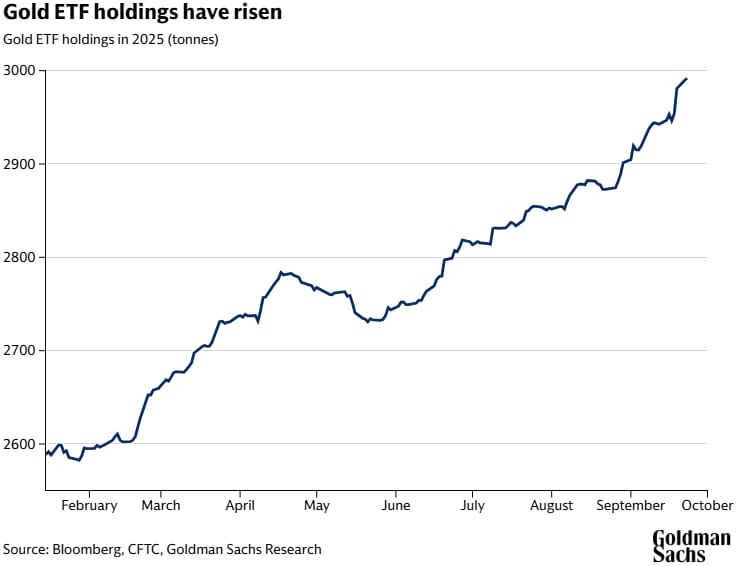
Buyers of gold fall into two broad groups, according to Goldman Sachs Research. Conviction buyers tend to purchase gold consistently, regardless of the price, based on their view of the economy or to hedge risk. These include central banks, ETFs, and speculators. Their thesis-driven flows set the price direction.
As a rule of thumb, every 100 tonnes of net purchases by these conviction buyers corresponds to a 1.7% rise in the gold price.
By contrast, opportunistic buyers such as households in emerging markets step in when they believe the price is right. They may provide a floor under prices on the way down and resistance on the way up.
MiM and Daily Recap
Intraday Recap
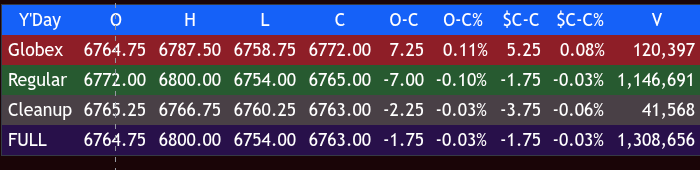
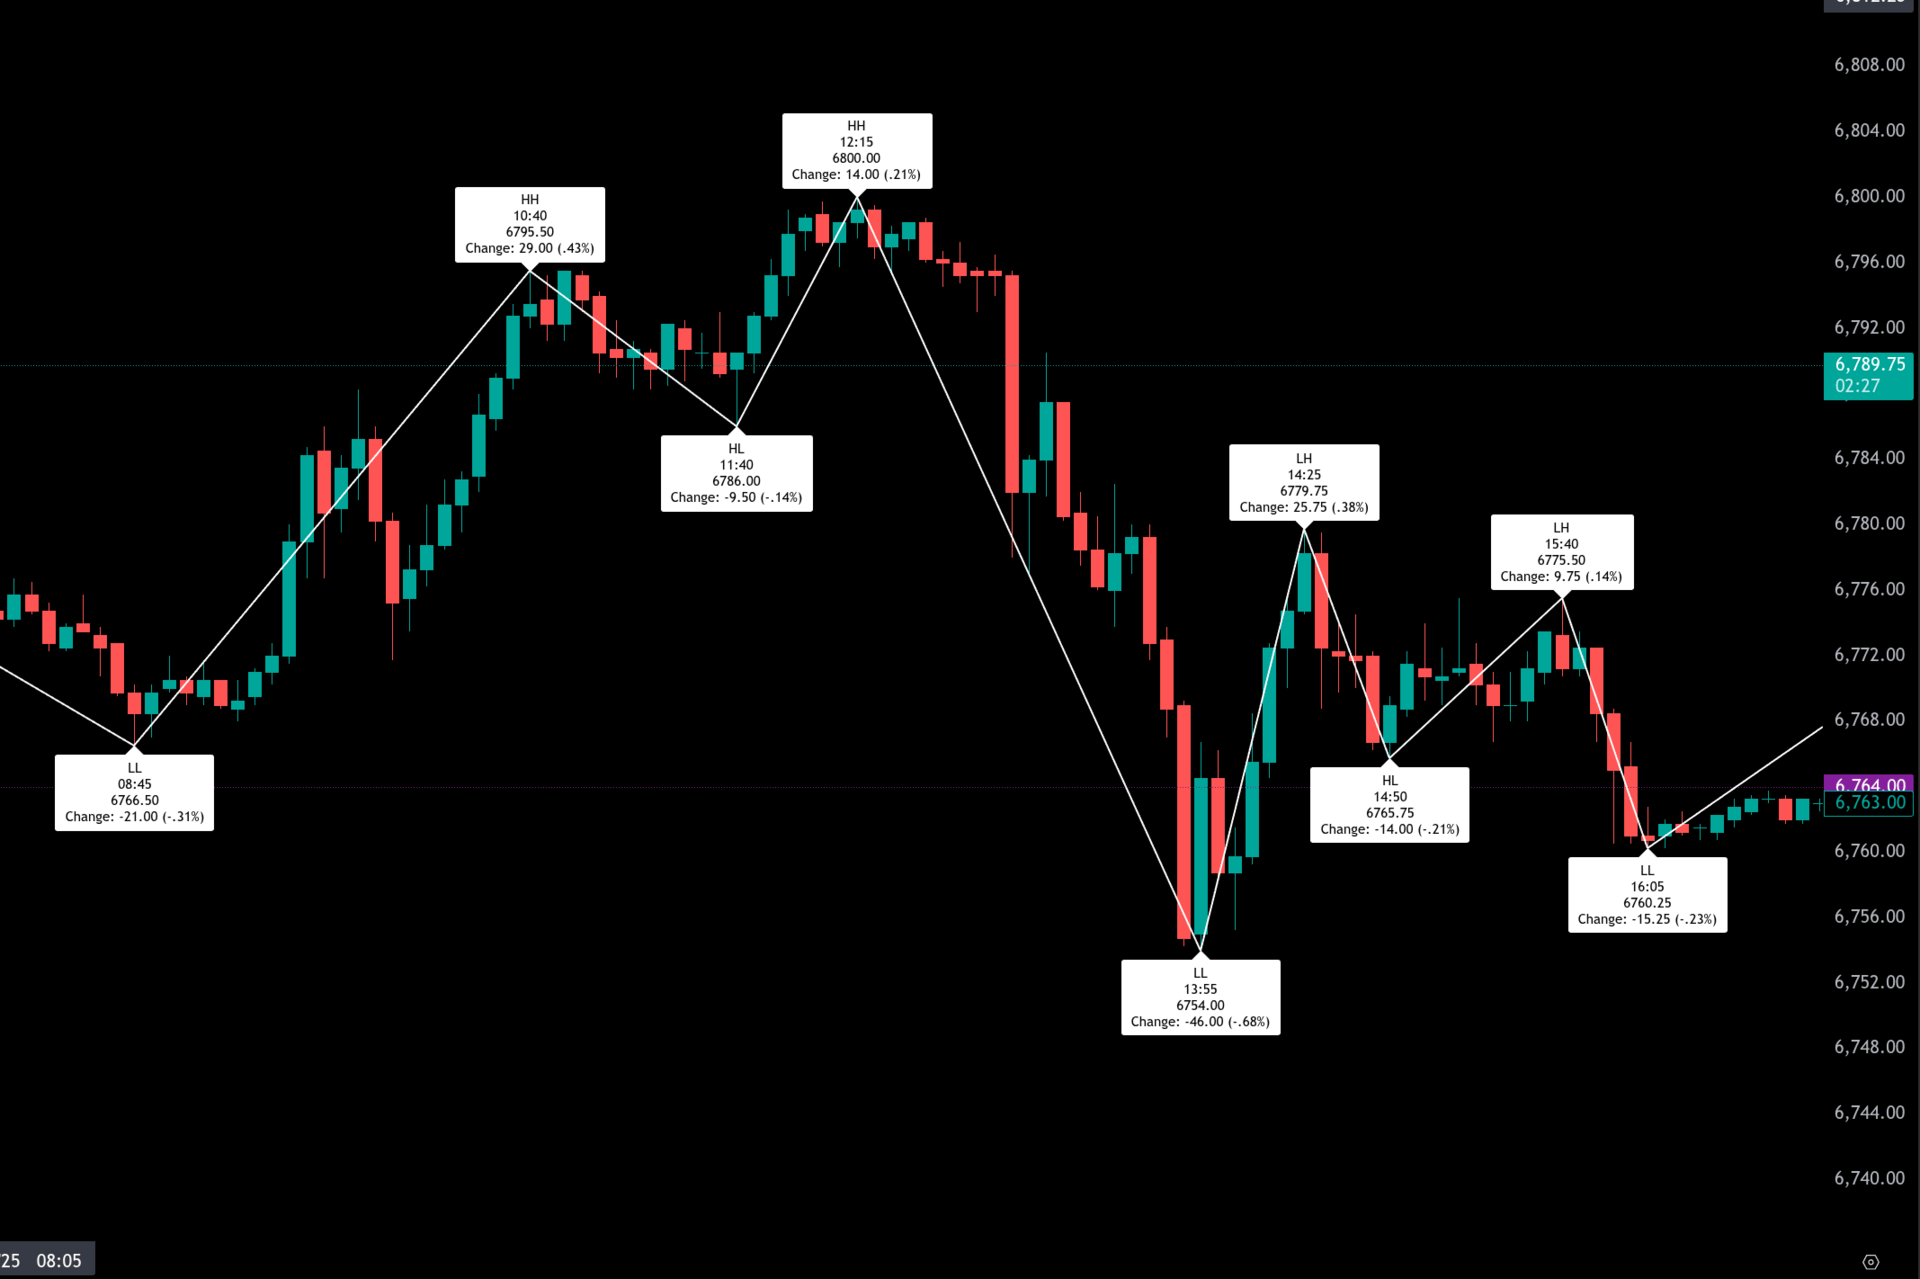
The ES began Thursday’s overnight session with a muted performance. Globex opened Thursday evening at 6764.75 and quickly dipped to 6758.75 by 6:30 PM before buyers stabilized the tape. From that early low, the contract rallied through the Asian and European sessions, climbing steadily to 6784.25 at 1:40 AM. After a shallow pullback to 6776.75 at 2:00 AM, the rally resumed into the early-morning European hours, peaking at 6787.50 by 5:50 AM. Sellers emerged from that point, pressing ES back down to 6766.50 by 8:40 AM—establishing a low just before the New York open.
The 9:30 AM regular session opened at 6772.00, a small 6 points higher than the 8:40 AM low, and initially followed through on the early weakness, tagging 6754.00 at 9:35 AM before reversing sharply. A one-hour rally carried the contract to 6795.50 by 10:40 AM and then to 6800.00 at 12:15 PM, the session’s—and day’s—high. From there, momentum shifted negative as sellers gradually took control into the afternoon. The decline accelerated after 1:00 PM, breaking successive higher lows and reaching 6754.00 by 1:55 PM. A brief bounce to 6779.75 at 2:25 PM faded quickly, giving way to another leg down that printed 6760.25 at 4:05 PM. Futures finished the cash session at 6765.00 and slipped another two points to 6763.00 on the 5:00 PM cleanup settle.
Volume reached 1.31 million contracts for the full session, with 1.15 million occurring during regular hours. The contract closed lower by 1.75 points (-0.03%) on a cash-to-cash basis, modestly extending its consolidation phase after last week’s record highs. Globex gained 7.25 points overnight (+0.11%), while the regular session gave back 7.00 points (-0.10%), leaving the net daily result fractionally negative.
Market Tone & Notable Factors
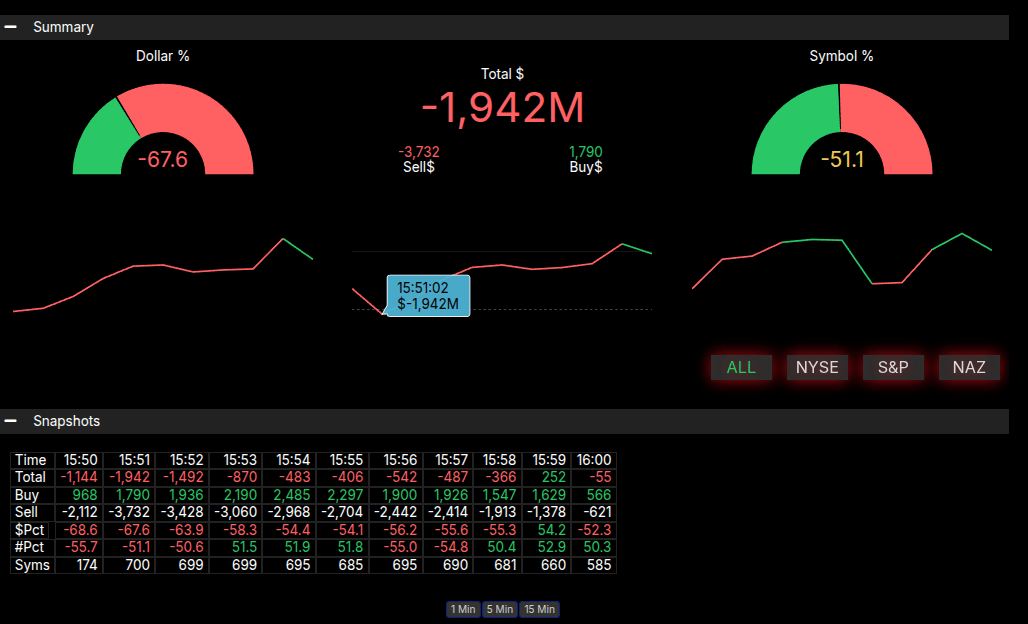
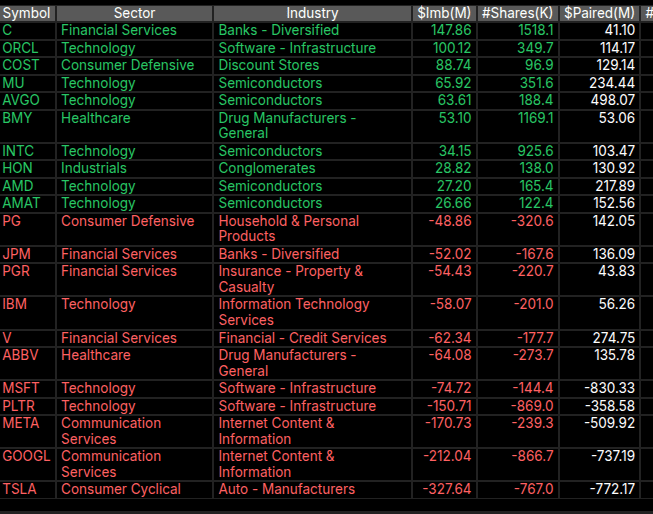
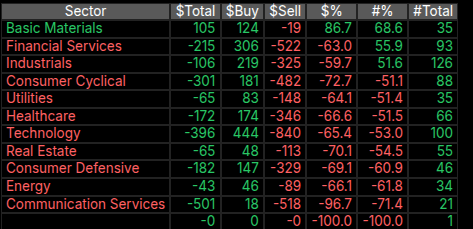
Despite the small index change, tone leaned defensive throughout Monday’s trade. The early rally to 6800.00 failed to attract continuation, and each rebound attempt into the afternoon met steady supply. Sector rotation tilted clearly bearish into the close. MiM data showed a strong sell imbalance of –$1.94 billion, with 67.6% of total imbalance dollars on the sell side and –51.1% of symbols skewed lower. Financials (–$215 M), Technology (–$396 M), and Communication Services (–$501 M) led sector outflows, offset partially by modest Basic Materials buying (+$105 M). Among single names, selling pressure centered on TSLA (–$327 M), GOOGL (–$212 M), META (–$171 M), and MSFT (–$151 M), while C (+$148 M) and ORCL (+$100 M) drew isolated buy interest.
The late-day sell programs aligned with that imbalance, pressing ES from 6775 down to the 6760 area into the 4:00 PM print. Overall sentiment remains neutral-to-soft after multiple record highs last week, with rotation out of mega-cap tech tempering broader index momentum. Unless dip-buyers reclaim the 6800 handle early today, risk may stay skewed toward a short-term retracement toward 6740-6720 support.
Technical Edge
Fair Values for October 6, 2025:
-
SP: 46.52
-
NQ: 198.94
-
Dow: 256.03
Daily Breadth Data 📊
For Friday, October 3, 2025
• NYSE Breadth: 64% Upside Volume
• Nasdaq Breadth: 68% Upside Volume
• Total Breadth: 68% Upside Volume
• NYSE Advance/Decline: 61% Advance
• Nasdaq Advance/Decline: 60% Advance
• Total Advance/Decline: 60% Advance
• NYSE New Highs/New Lows: 162 / 13
• Nasdaq New Highs/New Lows: 448 / 51
• NYSE TRIN: 0.71
• Nasdaq TRIN: 0.67
Weekly Breadth Data 📈
For Week Ending October 3, 2025
• NYSE Breadth: 55% Upside Volume
• Nasdaq Breadth: 63% Upside Volume
• Total Breadth: 60% Upside Volume
• NYSE Advance/Decline: 56% Advance
• Nasdaq Advance/Decline: 60% Advance
• Total Advance/Decline: 59% Advance
• NYSE New Highs/New Lows: 315 / 91
• Nasdaq New Highs/New Lows: 748 / 238
• NYSE TRIN: 0.99
• Nasdaq TRIN: 0.88
Today’s BTS Levels:
ES Z
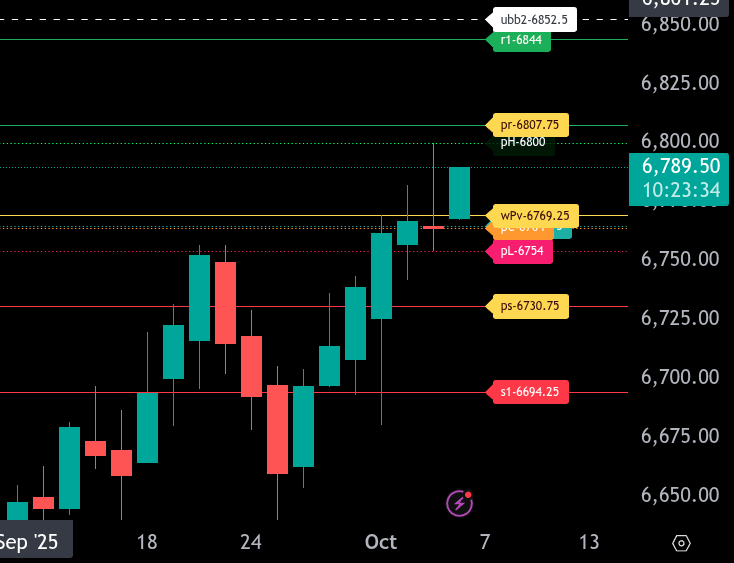
The bull/bear line for the ES is at 6769.25. This is the key pivot that defines today’s bias. Trading above 6769.25 favors the bulls, while holding below this level keeps the tone defensive.
Currently, ES is trading around 6789.50, indicating early strength above the bull/bear line. If buyers can maintain control above 6769.25, the next upside targets are 6807.75, the upper range target, and 6844.00. A breakout above 6844.00 would open the door to test new contract highs near 6850.00–6860.00.
On the downside, initial support is found at 6764.00, followed by 6754.00. A break back below 6769.25 and sustained trade under 6754.00 could invite sellers, targeting 6730.75 as the next lower range level. Below that, deeper support rests near 6694.25.
Overall, the tone is constructive while holding above 6769.25. Dips into the 6765–6770 zone may offer long opportunities as long as price remains above the bull/bear pivot. A move back under 6754.00 would shift the short-term outlook to bearish and set up a potential retest of 6730.75 or lower.
NQ Z
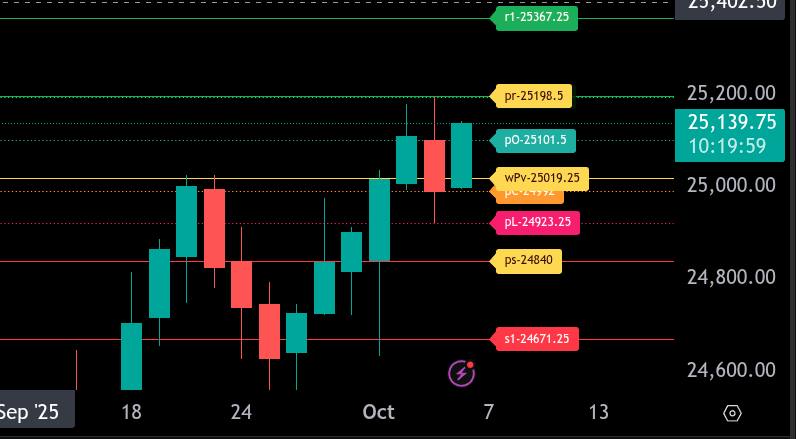
The bull/bear line for the NQ is at 25,019.25. This level marks the key pivot for today’s session. Above this line, the tone shifts bullish with potential for continuation toward higher resistance levels, while sustained trading below it signals further weakness.
Currently, NQ is trading around 25,138.50, above the bull/bear line, showing early signs of buying strength during the Globex session. The immediate resistance comes in at 25,198.50, the upper range target, and then at 25,367.25 (R1). A breakout and sustained hold above 25,198.50 would likely open the door for a move toward 25,367.25.
On the downside, initial support sits at 24,992, followed by the lower range target at 24,840. A break below 24,840 would expose deeper support near 24,671.25 (S1), which could accelerate downside momentum.
For intraday context, holding above 25,019.25 favors buying dips toward 25,198.50 and 25,367.25. If NQ falls back below 25,019.25 and sustains weakness, expect pressure toward 24,923.25, 24,840, and possibly 24,671.25.
The short-term bias remains cautiously bullish while above 25,019.25, but turns bearish if price loses that key pivot.
Calendars
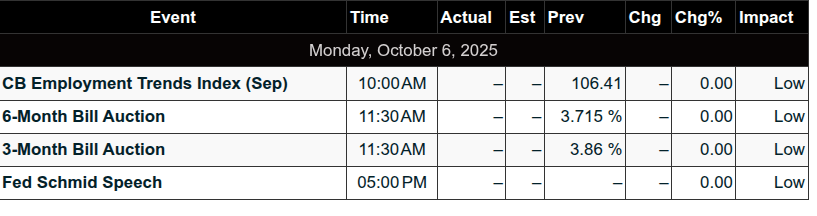
Today’s Economic Calendar
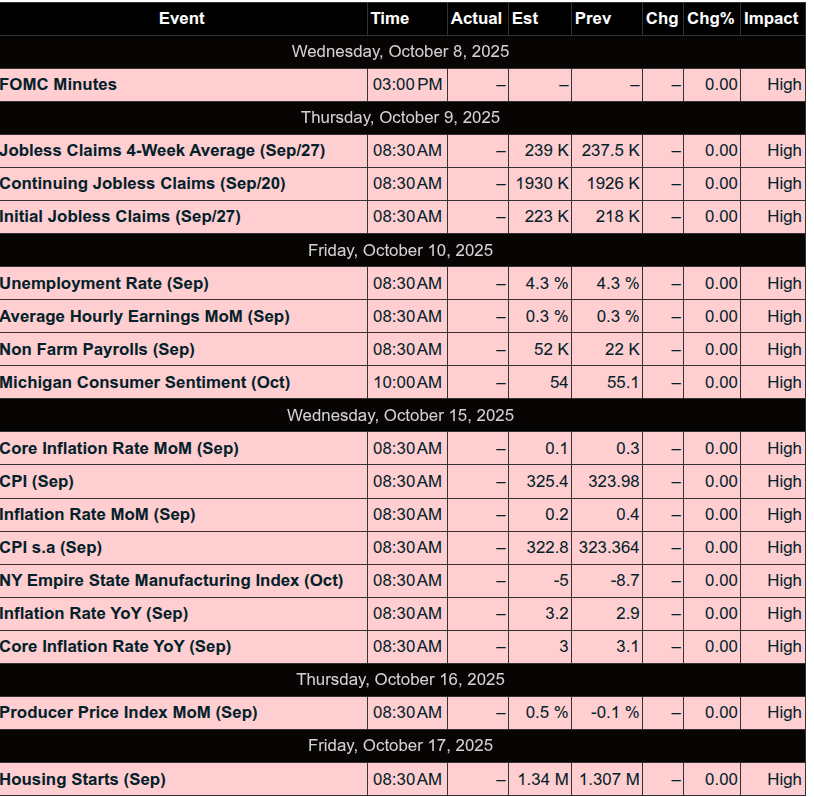
This Week’s Important Economic Events
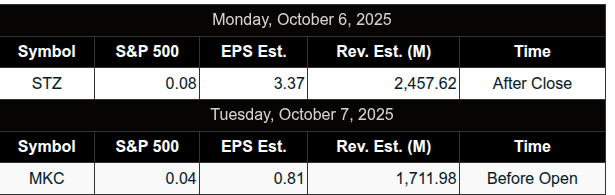
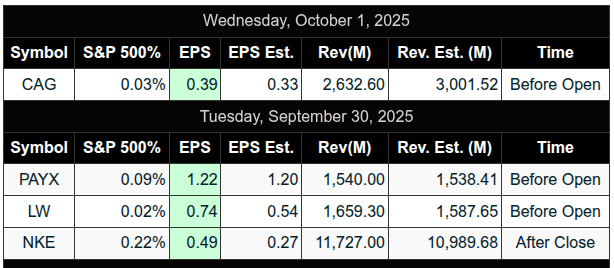
Today’s Earnings
Recent Earnings
Room Summaries:
Polaris Trading Group Summary – Friday, October 3, 2025
Friday was labeled a Capital Preservation Day, and the PTG room approached it with strategic caution. Despite the lack of the usual Non-Farm Payroll (NFP) data due to a government shutdown, the day featured solid trade setups, excellent real-time reads (especially by Manny), and a reminder of the importance of trade management and psychology.
Key Developments & Positive Trades
-
Strong Start:
-
Overnight, both ES and NQ fulfilled their upper target zones per David’s Daily Trade Strategy (DTS). ES hit 6780–6785 and NQ hit 25165–25180 early.
-
David called this a “Good start to FRYday” and set the tone for a day focused on capital preservation.
-
-
D-Level Setup:
-
David highlighted a successful D-Level Strike early in the session, reinforcing the value of reviewing the DL Money Box (DLMB) training video.
-
Several traders, like Roy_ and Bosier, leveraged these setups:
-
Roy_ shared taking a long on a pullback to VWAP with two scales out.
-
Bosier noted a clean trade: Long from 80.75 → scaled at 83.75 & 86.75 → held 1 contract.
-
-
-
Midday Clock Tracking (Manny):
-
Manny confirmed time-based pivots were “tracking well” with the AM low and mid-morning high hitting on schedule.
-
Around 12:00 PM, Manny and Bosier both reported profitable trades off 6790:
-
Manny: L6790, +3, +5, +10 to 6805.
-
Bosier: Long at 90, scaled out at 96 and 02.
-
-
-
Momentum Read & Fade Call:
-
At highs (~6805), Manny observed massive bids getting hit (50–300 lot orders), initially interpreted as fuel for a breakout.
-
When buyers gave up, he pivoted quickly and anticipated a rollover, calling it a “solid read” and warning others not to “pick a top” but wait for opportunity.
-
His “walk away” alert proved prescient as the market tanked into the afternoon.
-
Lessons & Takeaways
-
Review = Reinforcement:
-
David stressed the importance of repeatedly reviewing training material like the DLMB video to pick up nuances.
-
Audio-visual repetition strengthens pattern recognition.
-
-
Anchor in Discipline:
-
David praised the concept of “anchoring” — reinforcing positive behaviors and decision-making to avoid impulsive trades.
-
-
Psychological Edge:
-
Several comments reminded traders of psychological pitfalls:
-
Don’t let greed extend your targets unnecessarily.
-
Know when to trail out vs. attack.
-
“Put the ball in play” – don’t overcomplicate trades.
-
-
-
Structure Shift Awareness:
-
Manny noted a structure shift after lunch, pivoting from a long bias to short bias — great example of real-time market adaptation.
-
-
Past ≠ Present ≠ Future:
-
David briefly noted a Wyckoff lesson: Avoid stop-loss mistakes and don’t anchor expectations to previous results.
-
Market Dynamics & Commentary
-
Institutional Unwinding:
-
David shared market context: Institutions offloading equities at high levels, possibly setting up for selloffs.
-
Manny later tied this into the Friday afternoon “conviction test”, asking: Do you really want to be long into the weekend at ATHs?
-
-
Time-Based Trading Excellence:
-
Manny’s clock model proved reliable throughout the day.
-
He was particularly effective at blending setup-based trades with time pivots, emphasizing that time alone doesn’t justify a trade — setups must align.
-
Summary
Friday delivered a well-managed, methodical trading day with strong team collaboration, disciplined execution, and several solid profit opportunities. The room maintained a professional, strategic tone throughout, anchored by PTGDavid’s guidance and Manny’s clock tracking.
Key Wins:
-
D-Level strikes
-
VWAP pullback longs
-
Timely read of the afternoon fade
Key Takeaways:
-
Master the tools (DLMB, DTS)
-
Don’t chase — wait for confirmation
-
Reinforce positive behaviors
-
Time + Setup = High Probability
DTG Room Preview – Monday, October 6, 2025
-
Macro & Political: The U.S. government shutdown continues with no resolution in sight. The Senate remains gridlocked, the House is out for the week, and civil unrest is simmering. The Congressional Budget Office reports 750,000 daily furloughs. Meanwhile, protests in Portland led a Trump-appointed judge to block troop deployments for 14 days.
-
Markets: Despite political headwinds, Wall Street remains resilient. The S&P 500 and Nasdaq have now posted gains in four of the last five weeks. No U.S. economic data is due today. Fed minutes (out Wednesday) may offer insights into last month’s rate cut. September jobs report is delayed again.
-
Commodities: Gold is marching toward $4,000/oz, while silver eyes a return to its historic $50/oz levels as safe-haven demand rises.
-
Corporate News: Tesla faces pricing pressure as the $7,500 EV tax credit expires. Musk hinted at a cheaper vehicle and teased an event for Tuesday. Q3 earnings pick up with reports from PepsiCo, Delta, Levi Strauss this week. Constellation Brands reports after the bell today.
-
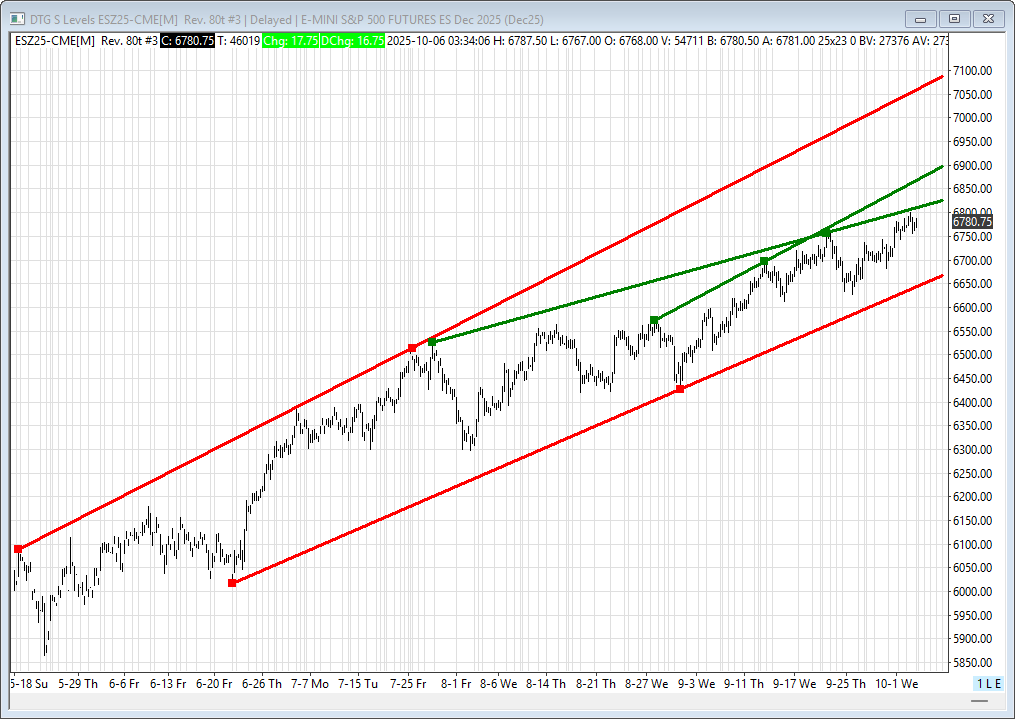
Futures Outlook: Moderate and steady volatility continues. ES 5-day ADR is 53.25 points. No overnight whale activity detected. Key technical levels to watch on ES:
-
Resistance: 6813/18, 6876/81, 7089/94
-
Support: 6656/61
The short-term uptrend channel top held Friday’s high, giving bears room to work within trendlines.
-
Affiliate Disclosure: This newsletter may contain affiliate links, which means we may earn a commission if you click through and make a purchase. This comes at no additional cost to you and helps us continue providing valuable content. We only recommend products or services we genuinely believe in. Thank you for your support!
Disclaimer: Charts and analysis are for discussion and education purposes only. I am not a financial advisor, do not give financial advice and am not recommending the buying or selling of any security.
Remember: Not all setups will trigger. Not all setups will be profitable. Not all setups should be taken. These are simply the setups that I have put together for years on my own and what I watch as part of my own “game plan” coming into each day. Good luck!
This post goes out as an email to our subscribers every day and is posted for free here around 2 PM ET. To get your real-time copy, sign up for the free or premium version here: Opening Print Subscribe.
Comments are closed