This post goes out as an email to our subscribers every day and is posted for free here around 2 PM ET. To get your real-time copy, sign up for the free or premium version here: Opening Print Subscribe.
From Bid to Blowout: Moody’s Ruined the Mood
Follow @MrTopStep on Twitter and please share if you find our work valuable!
Our View
How best to describe Friday’s trade? A choppy sideways grind in the first part of the day, stuck in a 20 to 25 point trading range until 10:30. The price action has changed. There’s usually some type of sell-off and then a rally. Once that’s established, the ES languishes for hours waiting for Part 3 of the trading day — the hour of power.
During that time, and it happened almost all week, the ES falls into what I call a “no man’s chop”: rally 5 points, sell off 6 points, rally 3, sell off 8, rally 10, drop 30, rally 20 — you know what I mean. It’s trading up and down in a very narrow range, not really selling off, but getting bid up after the small drops.
The ES went bid late in the day and traded 5977.25 going into 3:00, then sold off down to the 5970 area, upticked, and started going offered. The ES traded 5971.50 as the 3:50 PM imbalance came out flat, then jumped to $1.4 billion to buy, and traded 5975.25 on the 4:00 cash close.
If you look at the chart and the late time, the ES and NQ looked fine. So why the sell-off? Because Moody’s downgraded the U.S. credit rating from Aaa to Aa1 at 4:45. This pushed the ES back down to the 5950 area, and it settled at 5648.00, up 14.50 points. The NQ sold off from its 21,512.00 high down to the 21,380 level and settled at 21,400.25, up 0.02%.
So the ES languished most of the day, rallied late, but sold off 5 points before the Moody’s downgrade at 4:45. I’ve seen this type of price action for the last 35 years, and no matter what anyone says, it’s front-running. I think there was selling going on under the surface all day. You could see it on the ES ladder and in the imbalance charts after the high.
After 2:00, you could see the ES and NQ go bid and the “flip” in the price action — from small bids and lifting offers to larger offers and smaller bids. I get it; we get the late-day sell-off. But this one was very pronounced, and the low volume of 1.079 million only added to it.
FED WEEK
Monday, May 19
New York Fed President John Williams’ speech and Fed Vice Chair Philip Jefferson’s speech at 8:45 AM.
Leading Indicators at 10:00 AM.
Tuesday, May 20
Richmond Fed President Tom Barkin’s speech at 9:00 AM.
Boston Fed President Susan Collins participates in the Fed Listens event at 9:30 AM.
St. Louis Fed President Alberto Musalem’s speech at 1:00 PM.
Federal Reserve Governor Adriana Kugler’s speech at 5:00 PM.
Wednesday, May 22
Richmond Fed President Tom Barkin and Fed Governor Michelle Bowman take part in the Fed Listens event at 12:15 PM.
Thursday, May 23
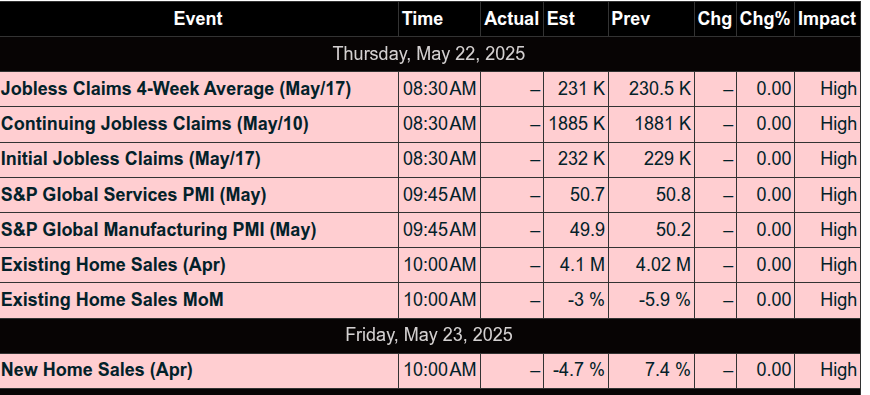
Initial Jobless Claims at 8:30 AM.
PMI at 9:45 AM.
Existing Home Sales at 10:00 AM.
New York Fed President John Williams’ speech at 2:00 PM.
Friday, May 23
Kansas City Fed President Jeff Schmid’s speech at 9:35 AM.
New Home Sales at 10:00 AM.
Federal Reserve Governor Lisa Cook’s speech at 12:00 PM.
Sunday, May 25
Federal Reserve Chair Jerome Powell delivers a commencement address.
Looking to next week, there is a ton of data in the last week of the month, and it’s a shortened week due to the Memorial Day Holiday. CME Trading Hours
In the 4 remaining sessions of the month next week, there are 12 economic reports. Friday, May 30 is the biggest day of the week:
-
Personal Income
-
PCE
-
Trade Balance
-
Chicago Business Barometer
-
Consumer Sentiment
I had already heard that after Moody’s downgrade, the markets would get weak, but Rich from @HandleStats gave me the complete study.
Our Lean
The VIX sold off down to 17.15 and volume has dropped. The ES has been up 16 of the last 19 sessions, including Friday. I told the PitBull last night that the ES would be down at least 80 points and that gold would be up 60 to 80 — and both are on mark.
Our lean is to sell the big rips. I don’t think this is over on the downside.
MiM and Daily Recap
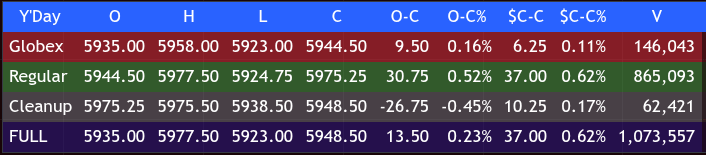
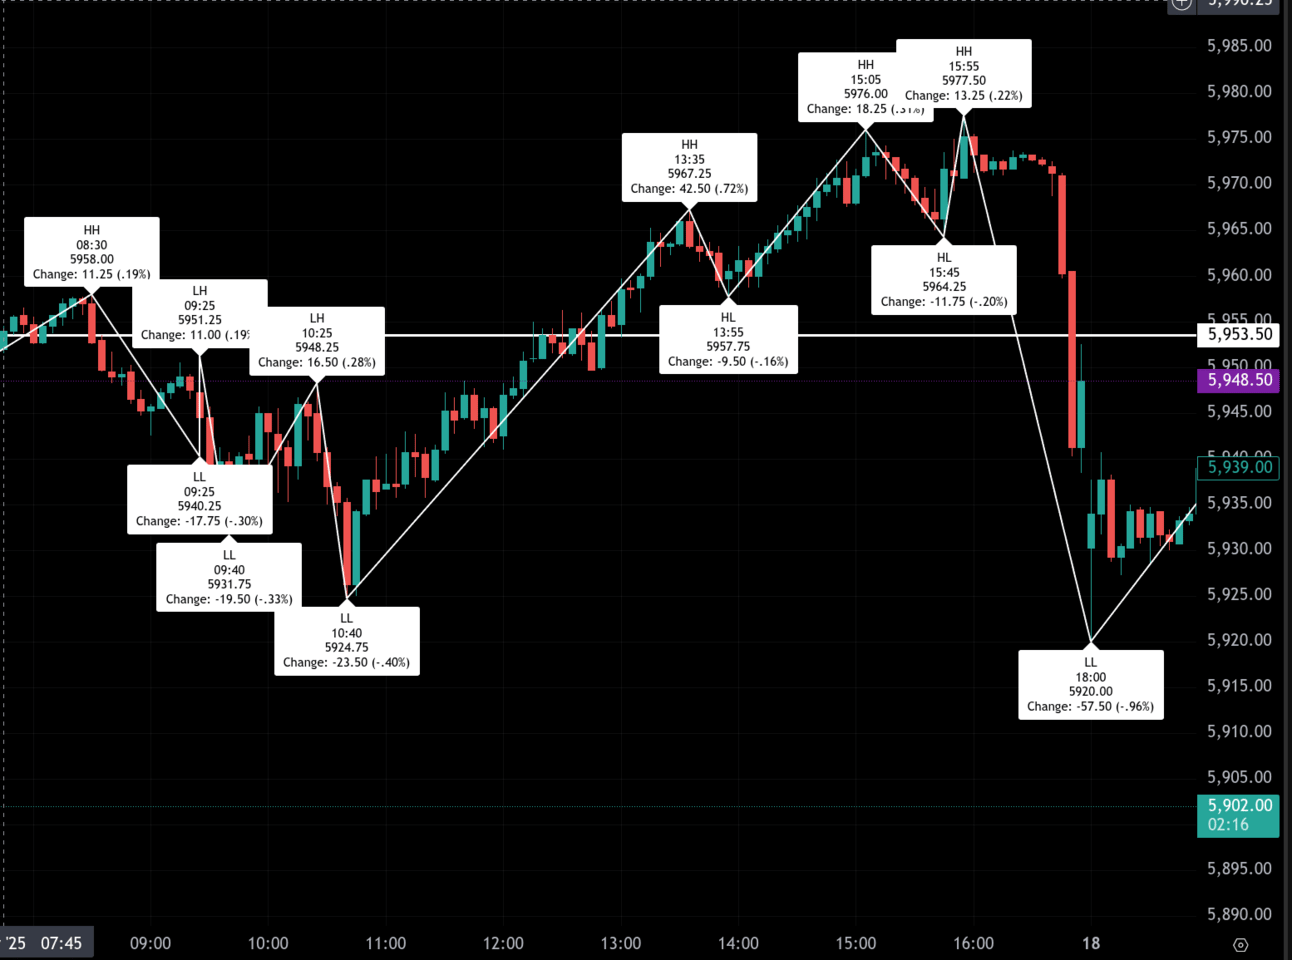
The S&P 500 futures session began with mild overnight strength, climbing to a Globex high of 5958.00 at 8:30 AM ET. This marked the early peak before regular trading began, and despite the initial positive tone, sellers took control into the cash open. The first leg lower came with a dip to 5931.75 at 9:40 AM, marking a total drop of 27 points from the morning 8:30 AM high.
Buyers stepped back in mid-morning, sending ES to a local high of 5948.25 at 10:25 AM followed by a pullback to 5924.75 at 10:40. This was to become the low for the regular session. Sustaining upward momentum from the low through the noon session. A strong push peaked at 5967.25 by 1:35 PM, representing a robust 42.50-point move from the earlier low. A shallow pullback to 5957.75 at 1:55 PM set the stage for another rally leg that extended to the intraday high of 5977.50 at 3:55 PM—up 52.75 points from the session low and representing the highest level of the week.
However, the late afternoon brought sharp volatility. After printing the high, ES reversed hard into the 4:00 PM close, falling to 5948.50. The decline extended into the cleanup session, with a final plunge to the session low of 5920.00 at 6:00 PM ET after Moody’s ratings cut on the USA. This marked a staggering 57.50-point reversal (-0.96%) from the afternoon top.
Session-to-session, ES closed the regular session at 5975.25, up 37.00 points or +0.62% from Thursday’s settle. From open to close, the regular session posted a solid 30.75-point gain (+0.52%).
Friday’s tone was mixed but resolved bullishly—at least until the final 30 minutes. The early cash session was marked by volatility and a series of lower lows, but a powerful midday bid carried the index to fresh highs by late afternoon. Overall, it reflected continued interest in dip-buying behavior, consistent with OPEX dynamics and upward CTA flows mentioned earlier in the week.
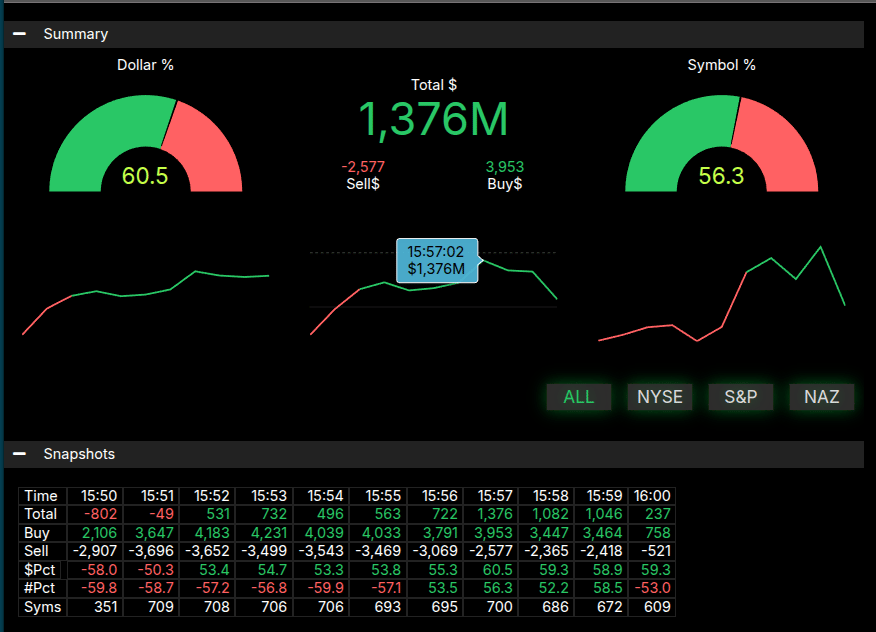
The Market-on-Close (MOC) imbalance at 3:57 PM registered a total of $1.376 billion to buy, with 60.5% of dollar flow leaning bullish. However, the symbol imbalance came in at 56.3%—below the ±66% threshold for outsized influence. Despite the size of the imbalance, the reaction was bearish: price sold off nearly 40 points from the final high, possibly signaling profit-taking ahead of the weekend or large unwinds from post-OPEX rebalancing.
Total volume came in at just over 1.07 million contracts, with the regular session contributing the bulk at 865,093.
Despite strong gains throughout the day and a rally to new all-time highs intraday, the session ended on a defensive note with a swift drawdown into the close. Still, the ES managed a healthy 0.62% gain from Thursday’s close and held above key short-term levels, keeping the broader bullish trend intact into next week.

Technical Edge
Fair Values for May 19, 2025:
-
SP: 18.07
-
NQ: 74.27
-
Dow: 97.4
Daily Breadth Data 📊
-
For Friday, May 16, 2025
-
NYSE Breadth: 76% Upside Volume
-
Nasdaq Breadth: 72% Upside Volume
-
Total Breadth: 74% Upside Volume
-
NYSE Advance/Decline: 70% Advance
-
Nasdaq Advance/Decline: 64% Advance
-
Total Advance/Decline: 67% Advance
-
NYSE New Highs/New Lows: 85 / 11
-
Nasdaq New Highs/New Lows: 143 / 80
-
NYSE TRIN: 0.72
-
Nasdaq TRIN: 0.69
-
Weekly Breadth Data 📈
-
For the Week Ending May 16, 2025
-
NYSE Breadth: 63% Upside Volume
-
Nasdaq Breadth: 67% Upside Volume
-
Total Breadth: 65% Upside Volume
-
NYSE Advance/Decline: 76% Advance
-
Nasdaq Advance/Decline: 71% Advance
-
Total Advance/Decline: 74% Advance
-
NYSE New Highs/New Lows: 175 / 63
-
Nasdaq New Highs/New Lows: 334 / 266
-
NYSE TRIN: 0.69
-
Nasdaq TRIN: 0.60
-
Room Summaries:
Polaris Trading Group Summary Friday, May 16, 2025
Theme of the Day: Capital Preservation + Afternoon Grind-Up Rally
The PTG trading room, led by David Dube (PTGDavid), approached Friday’s record-breaking options expiration (OPEX) with a strategic mindset focused on capital preservation during a choppy and unpredictable morning session, ultimately benefiting from a strong, disciplined afternoon grind-up.
Key Positive Trades and Highlights
-
Morning Bull Target Hit Early: The initial bull scenario above 5940 targeting 5955–5960 was fulfilled early, providing a clear technical trade for those quick on the trigger.
-
A10 Short Paid Off: During the mid-morning chop, David called an A10 short setup that paid nicely, catching the downside move as price slipped.
-
Afternoon Bullish Grind: David anticipated a possible “grind up afternoon rhythm,” which unfolded as planned:
-
5960 Target Hit in the afternoon session, completing the morning’s outlined scenario.
-
Persistent CALL buying noted, signaling confidence in upside continuation.
-
5974 Upper Money Box Target was also hit, marking a successful upper-range extension into the close.
-
The closing bell saw a $1.4B MOC BUY, confirming the bullish lean into the end of day.
-
Market Conditions & Commentary
-
Record Options Expiry: Over $2.8 trillion in options expired today—heightened volatility expected.
-
Choppy, Unreliable Morning: Price action was erratic and hard to trust early, with David describing it as a “Capital Preservation Day.”
-
“The Chop is Real” and “Bull slipping on the soap” described the frustrating price action pre-noon.
-
-
VWAP Hovering: Much of the session hovered around VWAP, deterring conviction trades until afternoon momentum emerged.
-
@NQ Lagging: Nasdaq underperformed relative to the S&P, acting as a drag at times.
Lessons & Takeaways
-
Discipline Over Action: David emphasized sitting on hands and not forcing trades—especially critical on OPEX days known for odd rhythms.
-
Focus on Process, Not P&L: Multiple quotes and reminders to focus on systematic execution, not profit-chasing—“One trade adds one sample.”
-
Patience Paid Off: Waiting for structure and confirmation avoided unnecessary losses early and enabled catching the afternoon move.
Closing Remarks
-
The day showcased strategic restraint in the face of early chop, and tactical execution when the tape turned constructive.
-
David’s leadership in managing trader psychology and trade timing proved valuable, particularly in helping the room avoid common OPEX pitfalls.
-
A fitting wrap to the week with a late-session rally and clear levels respected.
DTG Room Preview – Monday, May 19, 2025
-
Macro & Trade Policy:
-
U.S.-China “deal” seen as a short-term truce; tariffs mostly paused, not removed.
-
Treasury Sec. Bessent warns tariff levels may return to “reciprocal” rates if talks fail.
-
Trump criticizes Walmart over pricing; WMT CEO says price hikes are a “worst case” scenario.
-
Trump continues public pressure on Fed Chair Powell to cut rates.
-
-
Monetary Policy:
-
Market expects two Fed rate cuts in 2025, possibly starting in July.
-
Cuts contingent on inflation easing or labor market weakness.
-
Moody’s downgrades U.S. sovereign credit rating over fiscal concerns.
-
-
Markets & Tech Leadership:
-
The “Magnificent 7” (incl. TSLA, NVDA, MSFT) solely responsible for 2025’s S&P 500 YTD losses.
-
Since May, these stocks have accounted for 60% of S&P gains.
-
TSLA, NVDA: +30% YTD
-
MSFT: +20% YTD
-
-
-
Earnings & Economic Calendar:
-
Earnings today: Ryanair (RYAAY) premarket, Trip.com (TCOM) after the bell.
-
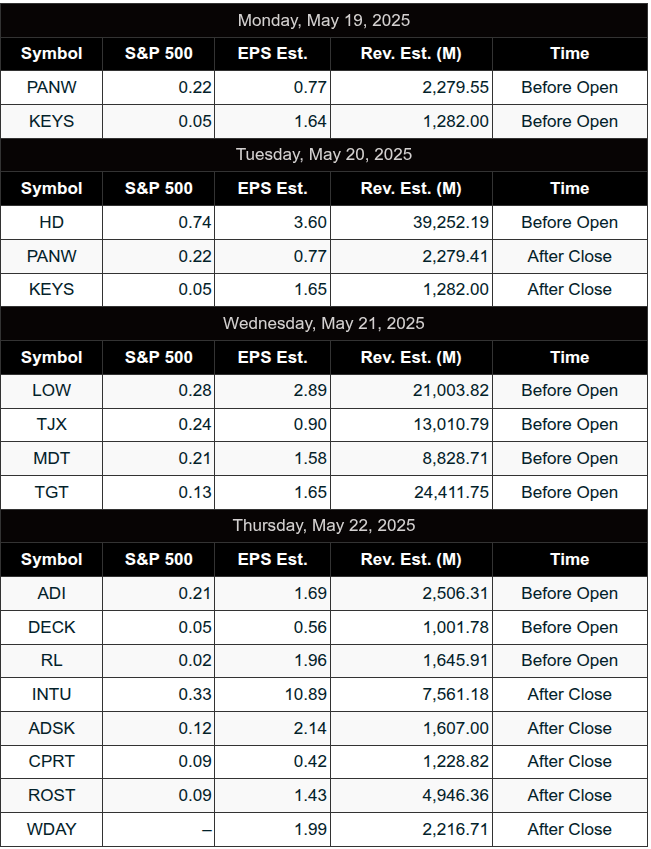
This week: Palo Alto Networks (PANW), Target (TGT), Home Depot (HD), Workday (WDAY).
-
Light economic calendar; key Fed speakers: Bostic, Williams, Jefferson, Logan.
-
-
Futures & Technicals:
-
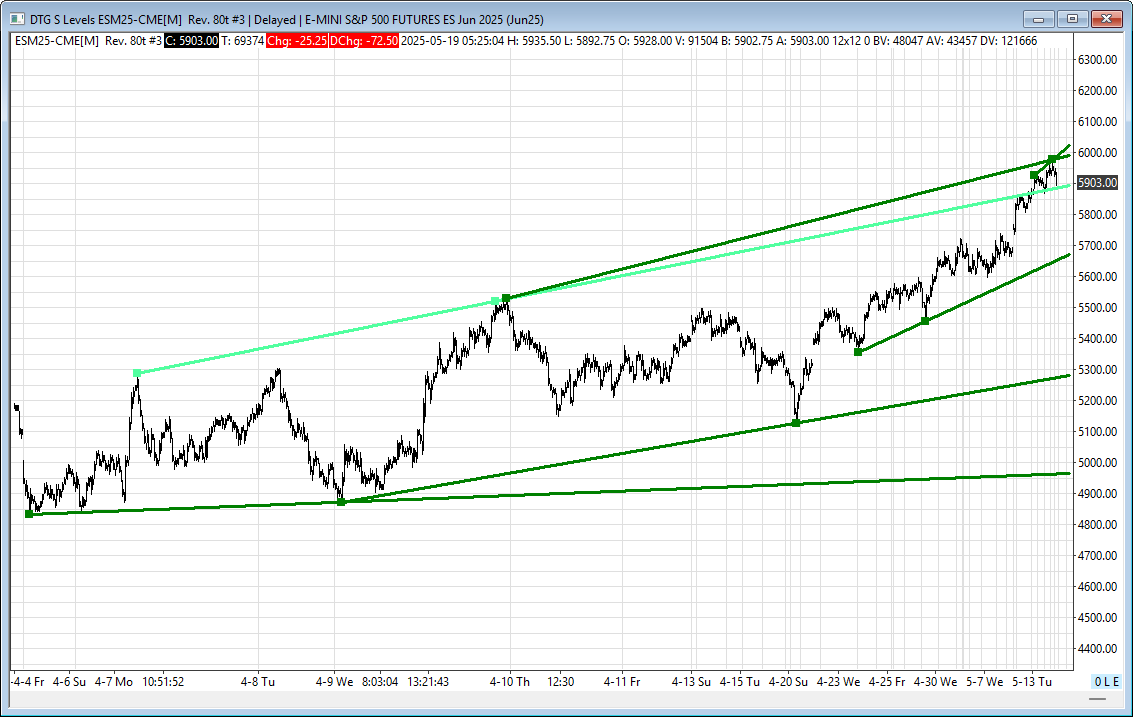
Overnight ES selloff confirms Friday’s HOD as a swing high.
-
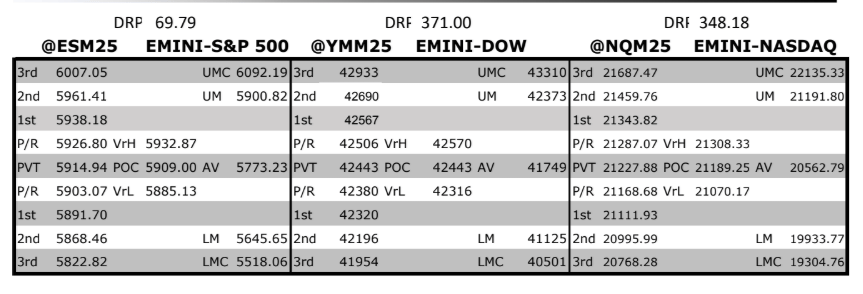
Key levels:
-
Support (TL Ss): 5891/96, 5665/70, 5281/86, 5104/99, 4955/80
-
Resistance (TL Rs): 5978/83, 6005/10
-
-
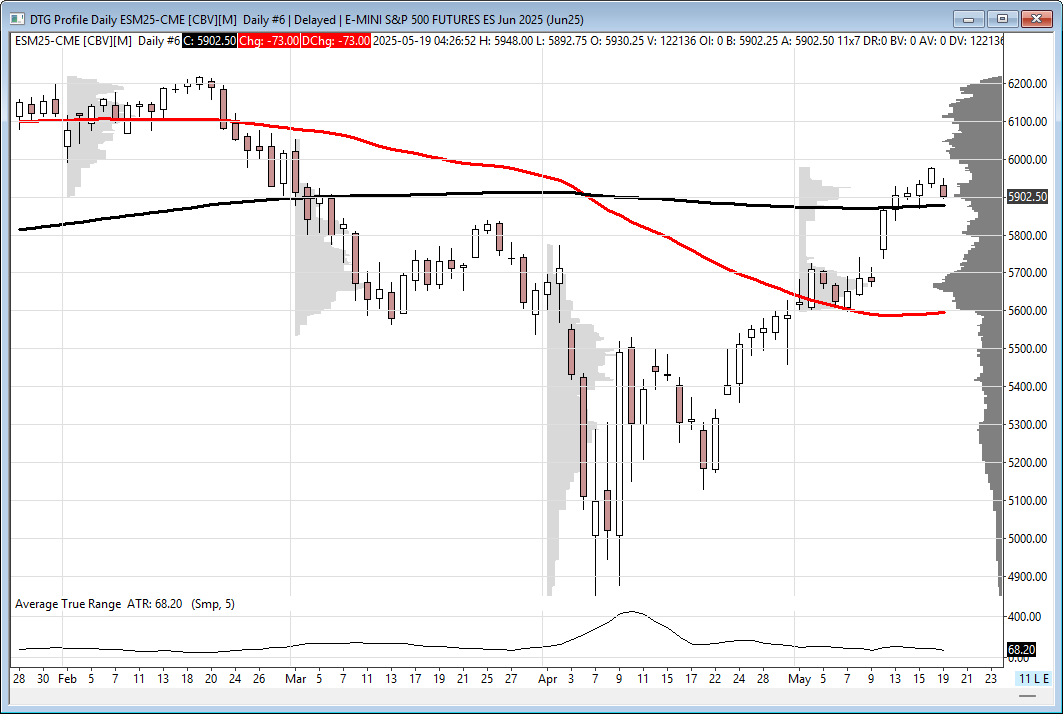
Former uptrend channel top (5891/96) acting as support; 200-day MA at 5877.75 in play.
-
Volatility remains elevated: 5-day avg. daily range is 91.25 points.
-
No significant whale bias overnight; volume light and mixed.
-
ES
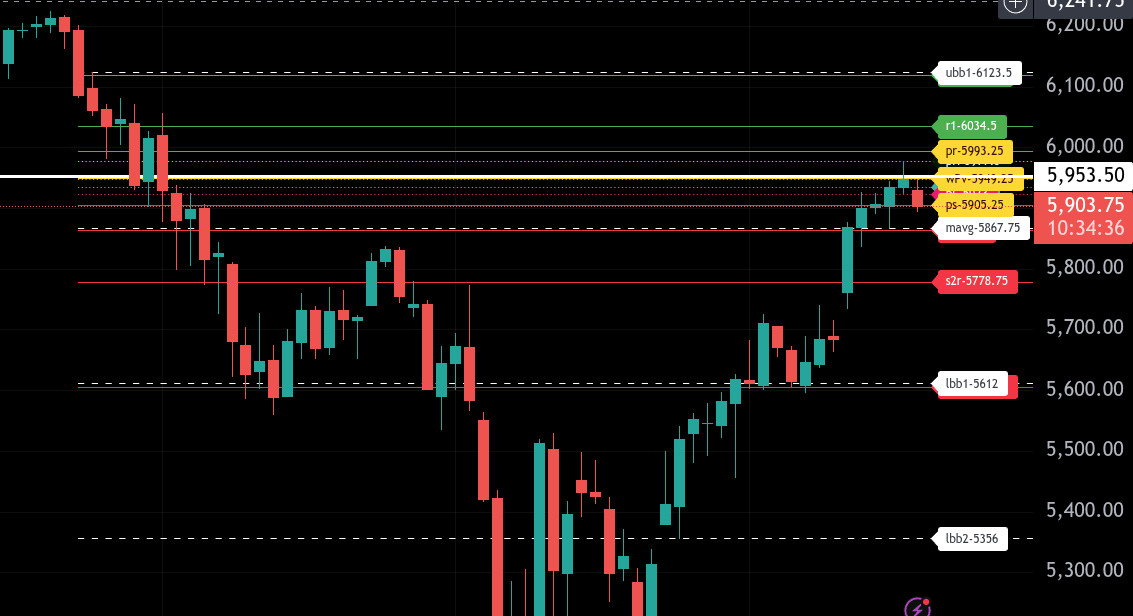
The bull/bear line for the ES is at 5949.25. This is the critical pivot that must be reclaimed for bulls to regain control of the tape. Price action overnight has hovered just below this level, suggesting indecision heading into the regular session.
Currently, ES is trading around 5900.25, clearly below the bull/bear line and reinforcing near-term bearish sentiment. If sellers maintain control, the downside focus is on 5905.25, the lower range target, followed by secondary support near 5867.75, which also aligns with the 1-day moving average. A decisive break below these levels could trigger further weakness toward 5820.00.
To recover the bull/bear line, buyers will have to climb over 5923 and 5935.
If buyers can reclaim 5949.25 and hold above it, look for upside resistance at 5977.50. A move through that level opens the door to test 5993.25, our intraday upper range target, with 6034.50 (r1) as the extended target above.
The trend remains vulnerable under 5949.25, and sustained trade below this pivot favors tactical selling on strength. A bullish tone can only be confirmed by acceptance above the bull/bear line with follow-through to 5993.25 and beyond.
NQ

The bull/bear line for the NQ is at 21,406.50. This is the key pivot level that must be reclaimed for buyers to regain control. Trading below this level keeps the tone bearish for now.
Currently, NQ is trading around 21,159.00, firmly below the bull/bear line. If sellers maintain pressure, the downside targets are 21,196.00 as the first lower intraday range level, followed by 20,997.80 as the broader lower range support. A break below 20,997.80 opens the door for further downside exploration.
On the upside, buyers will first need to recover 21,320.30 and then push through the bull/bear line at 21,406.50. If they succeed, upside targets are 21,512.00, and then 21,617.30, the upper range target for today. Stronger continuation above that could target resistance at 21,779.50 and the R1 level at 21,815.50.
Overall, the trend remains bearish below 21,406.50. Bulls must clear this level to shift sentiment and regain the advantage intraday. Until then, selling strength into resistance remains the higher probability strategy.
Calendars
Economic
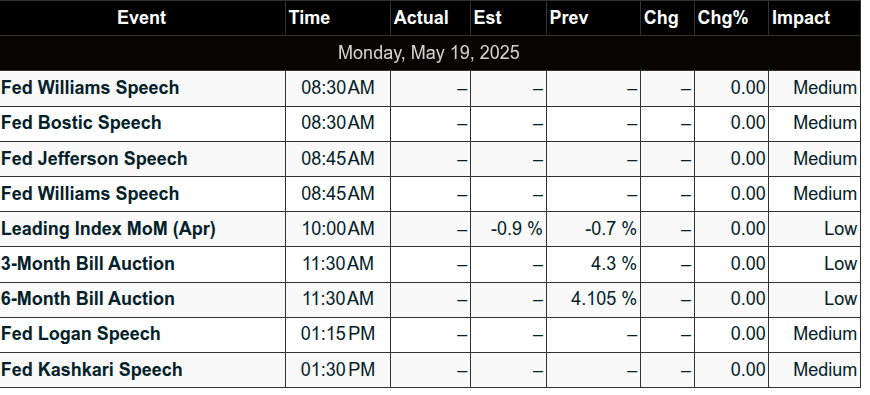
Important events for the rest of the week:
S&P 500 Earnings
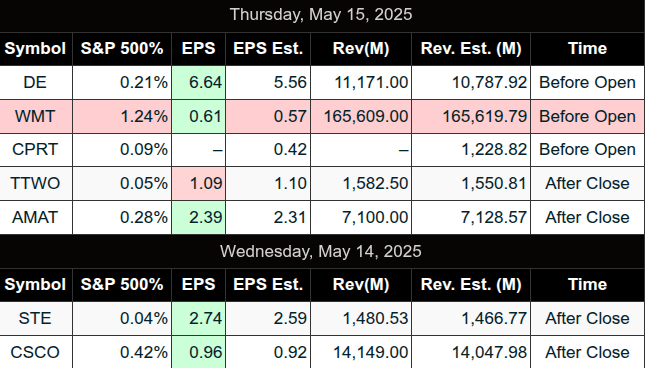
Recent
Affiliate Disclosure: This newsletter may contain affiliate links, which means we may earn a commission if you click through and make a purchase. This comes at no additional cost to you and helps us continue providing valuable content. We only recommend products or services we genuinely believe in. Thank you for your support!
Disclaimer: Charts and analysis are for discussion and education purposes only. I am not a financial advisor, do not give financial advice and am not recommending the buying or selling of any security.
Remember: Not all setups will trigger. Not all setups will be profitable. Not all setups should be taken. These are simply the setups that I have put together for years on my own and what I watch as part of my own “game plan” coming into each day. Good luck!
This post goes out as an email to our subscribers every day and is posted for free here around 2 PM ET. To get your real-time copy, sign up for the free or premium version here: Opening Print Subscribe.
Comments are closed