This post goes out as an email to our subscribers every day and is posted for free here around 2 PM ET. To get your real-time copy, sign up for the free or premium version here: Opening Print Subscribe.
From Davos to the Dome: One Truth Social Post Lit a 100-Handle Fuse
Follow @MrTopStep on Twitter and please share if you find our work valuable!
Our View
I think we live in a world of “expect the unexpected,” and yesterday’s headlines were exactly that. I said many times that Trump had backed himself into a corner. With Tuesday’s impromptu 90-minute, off-the-wall news conference, everything came to a head during his speech at the World Economic Forum in Davos, Switzerland.
When he said he would not attack or try to take over Greenland, the index markets rallied hard. But it wasn’t until 2:27, when Trump took to Truth Social, that he said:
“We have formed the framework of a future deal with respect to Greenland.”
He added that he would no longer impose fresh tariffs on several European countries he had previously singled out for opposing his Greenland takeover. The ES was trading around 6858 and rallied up to 6945.25 — a near 100-point rally in 22 minutes.
I have seen a lot of big moves, but that totally took people by surprise.
I don’t know if the surprise rally was a “relief rally” or a “de-risking bounce” — either way, a lot of shorts got stuck chasing the market’s high both early in the day and late in the day. The pop in the ES was the largest percentage gain since November and debunked tariff turmoil and the “Sell America” trade, lowering the VIX from above 20.50 on Tuesday to a low of 16.77 yesterday.
I think the big question is: does Trump have the NATO deal he announced, or is it just another Truth Social headline?
Critics call Trump’s Greenland “framework” announcement classic Trump: escalate a self-made crisis with threats, then back off while claiming victory and portraying allies as having acquiesced. In reality, NATO stresses ongoing collective Arctic security efforts by the seven Arctic Allies, with no surrender to his demands for ownership or sovereignty transfer. Denmark and Greenland remain firm — no sale, no forced handover — while talks led by Vance/Rubio aim for enhanced U.S. access under Danish control.
The tariff rollback stems from pushback and market relief, not capitulation. It’s diplomacy after brinkmanship, not triumph, with the core status quo intact and real negotiations still ahead.
Our View
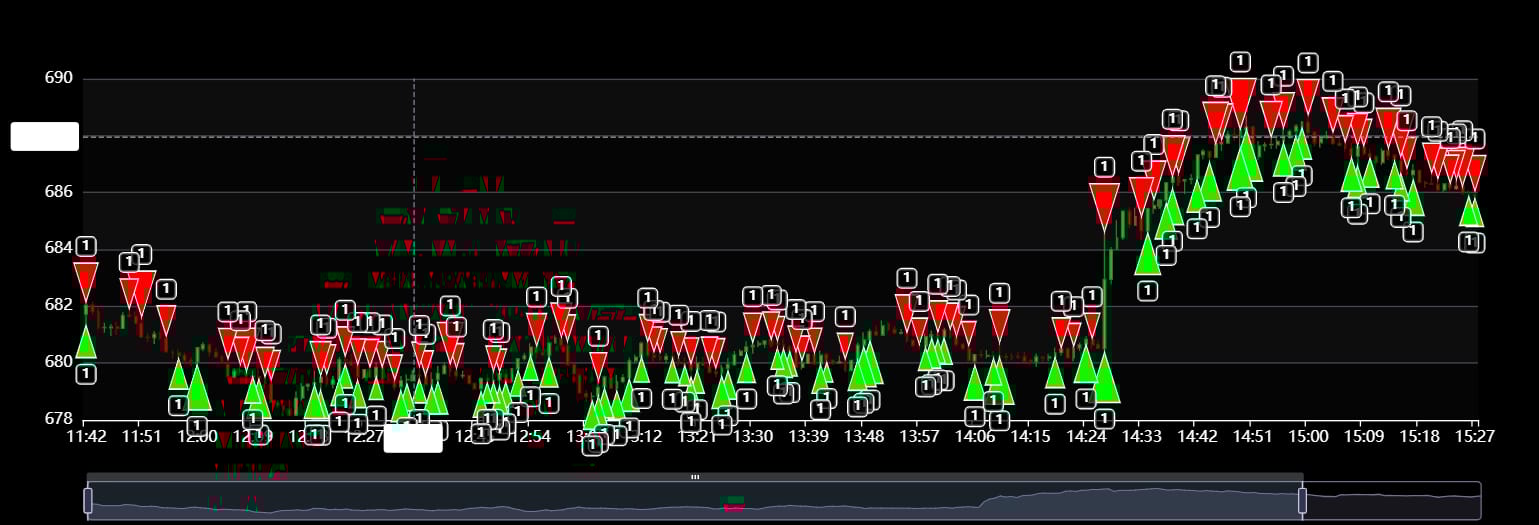
SPYGATE started showing early buy programs, and to me, that was an early clue. The ES traded down to 6837.25 at 12:15, rallied again, and traded down to 6842.50 at 1:00 and 6855.00 at 2:15, just before the late headlines.
Today will be a test of my trading rule that it takes days and weeks to knock the ES down and only one to bring it back. I said in the MTS forum that I thought, based on the way the ES closed, it would be up on Globex — but this morning we have the PCE number at 10:00 and the TSLA earnings after the close. Both will be market-moving events.
I felt strongly that after yesterday’s open, and told the MTS chat the ES could rally. I pointed out that the crowd was short:
IMPRO:Dboy:[9:23:48 AM]: Trump trying to cool things down?
IMPRO:Dboy:[9:37:57 AM]: rally day
IMPRO:Dboy:[9:50:26 AM]: see spy gate
That was showing numerous buy programs.
Our Lean
Today is the Thursday before Week 3 options expiration, and while I can’t rule out some drops, I think they could get bought. The ES 6850, 6830, and 6812 are key.
Levels
#
Type
Level Range
1
Resistance
6,985 – 7,015
2
Resistance
6,960 – 6,970
3
Resistance
6,930 – 6,940
4
Resistance
6,905 – 6,915
5
Support
6,880 – 6,890
6
Support
6,850 – 6,865
7
Support
6,810 – 6,830
8
Support
6,770 – 6,790
9
Support
6,710 – 6,730
10
Support
6,650 – 6,675
Guest Posts:
Dan @ GTC Traders
The GTC Sample Portfolio … 2025 and 2026
We thought that for this week and the next two weeks we could look over the GTC Sample Portfolio as a whole, consider its individual programs, how things performed in 2025 according to what we were looking to accomplish, and then our thoughts for 2026
Our Take and The GTC Sample Portfolio as a Whole in 2025
So what was our goal for our GTC Sample Portfolio in 2025? As we have stated repeatedly … given our thoughts regarding the larger ‘macro’ environment in which we are trading … we have tuned all of our programs away from absolute returns, to that of linear returns. For those of you who are new to markets? This means that we are developed enough that we know how to determine ahead of time what the ‘shape’ of our return series will aim for. “Linear” returns do not concern themselves as much with higher alpha, but rather … consistent profits and low drawdowns. “Absolute” returns, aim for high alpha with an understanding that larger drawdowns may appear. We know how to ‘tune’ our programs such that they will give us either type of returns.
Yes, we do believe that we are currently in a bubble in Equity markets, for reasons that we have already outlined here and for our premium members. And as such, our thought is that if we can aim for linear returns, if a larger correction is on the way, we will be well positioned to not only survive? But thrive in that environment with consistent returns.
After all, Buffett outperformed through the dot com crash. But he still suffered pretty significant drawdowns from 1998 to 2001 …
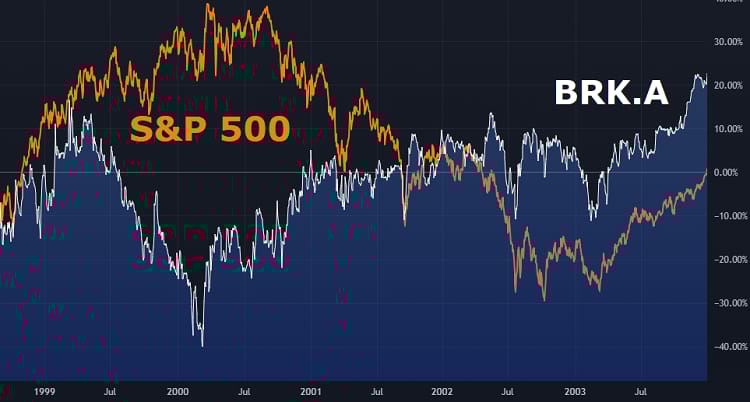
If we can print linear returns through a market that we believe to be in a bubble? We are that much more ahead of the game than Buffett was in 2000.
So how did we do?
We believe we have been a bit early to the game … but that is exactly why we positioned our programs to aim for linear returns. And that is what we have done.
Regardless of the percentile return, it is common to see drawdowns that are three times his annualized return. If they have annualized returns of 25%? It is not uncommon to see drawdowns of -75% over time. If they have annualized returns of 10%? It’s quite usual to see drawdowns of -30%.
A pretty good trader can get his drawdown down to two times the annualized return.
An amazing trader, you may see drawdowns that are 1x his annualized return. So, if his returns are 10%? His drawdowns are -10%.
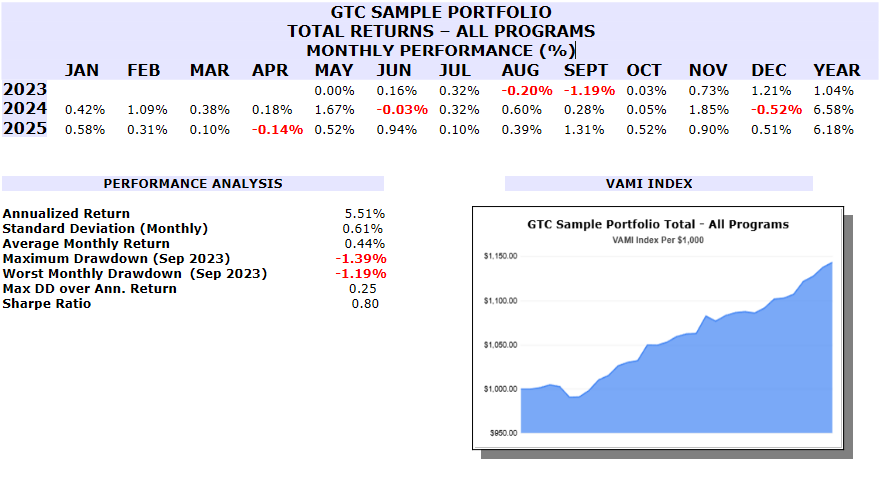
The GTC Sample Portfolio as a whole over the last 2 ½ years has drawdowns that are 0.25, its annualized return. With an elevated RFR (to make things difficult for ourselves, we use the highest RFR available at any moment in time, which has varied in the front of the curve), we have achieved a Sharpe Ratio of 0.80. If we ‘used more generous assumptions’ as some do, we would have a Sharpe over 1.0.
So yes … we have hit our goal of linearity.
Looking Ahead to 2026
We see no reason to change our outlook.
We believe we are in a measurable equities bubble. That is our belief. And for that reason, our gamble … is that we have tuned our programs such, that they will seek to achieve linear returns.
It is insanely difficult to time crashes. You will see people try to short a market which is ‘up’. We believe that to be foolish. In the extreme. You see such people routinely get smashed again and again, as the market heads higher. We have no idea when the day of reckoning will come. None whatsoever. But we are positioned to continue to print linear returns, despite how the S&P 500 Index performs.
For premium members, we will soon outline what one could do to achieve greater alpha (and thus risk greater drawdowns), if they hold a different belief. Our gamble is that it will not continue.
And thus, as we look ahead to 2026, we will continue to seek the linear returns we have been seeking.
The Sum of Program Returns
Remember that the above returns are the result of multiple models, working in tandum to produce three different trading programs. Some programs have actually performed better than the above total portfolio. Some, a bit less.
In future weeks, we will examine those models and programs, and their performance.
Market Recap:
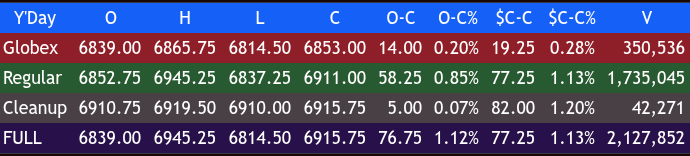
The ES traded down to 6814.50 on Globex and rallied up to 6865.75 as President Trump spoke to the World Forum. It opened at 6852.75, up 29 points or +0.20%. After the open, the ES traded 6847.25, rallied up to 6863.50, pulled back down to a new low at 6845.50, then rallied up to 6888.75 at 10:05.
It pulled back to 6872.75, rallied up to a new high at 6891.00 at 10:15, pulled back to 6867.75, and then rallied up to 6908.75 at 10:55. After the morning high, the ES sold off down to 6837.25 at 12:15, rallied up to 6853.50, then sold off down to a high low at 6846.25. It rallied up to 6871.75 at 1:50, sold back off down to 6855.75 at 2:08, and then totally ripped up to 6924.75 after #Trump:
“We have formed a framework of a future deal with respect to Greenland. Will not be imposing tariffs that were scheduled to go into effect on February 1st. Additional discussions are being held concerning golden dome as it pertains to Greenland.”
After the high, the ES sold off down to 6904.25 at 3:31, then rallied up to 6918.50 at 3:38, sold back off down to 6908.50 at 3:46, rallied up to 6913.50 and traded 6912.25 as the 3:50 imbalance showed $2 billion to sell closing out the regular session at 6910.75. After 4:00, the ES hit 6919.50 and settled at 6917.75, up 86.25 points or 1.26%. The NQ settled at 25,509.50, up 380.25 points or +1.51%, the YM settled at 49,281.00, up 615 points or +1.26%, and the RTY settled at 2,712.10, up 53.40 points or 2.01% on the day.
In terms of the ES’s overall tone, it was hot and cold and then hot again. In terms of the ES’s overall trade, volume was steady at 1.74 million contracts traded.
On Tap
Thursday 1/22
-
$BA and $LMT report earnings before the open
-
Initial Jobless Claims and GDP (first revision)
-
10:00 am – Personal Income and Spending (delayed report), PCE Index (delayed report)
-
$TSLA reports after the close
Friday 1/23
-
9:45 am – S&P Flash U.S. Services PMI
-
10:00 am – Consumer Sentiment (final)
MiM
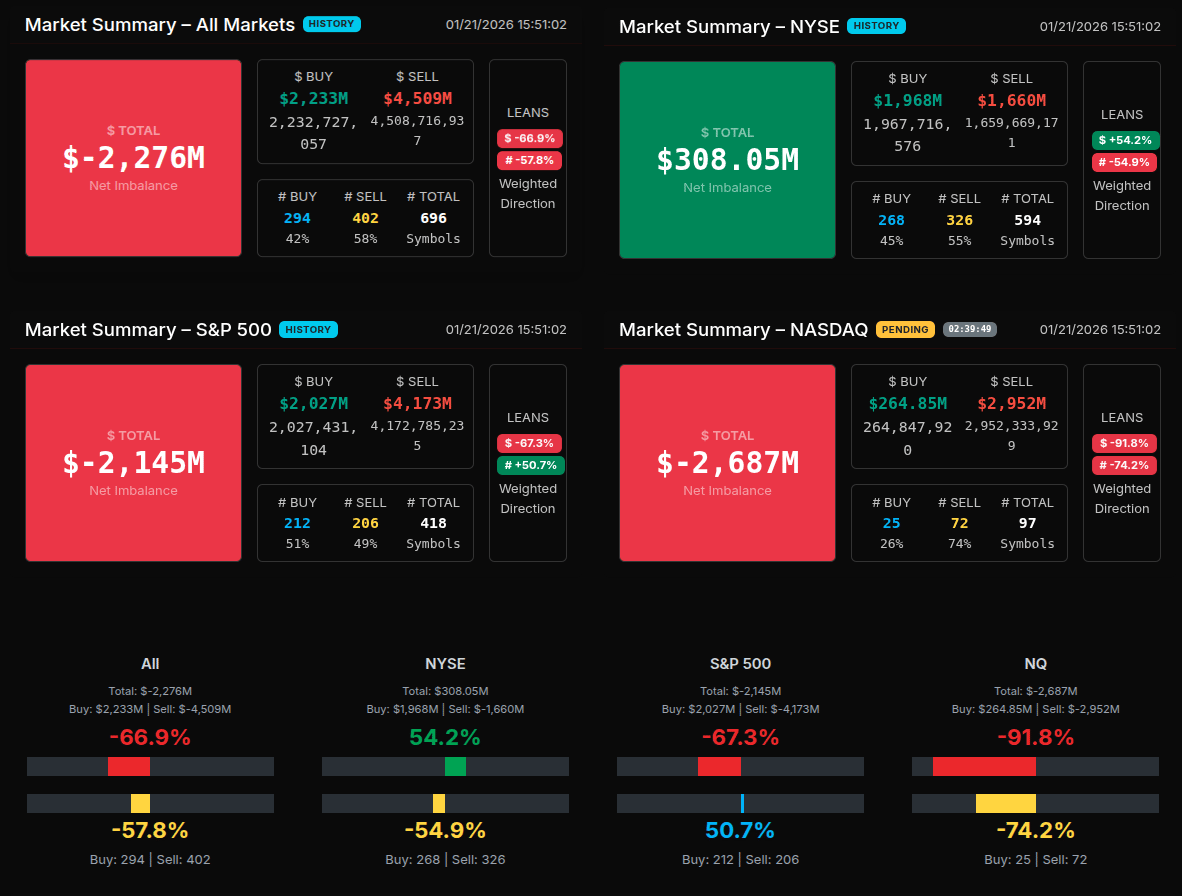
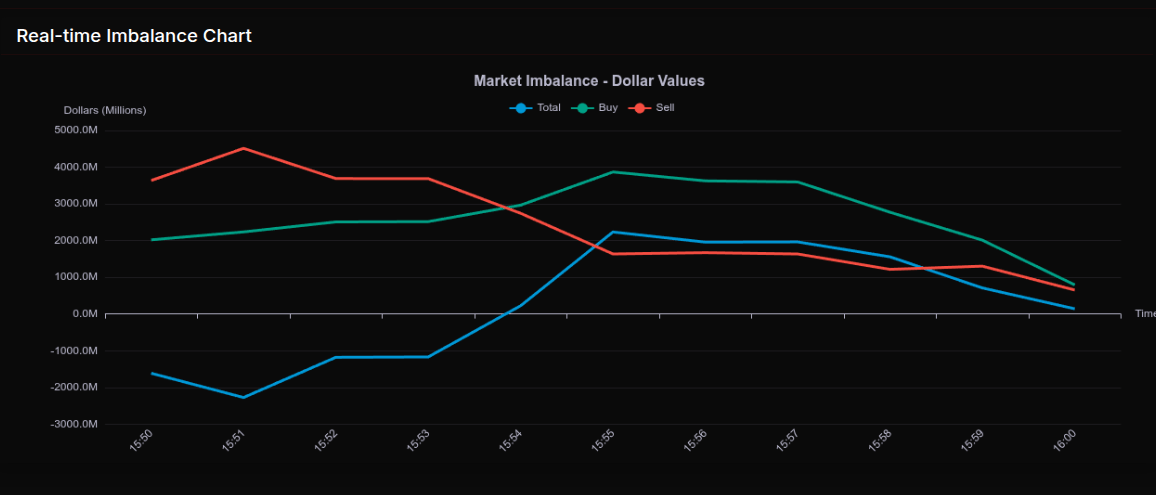
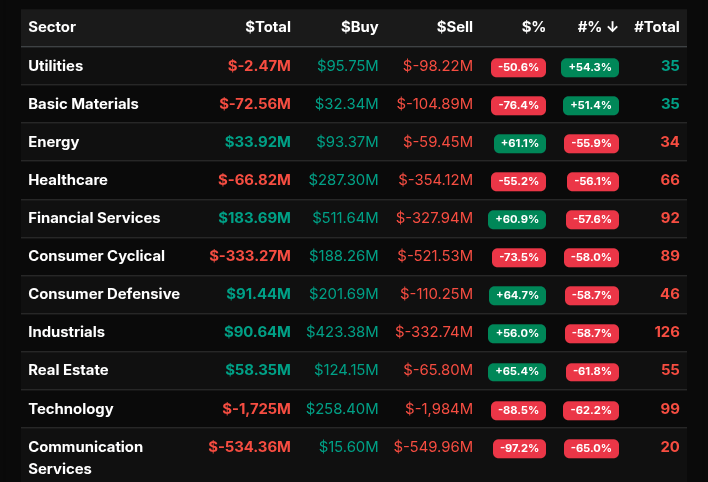
The Market-on-Close (MOC) auction opened with a heavy sell imbalance and stayed pressured through the early snapshots before a sharp late rotation altered the tape. At 15:50–15:53, total imbalance deepened from roughly -$1.6B to -$2.3B, with sell pressure dominating and dollar-weighted leans near or beyond the -66% threshold—signaling wholesale selling rather than simple rotation. As the auction progressed, buy programs accelerated into 15:54–15:57, flipping the dollar imbalance positive briefly and pushing buy-side dollar flow toward $3.8B–$3.9B. The close settled with a modest residual imbalance, reflecting late-day rebalancing rather than sustained accumulation.
Sector behavior was bifurcated. Technology and Communication Services carried the most pronounced sell leans, with Technology registering an extreme negative lean near -88% and Communication Services approaching -97%, both indicative of broad-based institutional selling. Consumer Cyclical also showed a strong sell skew (approximately -74%), reinforcing risk-off behavior into the close. In contrast, Financial Services, Energy, Industrials, Real Estate, and Consumer Defensive posted positive dollar leans above +60%, consistent with rotation and index-related balancing rather than outright risk-on demand. Utilities and Basic Materials leaned negative, though closer to the -50% area—more rotational than wholesale.
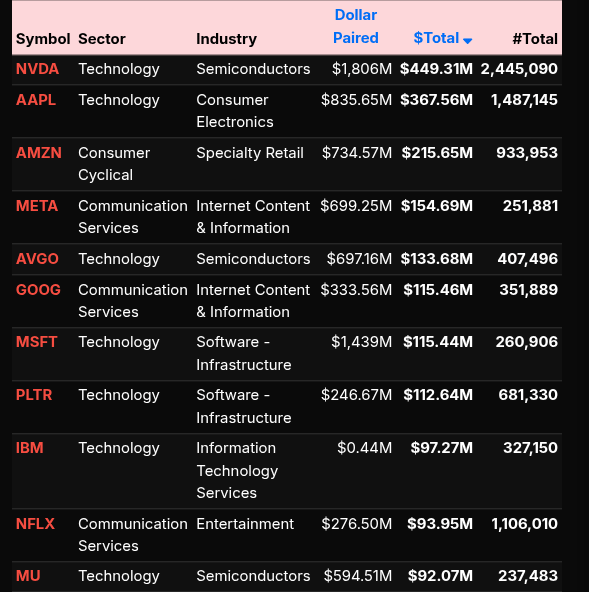
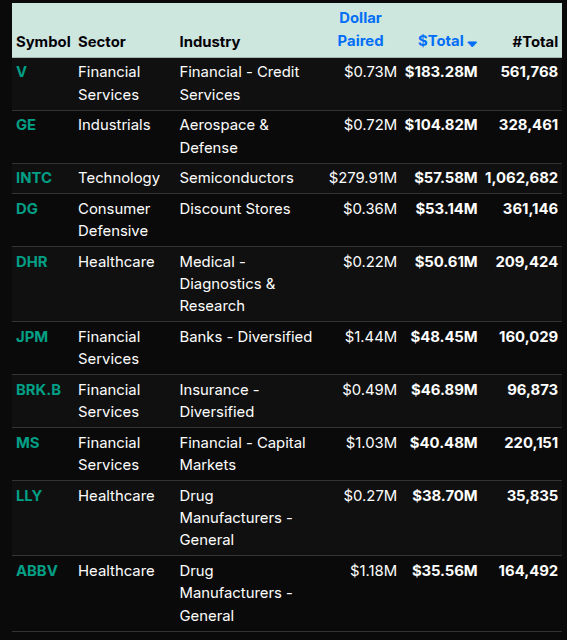
Single-name flows were concentrated in megacap technology and index bellwethers. NVDA and AAPL led total dollar volume, followed by AMZN, META, AVGO, GOOG, and MSFT—confirming that index and ETF rebalances drove much of the auction. Financials such as V, JPM, BRK.B, and MS also attracted notable buy-side interest, aligning with the sector-level rotation.
Index-level outcomes diverged. NYSE closed with a net buy imbalance, while the S&P 500 and especially the NASDAQ finished with significant sell leans, the NASDAQ near the -90% threshold—clearly a wholesale sell signal. Overall, the MOC reflected late rebalancing and factor rotation out of growth-heavy technology into defensives and financials, rather than a clean directional close.
Technical Edge
Fair Values for January 22, 2026
-
S&P: 32.63
-
NQ: 139.46
-
Dow: 172.79
Daily Breadth Data 📊
For Wednesday, January 21, 2026
• NYSE Breadth: 72% Upside Volume
• Nasdaq Breadth: 69% Upside Volume
• Total Breadth: 70% Upside Volume
• NYSE Advance/Decline: 79% Advance
• Nasdaq Advance/Decline: 69% Advance
• Total Advance/Decline: 73% Advance
• NYSE New Highs/New Lows: 250 / 35
• Nasdaq New Highs/New Lows: 375 / 172
• NYSE TRIN: 1.59
• Nasdaq TRIN: 1.00
Weekly Breadth Data 📈
For the Week Ending Friday, January 16, 2026
• NYSE Breadth: 53% Upside Volume
• Nasdaq Breadth: 57% Upside Volume
• Total Breadth: 53% Upside Volume
• NYSE Advance/Decline: 63% Advance
• Nasdaq Advance/Decline: 54% Advance
• Total Advance/Decline: 57% Advance
• NYSE New Highs/New Lows: 481 / 62
• Nasdaq New Highs/New Lows: 754 / 290
• NYSE TRIN: 1.50
• Nasdaq TRIN: 0.89
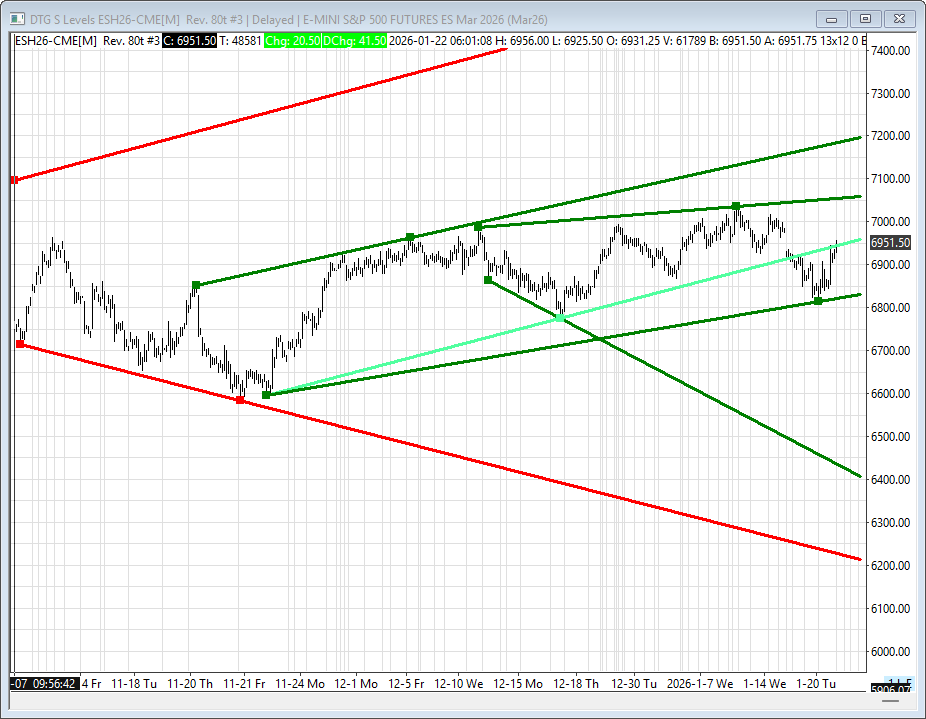
BTS Levels:
ESH2026
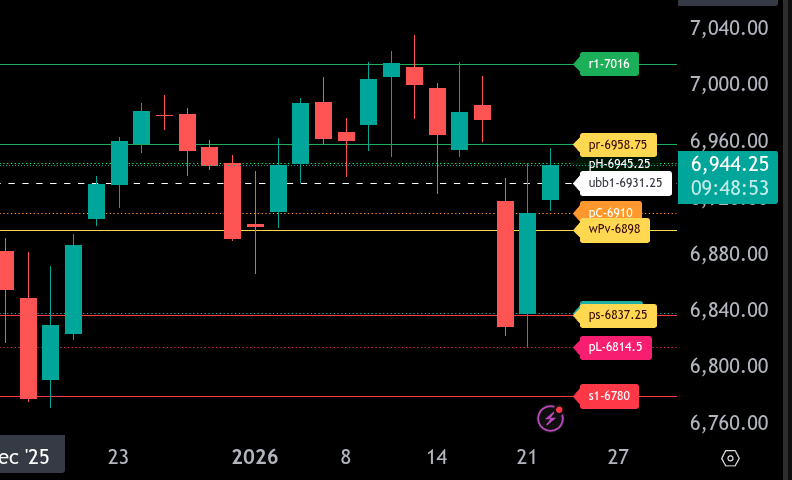
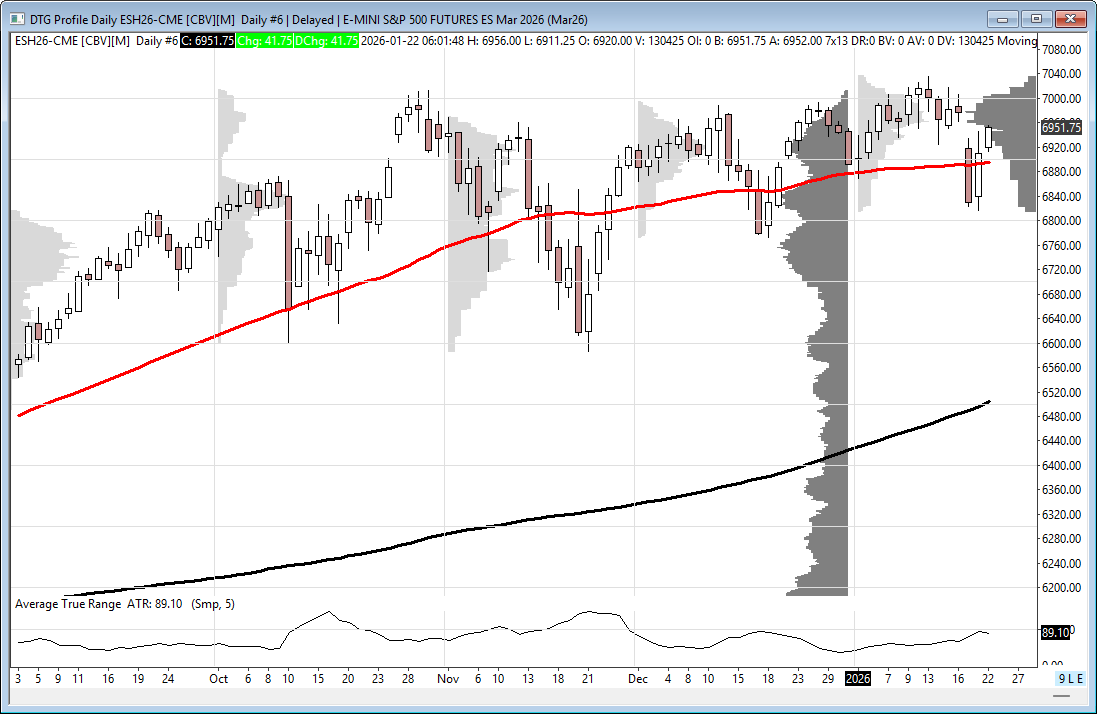
The bull/bear line for the ES is at 6898.00. This remains the key pivot for directional bias. Below this level, ES remains under bearish pressure, and rallies are likely to be sold.
Globex trade pushed sharply lower before stabilizing, with current price trading near 6943.75. This places ES above the previous high pivot at 6945.25 (pH) but still below key resistance. Acceptance above 6958.75, the upper range target, is required to improve structure and target 7016.00.
On the downside, initial support is at 6931.25. Failure to hold this level puts focus back on 6910.00 and the bull/bear line at 6898.00. A decisive break below 6898.00 opens the door to 6837.25, with further downside toward 6814.50. In a deeper liquidation scenario, 6780.00 is the next major downside reference.
Overall, ES remains fragile below 6898.00. Bulls need sustained acceptance above 6958.75 to shift momentum higher. Failure to reclaim the bull/bear line keeps the path of least resistance lower and favors sell-the-rally conditions.
NQH2026
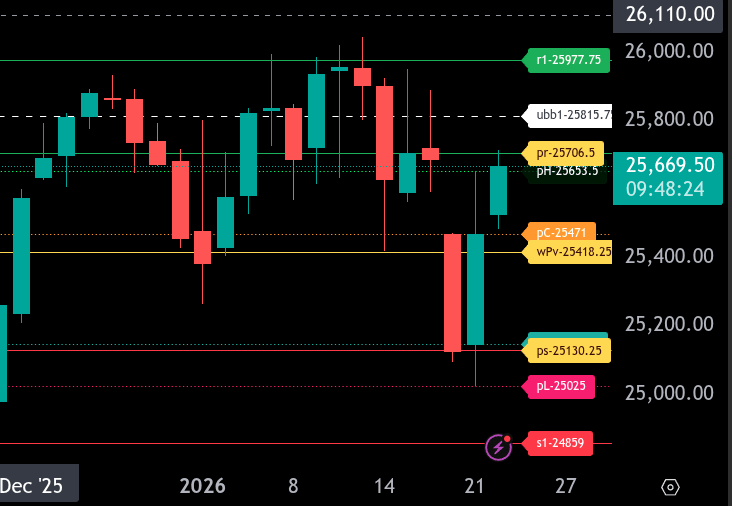
The bull/bear line for the NQ is at 25,418.25. This is the key pivot for today and defines directional bias.
NQ is currently trading around 25,672.00, holding above the bull/bear line. As long as price sees acceptance above 25,418.25, buyers retain control and dips into this zone may attract responsive buying.
On the downside, initial support comes in at 25,653.50, followed by 25,471.00. Failure to hold the bull/bear line opens the door to a move toward 25,149.50 and then 25,130.25, which is the lower range target for the session. A sustained break below this area increases risk toward 25,025.00 and potentially 24,859.00.
On the upside, resistance is defined at the upper range target of 25,706.50, with the next target sitting at 25,977.75. If price can reclaim and hold above 25,706.50, continuation toward the upper range target becomes likely.
Overall, the bias remains bullish above 25,418.25. A loss of this level shifts the tone back to neutral-to-bearish and favors rotation toward the lower range targets.
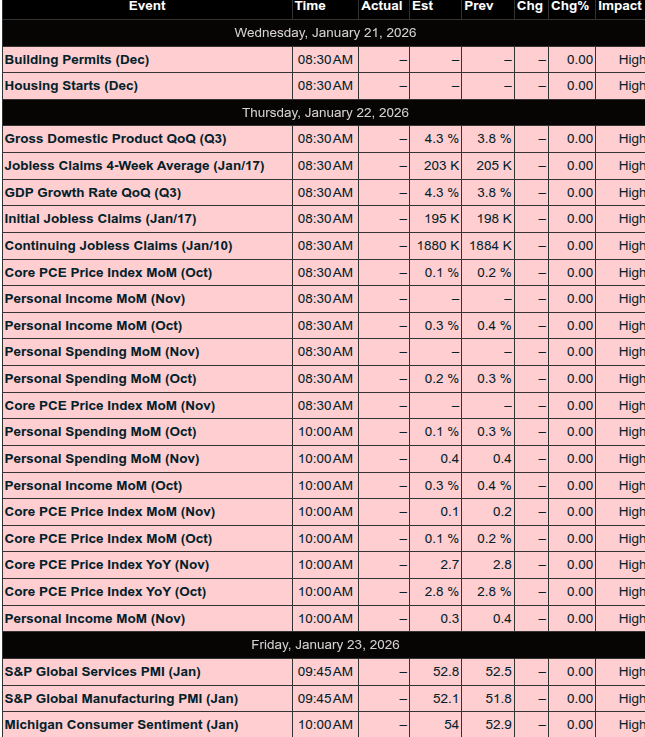
Economic Calendar Today
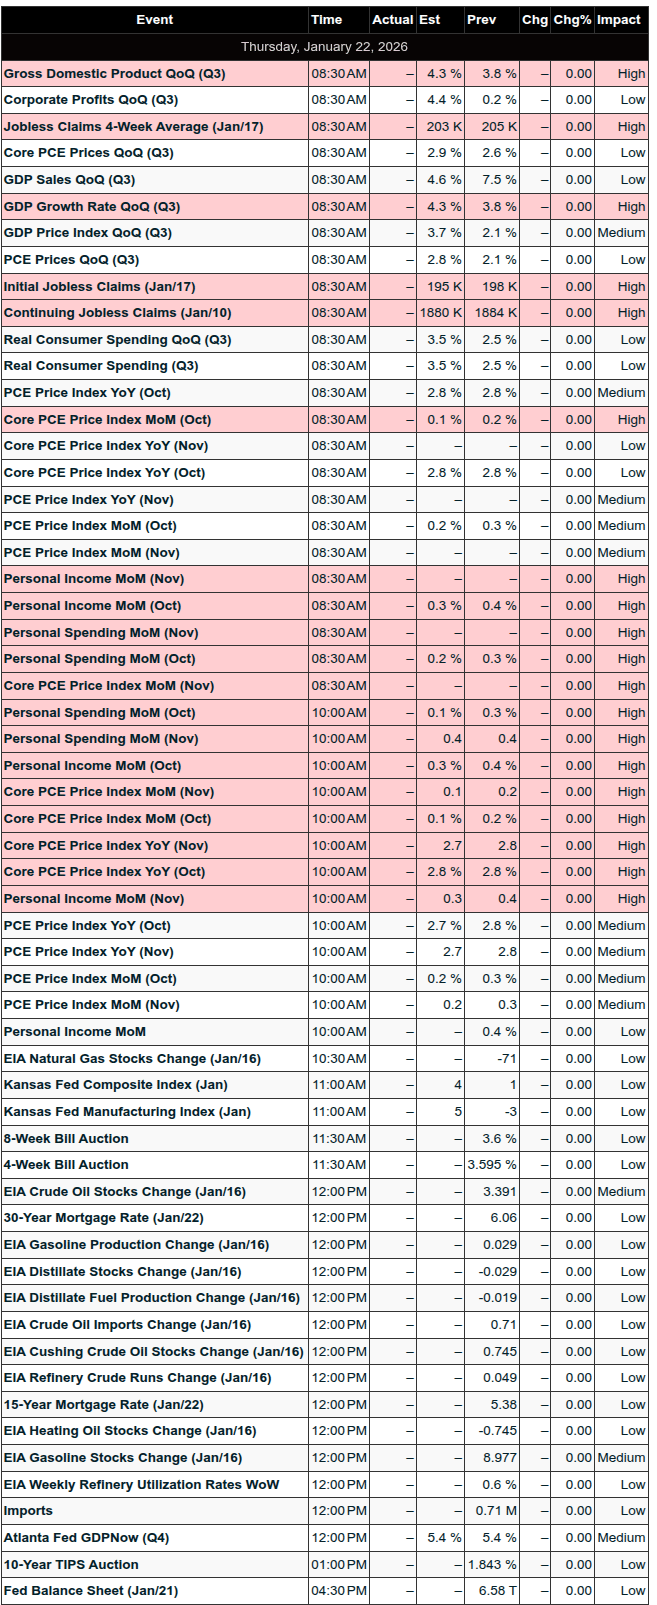
This Week’s High Importance
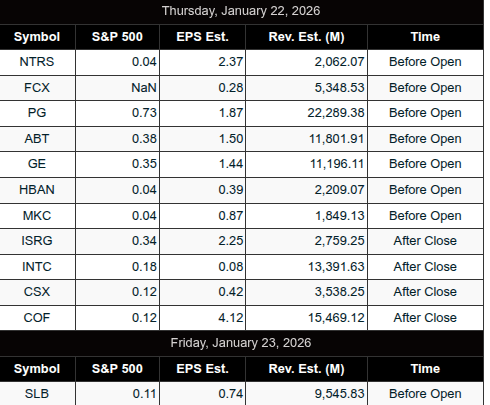
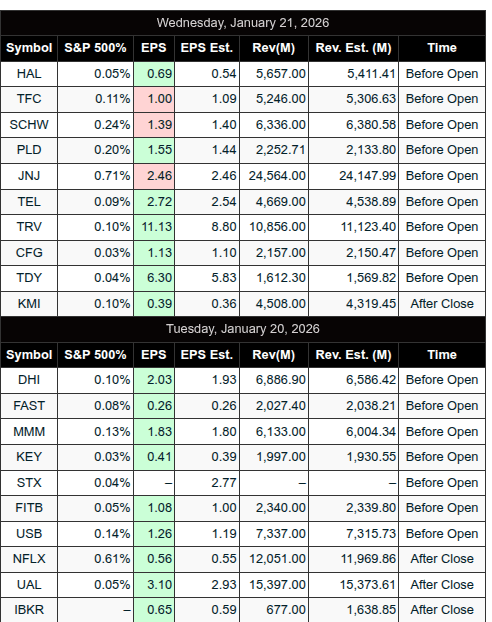
Earnings:
Recent
Trading Room News:
PTG Room Summary – Wednesday, January 21, 2026
Despite a rocky technical start to the day with chart and audio issues, the PTG trading room executed a textbook Cycle Day 3 (CD3) session. David guided the room through a volatile but highly profitable short-squeeze rally that fulfilled multiple key upside targets. The day’s strategy, rooted in the DTS framework, played out with precision, providing valuable trading lessons and reinforcing the reliability of the PTG methodology.
Morning Technical Issues:
-
The session began with media disruptions — no charts or audio available due to system issues.
-
David kept the room calm and engaged, joking “we’ll wing-ding it today,” and still provided trade strategy insights and posted key charts via links.
Trade Strategy & Execution:
-
Key Level of the Day (LIS): 6845
-
Cycle Day 3 Bull Scenario: Holding above 6845 targeting 6865 → 6875 → 6885 → 6887.50 (CD1 low recovery)
-
Bear Scenario: Below 6845 targeting 6830 → 6825 → 6820
Trade Highlights:
-
Market held above LIS early, and David stayed long-lean on dips.
-
Targets 6865, 6875, and 6885 were all hit, confirming the strength of the bull case.
-
Final CD1 recovery target of 6887.50 was fulfilled by 10:17 AM, marking a successful completion of the 3-Day Cycle Statistic (92%).
-
NQ also confirmed strength, traversing from Lower to Upper DLMB.
-
This was a classic short squeeze, as predicted in the DTS report. David emphasized that the squeeze was “waiting to catch latecomers,” a key lesson in recognizing market positioning.
Afternoon Continuation:
-
After a midday range pullback to 6850–6860s, the market got a fresh boost from “positive news on Greenland.”
-
Price ripped to tag the @ES DL level of 6929.25, and the Upper Money Box was fulfilled.
-
Bulls were tasked with holding a backtest of PH 6916.50 into the close.
Lessons & Takeaways:
-
Preparation Pays Off: Despite no A/V, the pre-market plan guided the session perfectly, emphasizing the importance of strategy over signals.
-
Respect the Cycle Stats: The 92% 3-Day Cycle stat played out yet again — a reminder of how powerful these patterns can be.
-
Recognize the Squeeze Setup: David called out the potential for a “monster short squeeze,” and the market delivered. A great reminder to avoid chasing late shorts and to understand sentiment extremes.
-
Stay Flexible During Tech Issues: The room stayed professional and productive even without live tools — a testament to trader discipline and clear leadership.
Final Notes:
-
Morning target structure was fulfilled early, allowing traders to lock in gains and reduce risk midday.
-
Afternoon continuation rewarded those who stayed engaged.
-
Charts and A/V were restored in the afternoon, thanks to Marlin’s efforts.
DTG Room Preview – Thursday, January 22, 2026
Key Themes:
Markets are digesting Trump’s Greenland tariff reversal, AI-related earnings, and a packed economic data calendar. PCE, GDP, and earnings from major players are central to today’s narrative.
Overnight Action:
US equity futures are higher after President Trump called off proposed Greenland tariffs, citing a new framework with Secretary General Mark Rutte. Despite Wednesday’s heavy volatility, major indexes remain down on the week.
AI & Chip Sector in Focus:
-
Intel (INTC) reports after the bell—expectations are high amid global memory shortages and AI chip demand.
-
Alibaba to IPO its AI chip unit T-Head, challenging Nvidia’s (NVDA) dominance in AI accelerators.
-
At Davos, energy use by AI data centers is a major concern. Trump pledged a domestic infrastructure push as demand for power surges.
-
Goldman Sachs projects global data center power demand rising from 55GW to 84GW in two years. Nvidia’s Huang emphasized the trillions still needed in infrastructure buildout.
Earnings Watch:
-
Premarket: ABT, FCX, GE, PG, HBAN, MKC, NTRS, ORI
-
After-hours: AA, COF, CSX, INTC, EWBC, ISRG, SSB
-
Friday Premarket: BAH, ERIC, SLB
Economic Data:
Watch for Core PCE (Oct & Nov), GDP (delayed), Unemployment Claims, Personal Income/Savings, and Crude Oil Inventories (12pm ET due to Monday holiday).
Market Technicals (ES Futures):
-
Strong rebound Wednesday formed a new swing low; reclaimed 50-day MA (6896), which is now support.
-
Key Resistance: 6947/50s, 7057/60s, 7198/03s
-
Key Support: 6826/29s, 6410/05s, 6210/05s
-
Volatility may ease if S&P continues upward, but big intraday swings remain a risk.
Bottom Line:
Markets are riding a rebound wave after geopolitical easing and ahead of heavyweight earnings. AI and infrastructure themes dominate the macro conversation.
Affiliate Disclosure: This newsletter may contain affiliate links, which means we may earn a commission if you click through and make a purchase. This comes at no additional cost to you and helps us continue providing valuable content. We only recommend products or services we genuinely believe in. Thank you for your support!
Disclaimer: Charts and analysis are for discussion and education purposes only. I am not a financial advisor, do not give financial advice and am not recommending the buying or selling of any security.
Remember: Not all setups will trigger. Not all setups will be profitable. Not all setups should be taken. These are simply the setups that I have put together for years on my own and what I watch as part of my own “game plan” coming into each day. Good luck!
This post goes out as an email to our subscribers every day and is posted for free here around 2 PM ET. To get your real-time copy, sign up for the free or premium version here: Opening Print Subscribe.
Comments are closed