This post goes out as an email to our subscribers every day and is posted for free here around 2 PM ET. To get your real-time copy, sign up for the free or premium version here: Opening Print Subscribe.
Too Many Longs, Not Enough Fear — And 7000’s Still Whispering
Follow @MrTopStep on Twitter and please share if you find our work valuable!
Our View
The late selling was normal based on how much the ES has rallied in the last 24 hours. If I have any concerns, it would be that the ES has rallied over 135 points in 24 hours.
Our Lean
Yesterday’s gap-up saw what I call a double pump, meaning it sold off a little after the open, had a small pump higher, then sold off as the NQ weakened from the get-go. I know there were a lot of traders were thinking the ES could trade up to 7000.00, but it seemed like too many people got long into the rally.
Our lean: My feeling is we could see similar price action today: early rally, pullback, and then rally again into the Week 3 options expiration. I do not think all the shorts/hedges have covered, and if the ES can get above 6974 and hold, there is a good chance the ES can trade 7000.00 or higher today.
Guest Posts:

Get instant access to our partners’ real-time market data and insights not available anywhere else. Here is last night’s Founder’s note getting you ready for today’s market and explaining the constraints in yesterday’s market. – MrTopStep
Founder’s Note:
Futures are flat, with no major data releases scheduled.
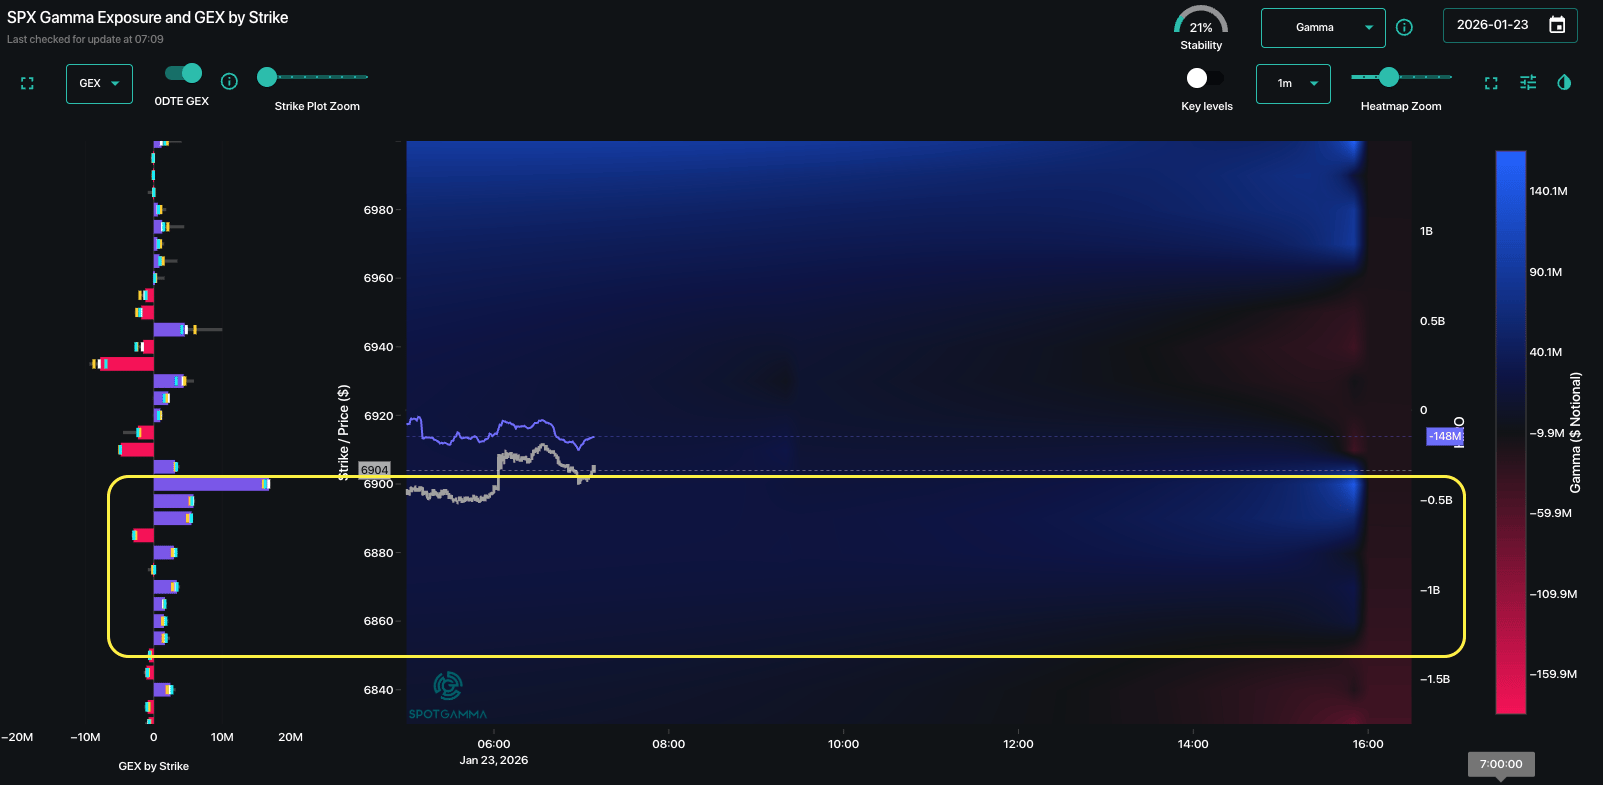
TLDR: We anticipate SPX holding 6,900 today and drifting back up into 6,920 (SPY 690). We have some of our key metrics signaling “risk ahead”, but we think thats more of a “next week think” vs a “today problem”. Having said that, we want to be leaning long of equities while SPX remains above our Risk-Pivot of 6,890.
There is painfully little to update on today, as the SPX has lodged itself back into the 6,900-6,950 box that dominated price action for most of January. It also seems that the SPX is unlikely to do anything different unless geopolitical tensions flare and/or until FOMC/major earnings initiate on Wed 1/28. Currently we do see positive gamma support layered below 6,900, and we think this dynamic is unlikely to change into the weekend. Conversely, we don’t see much reason for the SPX to break above 6,950, not only for today but thats likely a cap into Wednesday.
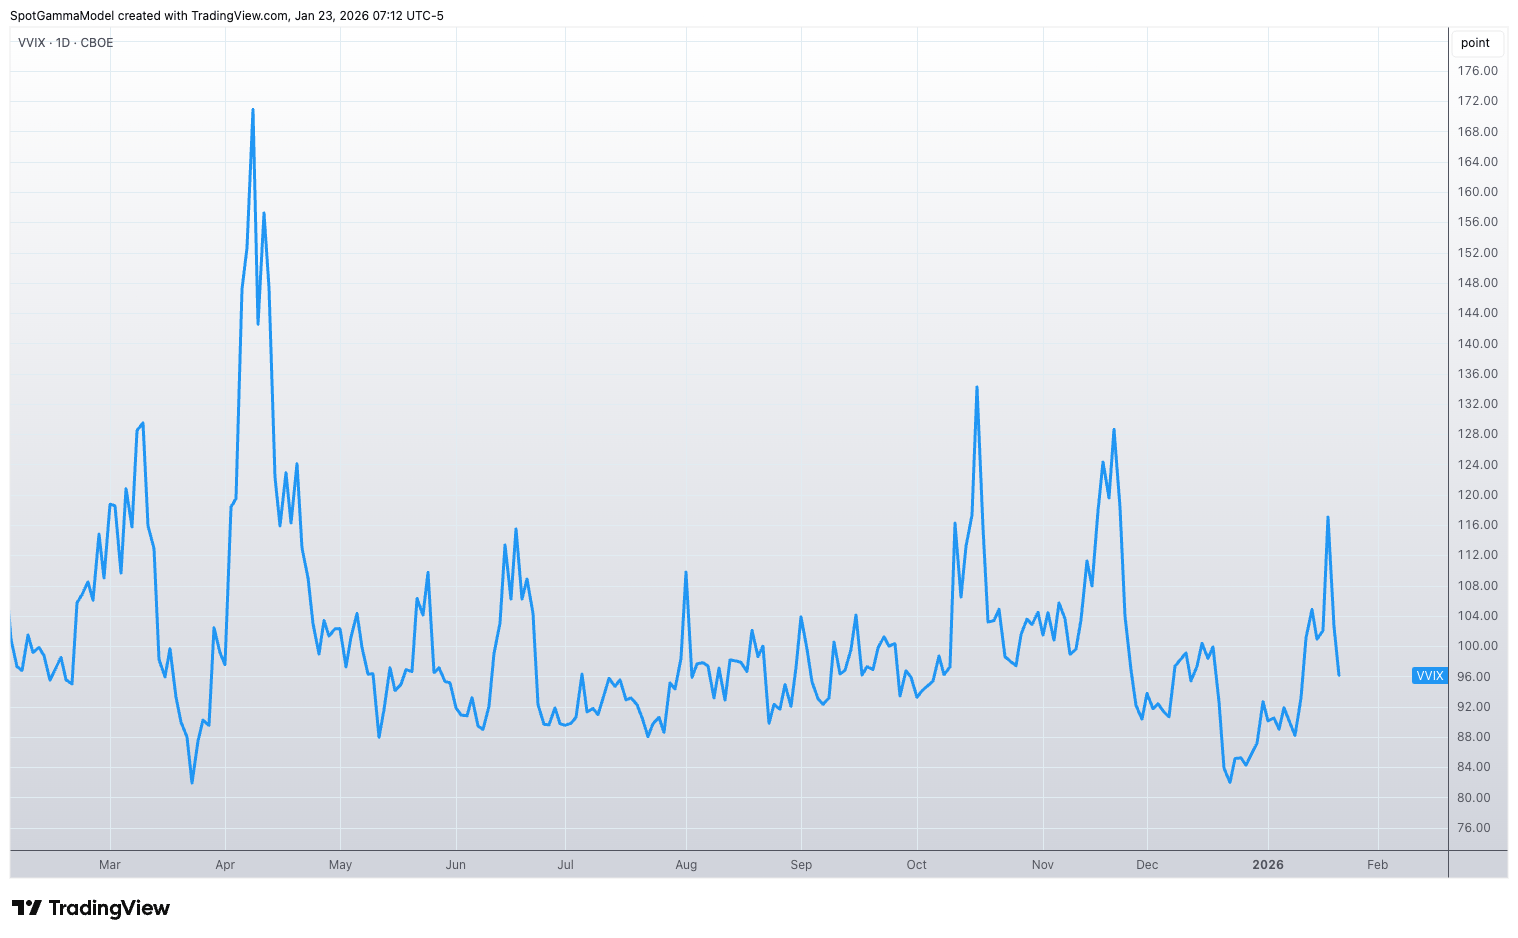
Not only is the SPX “back in the box”, vols have sunk, too. VVIX erased its jumpy OPEX move, signaling VIX calls are no longer in demand…
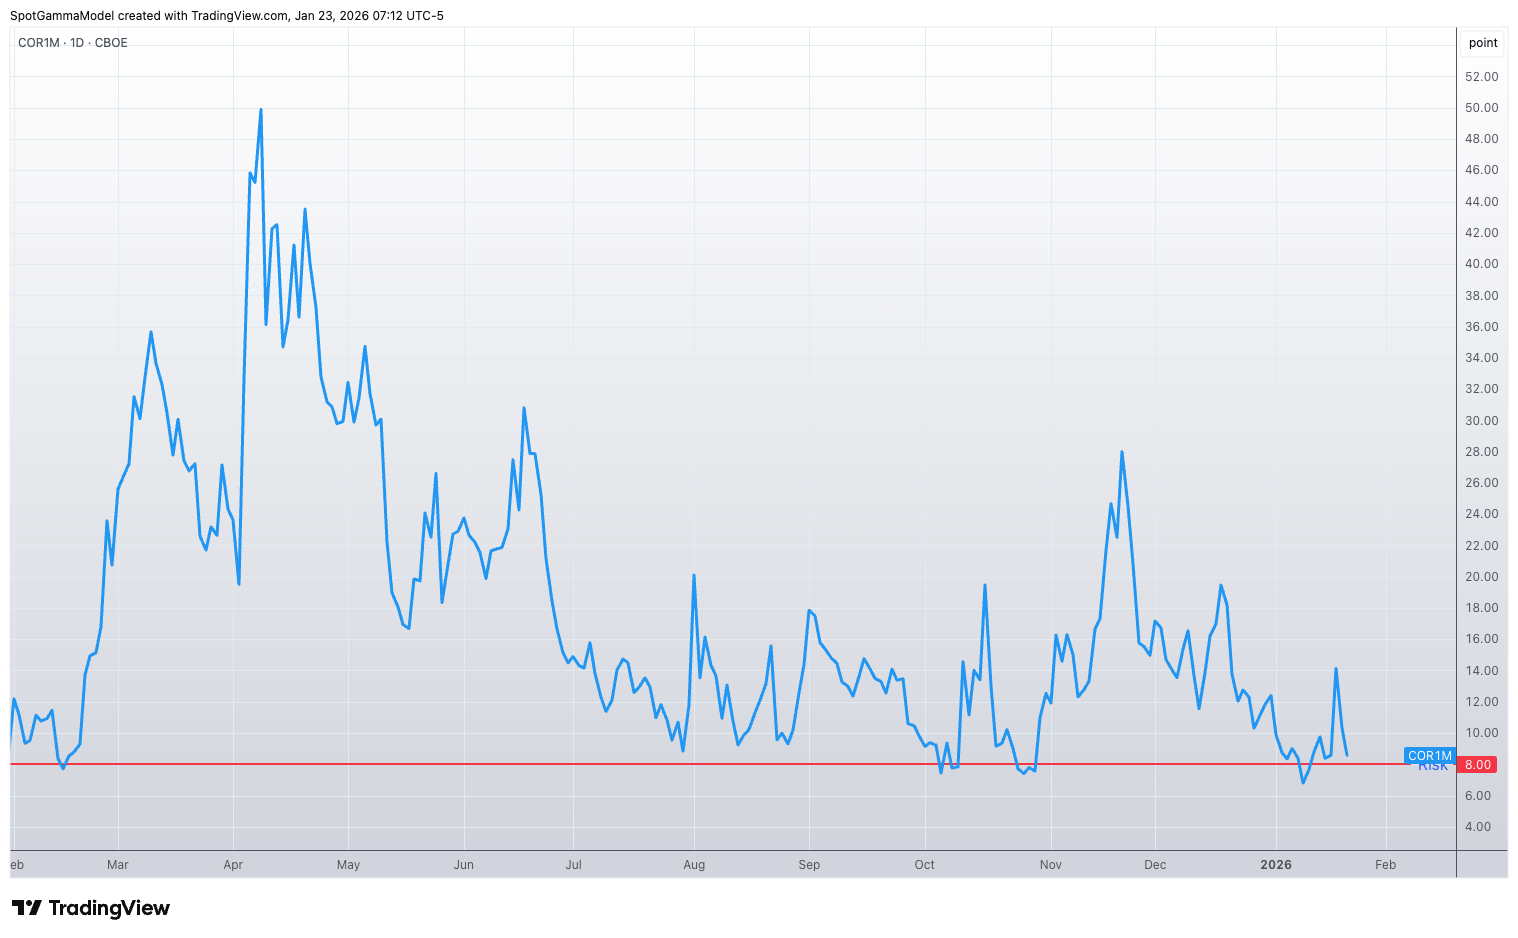
…and COR1M (equity correlation) is flagging that single stock calls are bid. On this topic COR1M is near our “we should buy some puts” level of <=8. We think that it likely crosses that threshold today or Monday. This metric at our “Risk-Off” level, with cheap VIX call spreads (as signaled by VVIX) makes the setup for either owning ~1-month out VIX call spreads and/or 1-2 month out SPX put spreads much more palatable.
©2025 TenTen Capital LLC DBA SpotGamma
All TenTen Capital LLC DBA SpotGamma materials, information, and presentations are for educational purposes only and should not be considered specific investment advice nor recommendations. Futures, foreign currency and options trading contains substantial risk and is not for every investor. An investor could potentially lose all or more than the initial investment. Risk capital is money that can be lost without jeopardizing one’s financial security or lifestyle. Only risk capital should be used for trading and only those with sufficient risk capital should consider trading. Past performance is not necessarily indicative of future results. VIEW FULL RISK DISCLOSURE https://spotgamma.com/model-faq/disclaimer/
Market Recap
IMPRO:Dboy:[9:04:17 AM]:IMPRO : Dboy : [Wed 3:55:50 PM] : goes up into 4:00 and after going to be up on Globex
IMPRO:Dboy:[9:04:46 AM]:IMPRO : Dboy : [Wed 4:16:27 PM] : going up on Globex
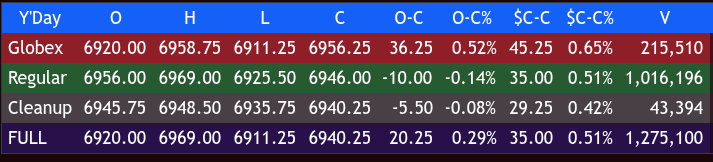
Above is a repost of what I thought on Wednesday’s 4:00 cash close, and during the overnight Globex, the ES pretty much went up all night and traded 6958.25 at 9:22 a.m. and opened Thursday’s regular session at 6956.00, up 45 points or +0.45%.
After the open, ES traded down to 6951.75, traded up to 6660.75, sold back off to 6952.00, and then rallied up to 6963.75 and reversed as the NQ fell and traded down to 6925.75 at 10:04 after the November Core PCE rose 2.8% YoY, right in line with expectations.
One of the things I realize is that I am not the best trader. It’s hard for me because I can’t forget some of the big losses I took on the floor and always feel it’s easy to lose and hard to make back. But here are some of the posts I put in the IMpro room—it’s the exact type of flow that I provided from my S&P desk and the reason a lot of big well-known traders gravitate to me.
IMPRO : Dboy : [9:36:13 AM] gone a long way from yesterday’s 6835 12:00 low
IMPRO : Dboy : [9:42:36 AM] NQ shaky
IMPRO : Dboy : [9:42:56 AM] everyone bulled up
IMPRO : Dboy : [9:43:14 AM] not liking the price action
IMPRO : Dboy : [9:50:36 AM] you could feel this
IMPRO : Dboy : [10:08:53 AM] bounce time and
The ES traded up to 6951.75 at 10:45, pulled back to the VWAP at 6941.75, rallied up to 6962.25 at 11:50, pulled back to 6951.00 at 12:00, and then rallied up to a new high at 6969.75 at 1:00. After the high, the ES pulled back to 6955.25, rallied up to 6966.50 at 2:10, sold off down to 6932.50 at 3:32, traded 6942.50 as the 3:50 cash imbalance showed $1.3 million to buy, traded up to 6947.75, traded 6946.00 on the 4:00 cash close and settled at 6940.25.
In the end, the ES and NQ followed through on the upside. In terms of the ES’s overall tone, it was firm all day. In terms of the ES’s overall trade, volume was lower at 1.275 million contracts traded.
MiM
Market-On-Close Recap
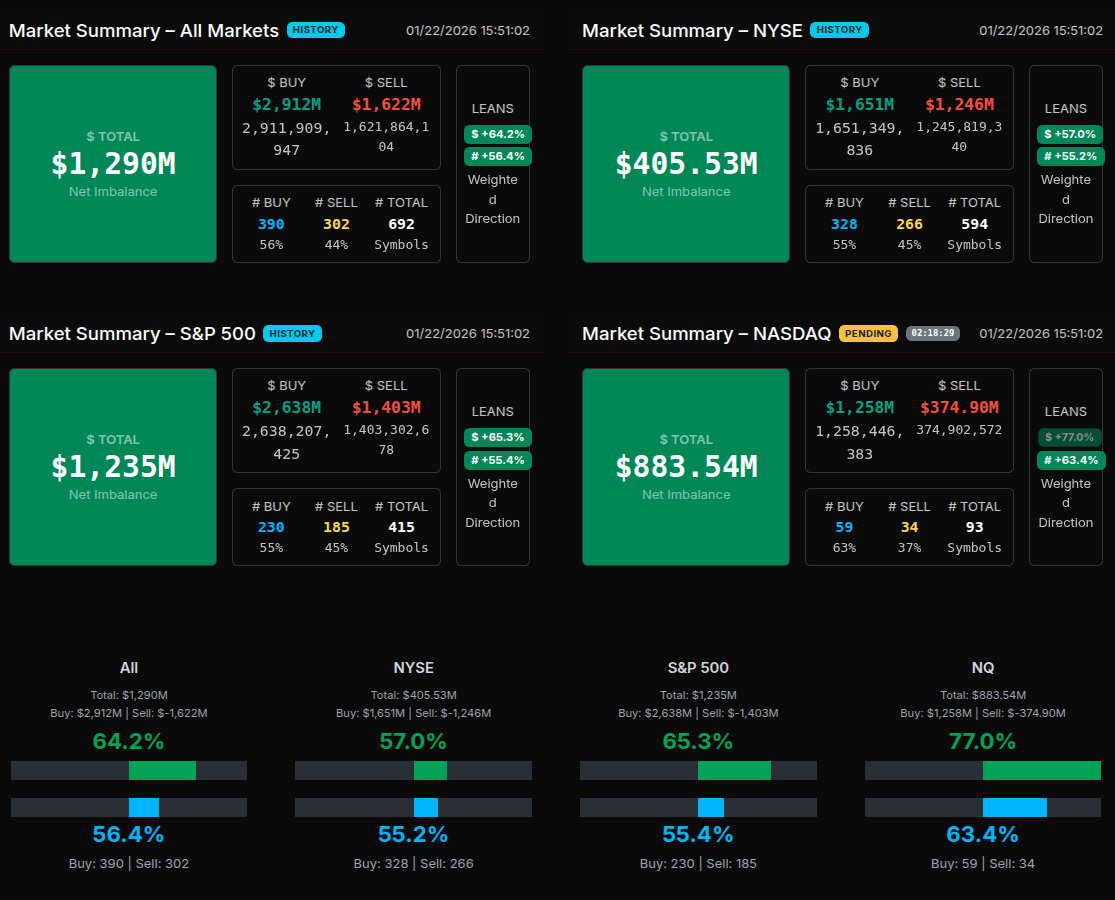
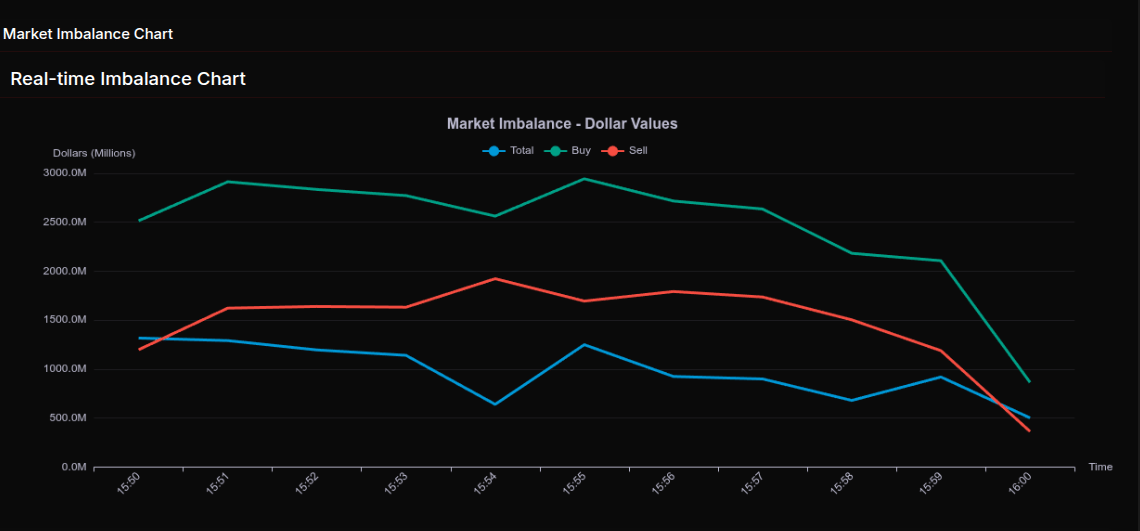
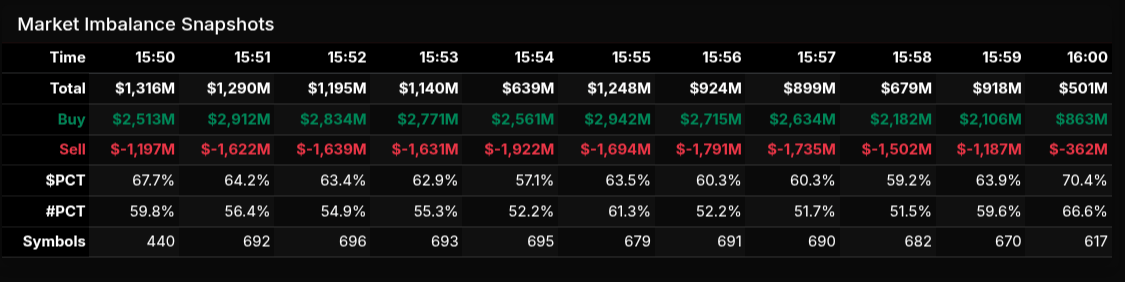
The Market-on-Close auction opened with a clear buy-side bias that remained intact throughout the final ten minutes, though the path was not linear. Early snapshots around 15:50–15:52 showed total imbalances holding above $1.1B, with buy dollars consistently north of $2.7B while sell interest hovered near $1.6B. As the auction progressed, total imbalance briefly compressed near 15:54 before re-expanding into 15:55, signaling renewed institutional participation rather than exhaustion.
By the close, the final net imbalance printed just over $500M, a natural taper as paired volume increased into 16:00. Importantly, both dollar-weighted and symbol-weighted percentages remained firmly positive, confirming that the buy imbalance was broad-based rather than isolated to a handful of names.
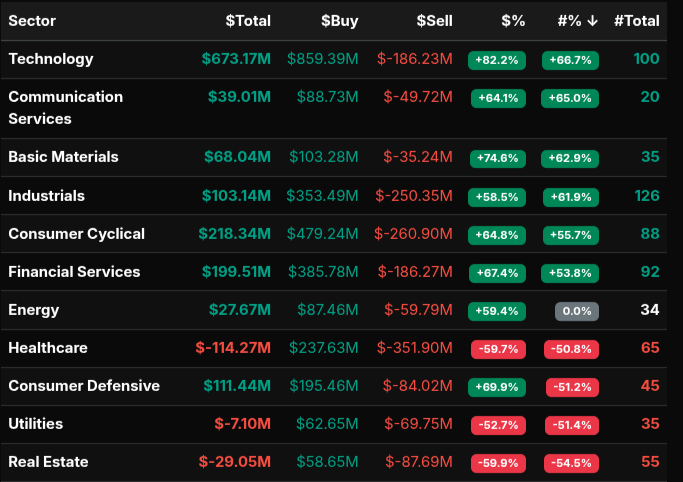
Sector-level flows reinforced this constructive tone. Technology dominated, posting a $673M net total with dollar and symbol leans well above 66%, a hallmark of wholesale institutional buying. Consumer Cyclical and Financial Services followed with strong positive leans, while Industrials also saw heavy gross activity despite meaningful offsetting sells—suggestive of rotation rather than outright risk-off behavior. Basic Materials participated constructively, adding to the cyclical bid.
On the other side, Healthcare stood out as the primary source of sell pressure, registering a deeply negative net total with both dollar and symbol leans near -60%, indicating broad distribution rather than selective rebalancing. Utilities and Real Estate also leaned decisively lower, consistent with ongoing rate and duration sensitivity.
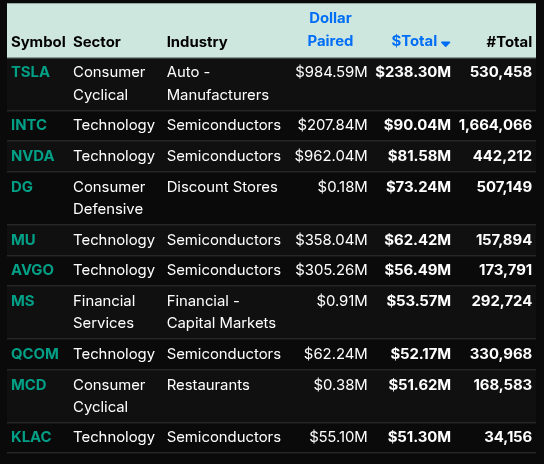
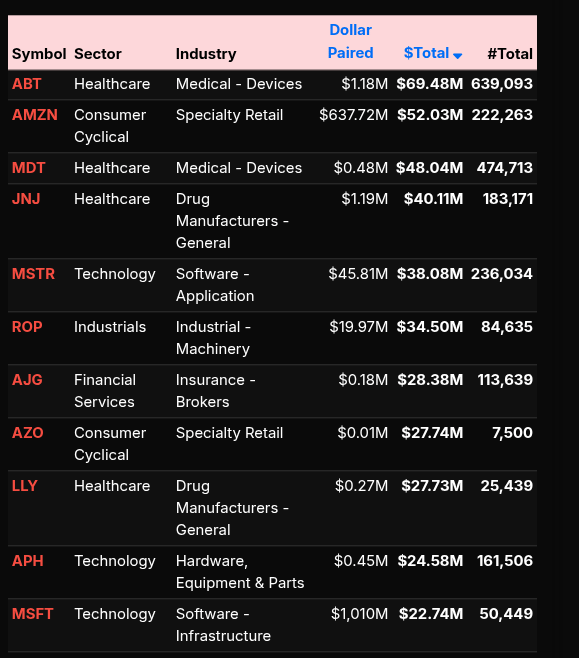
Single-stock activity highlighted where size was concentrated. Large buy imbalances were visible in TSLA, INTC, NVDA, and several semiconductor names, reinforcing the Technology sector’s leadership. Defensive and healthcare-related names appeared more frequently on the sell side, aligning with the sector summary.
In aggregate, this was a pro-risk MOC characterized by institutional accumulation in growth and cyclicals, paired with rotation out of defensives and rate-sensitive groups. The structure favors upside continuation rather than a mechanical end-of-day rebalance.
ES Levels
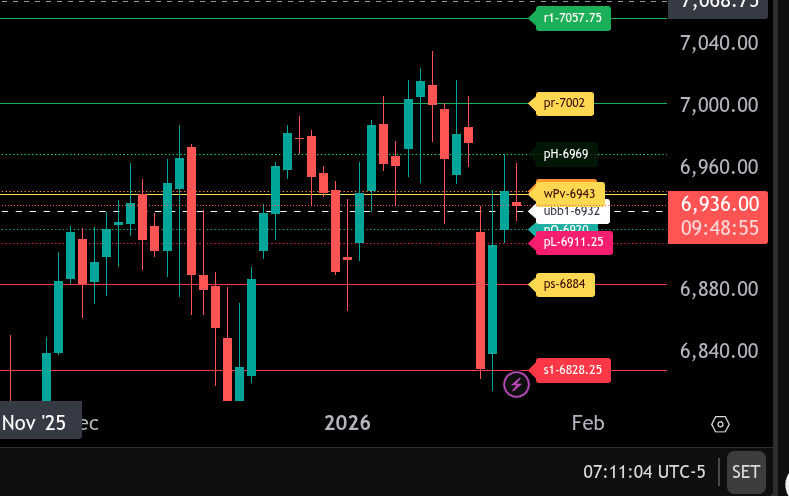
The bull/bear line for the ES is at 6943.00. This remains the defining pivot for today’s session. With the market trading below this level, the overall tone stays bearish unless price can reclaim and hold above it.
Current price is near 6936.00, keeping ES below the bull/bear line. Immediate resistance above the line is at 6969.00, followed by 7002.00, our upper range target. Any rally into 6969.00–7002.00 is expected to face selling pressure unless momentum materially improves.
On the downside, first support sits at 6932.00, followed by 6920.00. Below that, the next key support is 6911.25. A failure to hold the 6920.00–6911.25 zone increases the probability of a move toward 6884.00, which is the lower intraday range target.
If downside pressure accelerates further, the next major level to monitor is 6828.25. Overall, ES remains weak below 6943.00, and sellers remain in control unless the market can reclaim the bull/bear line and sustain acceptance above it.
NQ Levels
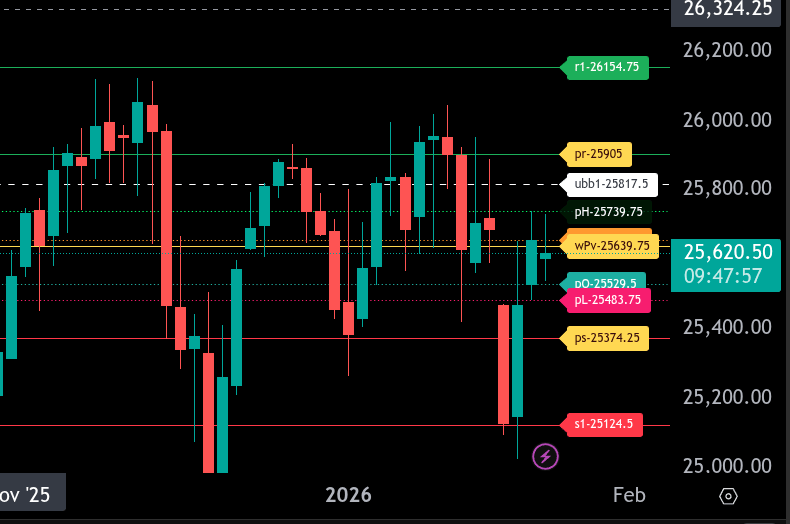
The bull/bear line for the NQ is at 25,639.75. This is the key pivot for today. Holding below this level keeps pressure on the downside, while acceptance above would signal stabilization.
NQ is currently trading around 25,617.75, remaining below the bull/bear line and inside a weak recovery bounce. As long as price stays below 25,639.75, sellers retain control.
On the downside, first support sits at 25,529.50. Failure to hold this level opens the door to 25,483.75, followed by 25,374.25. The lower extreme for the session is 25,124.50, which is the major downside target if liquidation resumes.
On the upside, initial resistance is 25,658.25, then 25,739.75. Above that, 25,817.50 is a key resistance zone, with the upper range target at 25,905. Acceptance above 25,905 would shift the tone more neutral to bullish.
Overall, the trend remains bearish below 25,639.75. Bulls need a clean reclaim and hold above this level to prevent further downside rotation.
Technical Edge
Fair Values for January 23, 2026
-
SP: 31.09
-
NQ: 131.86
-
Dow: 164.11
Daily Breadth Data 📊
For Thursday, January 22, 2026
-
• NYSE Breadth: 64.6% Upside Volume
• Nasdaq Breadth: 65.8% Upside Volume
• Total Breadth: 65.7% Upside Volume
• NYSE Advance/Decline: 62.3% Advance
• Nasdaq Advance/Decline: 68.7% Advance
• Total Advance/Decline: 66.3% Advance
• NYSE New Highs/New Lows: 302 / 14
• Nasdaq New Highs/New Lows: 570 / 78
• NYSE TRIN: 0.76
• Nasdaq TRIN: 1.11
Weekly Breadth Data 📈
Week Ending Friday, January 16, 2026
-
• NYSE Breadth: 52.7% Upside Volume
• Nasdaq Breadth: 55.9% Upside Volume
• Total Breadth: 54.8% Upside Volume
• NYSE Advance/Decline: 63.2% Advance
• Nasdaq Advance/Decline: 53.6% Advance
• Total Advance/Decline: 57.1% Advance
• NYSE New Highs/New Lows: 481 / 62
• Nasdaq New Highs/New Lows: 754 / 290
• NYSE TRIN: 1.50
• Nasdaq TRIN: 0.89
Calendars
Economic Calendar Today
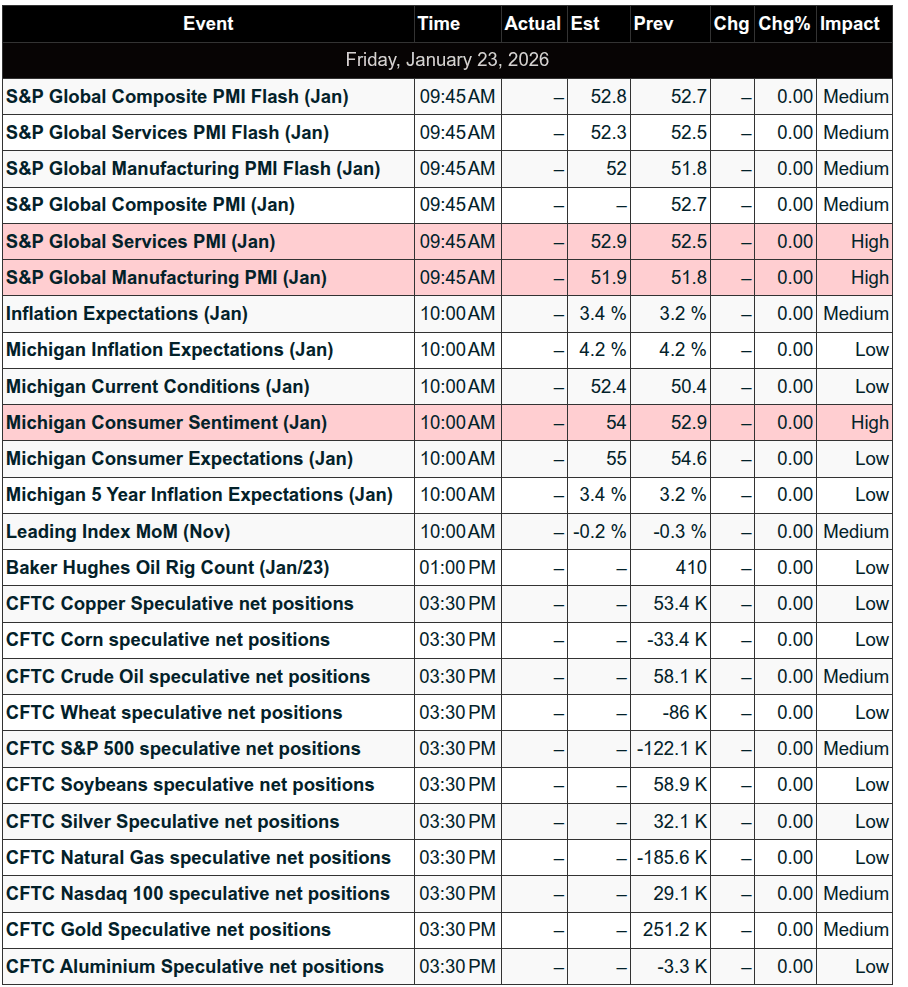
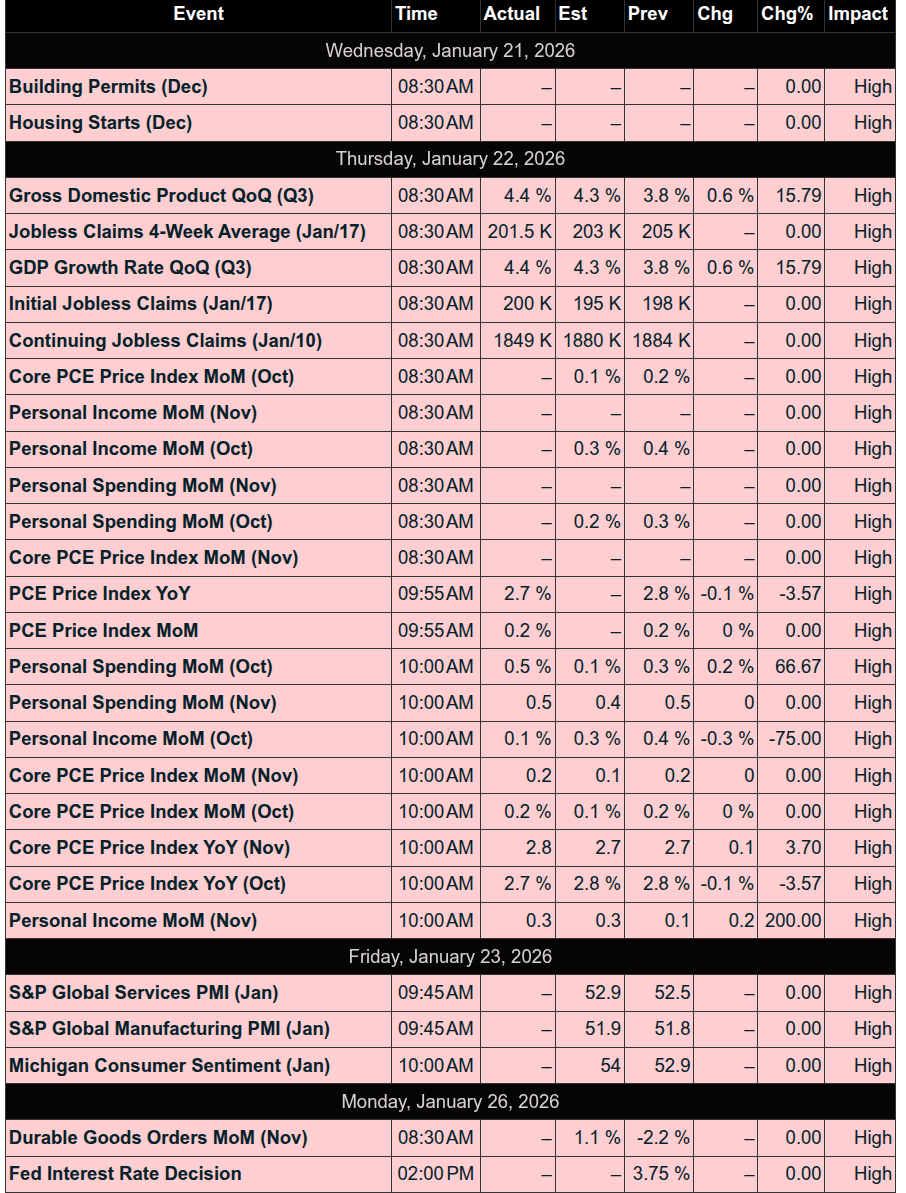
This Week’s High Importance
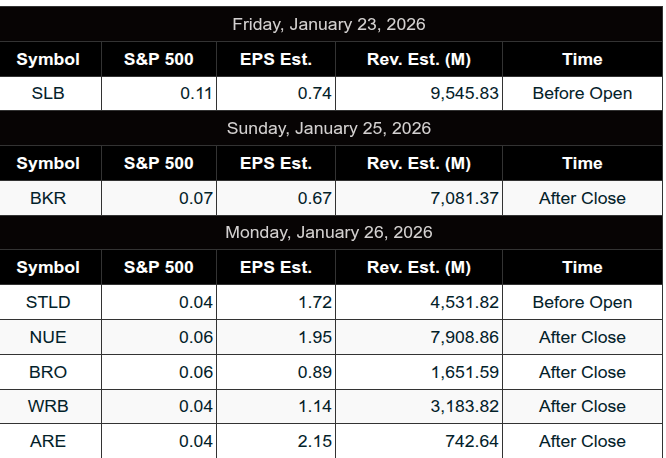
S&P 500 Earnings:
Upcoming:
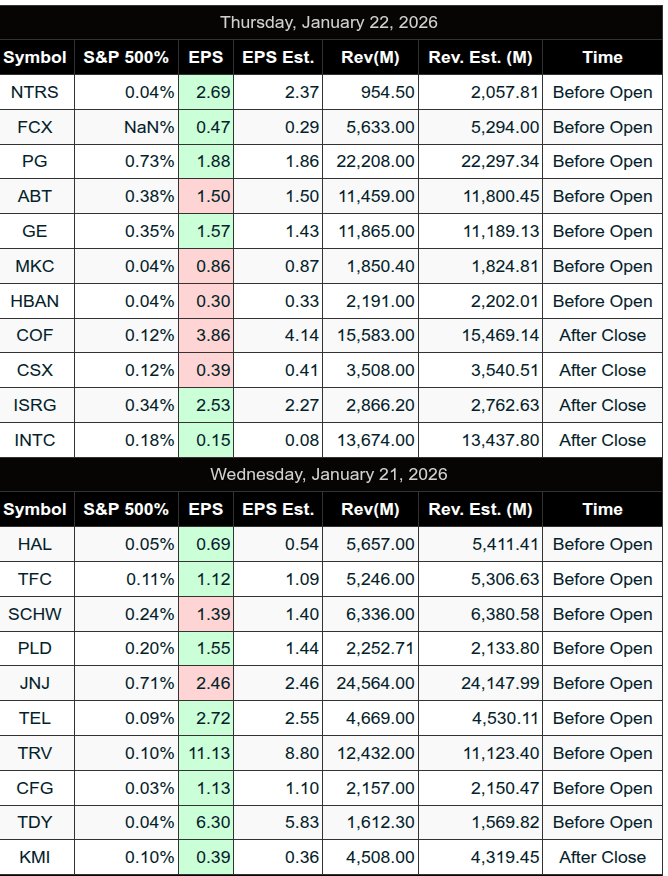
Recent:
Trading Room News:
Polaris Trading Group Summary – For Thursday, January 22, 2026
Yesterday’s session in the PTG trading room was a strong example of preparation, disciplined execution, and responsive trading—led by PTGDavid and supported by an engaged community.
Morning Prep & Trade Plan
-
Manny kicked things off early, posting his trade plan and reinforcing the importance of starting fresh each day with clear levels.
-
PTGDavid shared all the key tools: Daily Strategy, Range Calculator, and compliance disclaimer, setting the tone for a structured session.
Opening Action
-
Both ES and NQ opened strong, pushing into D-level zones early in the session, indicating bullish momentum.
-
The first trade on ES was a long entry at 6953, which was stopped at 6948—a reminder of solid risk management. A second short trade followed, which played out more favorably, with David later sharing a zoomed-in screenshot for clarity.
Strategy Execution
-
Dynamic Levels at 6825 and 6925 were identified by David as key pivots and were respected throughout the day, providing a strong structural framework.
-
When PH 6945 was reclaimed, it shifted to key pullback support, leading to clean long setups.
-
By 11:30 AM, David confirmed that the Open Range Strategy was complete, highlighting that price had followed the plan well.
Key Lesson Reinforced
-
David emphasized the principle of “No trigger, no trade”, specifically referencing an A10 setup that didn’t trigger—teaching patience and discipline in execution.
Afternoon Action
-
After the lunch break, the afternoon turned into a slow grind lower, as David called it a “chug-fest.”
-
The break below 6955, followed by a move into the 6945s, then to 6940, showed a step-by-step continuation of the bearish scenario.
-
The $1.3B MOC Buy Imbalance was noted but didn’t derail the directional move.
-
The session settled between 6945–6950, right near the RTH VPOC/Midpoint at 6947—an accurate structure-based call by David.
Positive Highlights
-
The retest and reclaim of PH 6945 offered a clear long setup.
-
Dynamic levels provided excellent structure for both long and short trades.
-
The room maintained a strong focus on discipline—trading only with valid triggers and managing risk tightly.
Closing Thoughts
David wrapped the day with a heads-up for “Freaky FRYday” ahead—implying potential volatility and opportunity going into the end of the week.
DTG Room Preview – Friday, January 23, 2026
-
Markets are rebounding this morning after President Trump called off Greenland-related tariffs and announced a potential framework for a future Greenland deal. Despite Wednesday’s sharp intraday swings, U.S. stock indexes remain down on the week.
Key Market Drivers:
-
AI & Chips: Intel (INTC) reports after the bell, with focus on AI demand, chip shortages, and PC sales. Alibaba plans an IPO for its AI chip unit, T-Head, aiming to compete with Nvidia in AI accelerators.
-
Data Center Boom: At Davos, leaders including Nvidia’s CEO highlighted the massive buildout needed in power and infrastructure for AI. Goldman Sachs projects data center demand will surge from 55GW to 84GW over two years.
-
Earnings in Focus: Pre-market earnings include ABT, FCX, GE, PG, HBAN, MKC, NTRS, ORI. Post-market: AA, COF, CSX, INTC, EWBC, ISRG, SSB. Friday AM: BAH, ERIC, SLB.
-
Macro Data: Markets await Core PCE (Oct & Nov), GDP (34-day delay), jobless claims, and personal income/savings figures.
Technical Overview (ES Futures):
-
Wednesday saw extreme volatility driven by Greenland headlines, with multiple 75+ point swings.
-
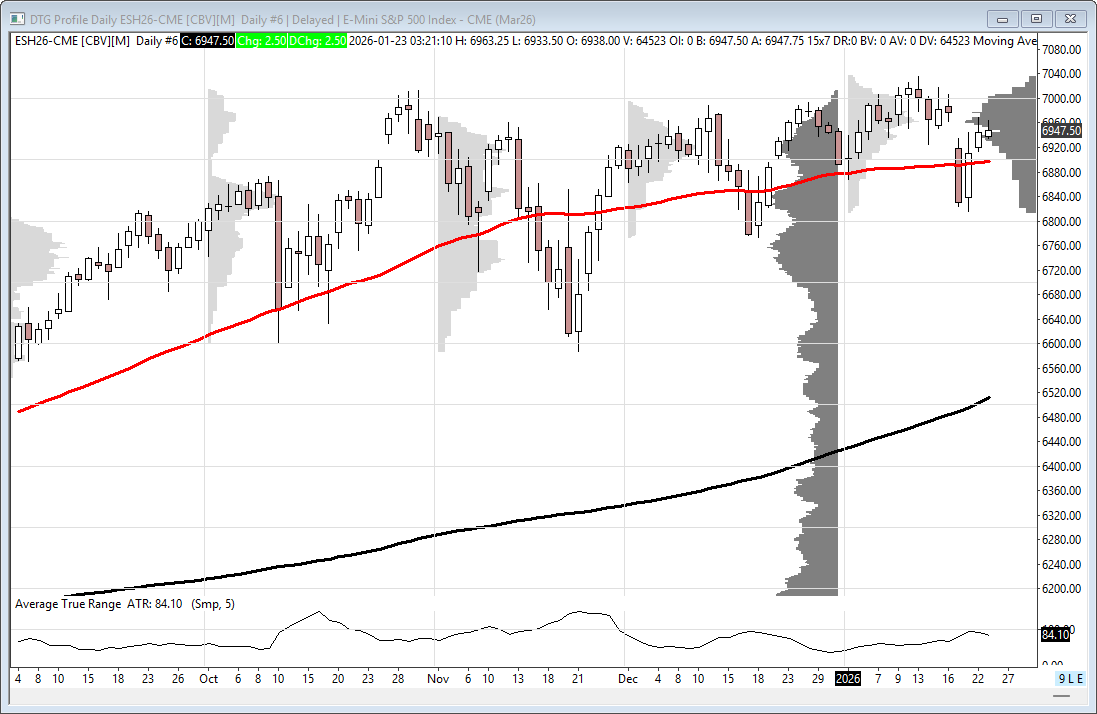
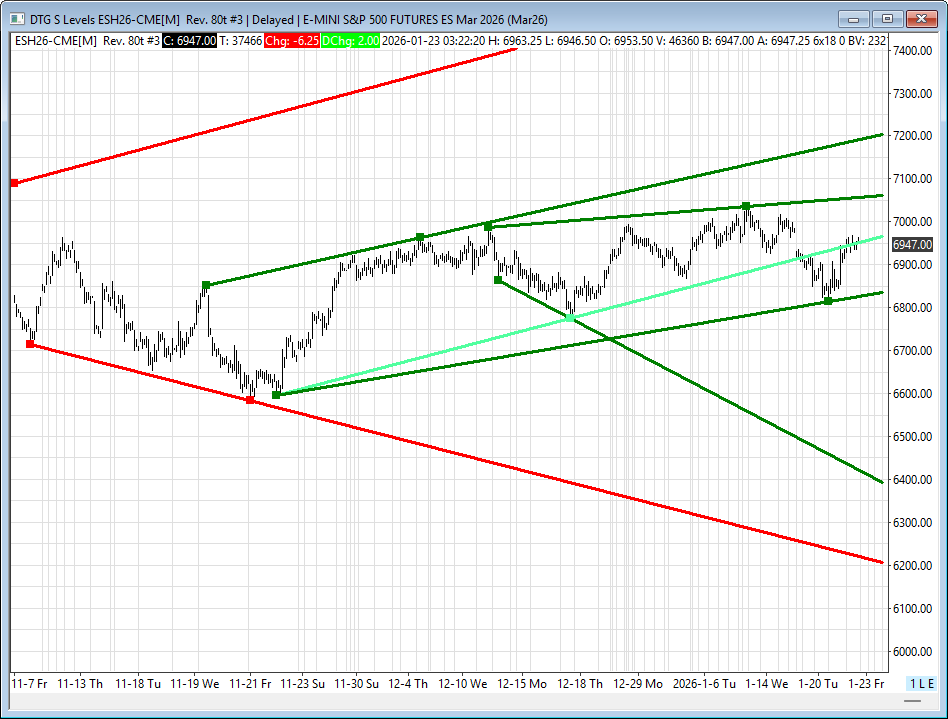
ES bounced strongly, reclaiming the 50-day MA (6896), now seen as support.
-
Key resistance sits at the former short-term uptrend channel (6947/50s), with additional resistance at 6969, 7057, and 7198.
-
Support zones include 6826/29, 6410/05, and 6210/05.
Volatility may ease if geopolitical rhetoric remains calm and bulls hold momentum.
-
Affiliate Disclosure: This newsletter may contain affiliate links, which means we may earn a commission if you click through and make a purchase. This comes at no additional cost to you and helps us continue providing valuable content. We only recommend products or services we genuinely believe in. Thank you for your support!
Disclaimer: Charts and analysis are for discussion and education purposes only. I am not a financial advisor, do not give financial advice and am not recommending the buying or selling of any security.
Remember: Not all setups will trigger. Not all setups will be profitable. Not all setups should be taken. These are simply the setups that I have put together for years on my own and what I watch as part of my own “game plan” coming into each day. Good luck!!
Follow @MrTopStep on Twitter and please share if you find our work valuable!
This post goes out as an email to our subscribers every day and is posted for free here around 2 PM ET. To get your real-time copy, sign up for the free or premium version here: Opening Print Subscribe.
Comments are closed