This post goes out as an email to our subscribers every day and is posted for free here around 2 PM ET. To get your real-time copy, sign up for the free or premium version here: Opening Print Subscribe.
From OpenAI to Open Season — When the Believers Start Hitting the Sell Button
Follow @MrTopStep on Twitter and please share if you find our work valuable!
FREE Two-Week Offer for the Opening Print Premium. Open up the Lean and other premium features for the next Two Weeks!
Our View
I don’t watch CNBC, but one of my favorite people was former UBS analyst Art Hogan, who is now Chief Market Strategist at B. Riley Wealth Management. He said:
“If things are advancing as rapidly as we hear from OpenAI and Anthropic, it’s going to be a problem. Investors are starting to go after any of the companies that could be disrupted, which is all kinds of software application names.”
This brings back the old question—something I firmly denied in the last quarter of 2025—about an AI bubble. There is no doubt that private equity managers are loaded up with software companies and have been borrowing money from private debt funds to pay for the buyouts.
I think the question is: what happens if there is a larger downturn? According to Barclays research, software now accounts for about 20% of investments in Business Development Companies (BDCs), a booming type of private-credit fund that was about 10% in 2016.
The tech and AI trade has been broadly under pressure since Microsoft reported higher-than-expected spending on AI infrastructure and slower-than-expected cloud growth. MSFT has fallen from the $483 area on January 28 to a low of 408.56 yesterday.
I don’t know what the outcome of any of this will be, but it seems like there are a lot of sellers and non-believers out there right now. The PitBull pointed out yesterday that the NVDA chart is showing a big head-and-shoulders pattern.
Our Lean
I can’t say that I knew the ES and NQ were going to sell off like they did yesterday, but it didn’t take long to figure out. What I failed to mention is what I have been saying for the last few weeks: NQ selling shows up on most or all the gap-ups, but this time there was no bounce.
I was selling when the ES went up on Monday and buying when it went down yesterday. My timing has definitely been off the last few days; Monday’s rally had me thinking there would be follow-through on the upside, which was way off.
Resistance Levels (Supply Zones)
-
R8: 7,103 (Fib 127.2% Extension)
-
R7: 7,075 (Round Number)
-
R6: 7,052 (Pivot R1)
-
R5: 7,050 (Round Number)
-
R4: 7,053 (Bollinger Upper)
-
R3: 7,043 (Period High – Jan 28)
-
R2: 6,986 (Market Profile VAH)
-
R1: 6,971 (20-day MA) – immediate resistance
Current Price
6,946.25 (as of Feb 4, 2026)
Support Levels (Demand Zones)
-
S1: 6,943 (Market Profile VAL)
-
S2: 6,940 (VWAP)
-
S3: 6,935 (50-day MA)
-
S4: 6,907 (Fib 38.2% Retracement)
-
S5: 6,889 (Bollinger Lower)
-
S6: 6,865 (Prior Low)
-
S7: 6,831 (Pivot S1)
-
S8: 6,822 (Recent Low – Jan 20)
-
S9: 6,776 (Period Low – Dec 17)
Market Recap

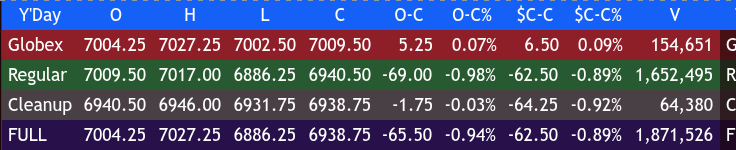
The ES traded up to 7027.00 on Globex and opened Tuesday’s regular session at 7009.50, up 6.5 points or +0.09%. After the open, the ES traded up to 7017.50 and then sold off down to 6954.00 at 10:20. It rallied back up to the 6981.00 level at 10:57 and continued to make a series of lower lows down to 6932.00 at 12:15.
It traded up to the 6947 level, sold off to 6919.50 at 12:42, traded up to 6933.50 at 12:51, and then made another series of lower lows all the way down to 6886.25 at 2:03.
After the low, the ES rallied back up to 6918.50 at 2:40, pulled back to a higher low at 6897.00, rallied up to 6917.00 at 2:55, and pulled back to another higher low at 6908.75 at 3:05. That’s when some buy imbalances started showing up, pushing the ES up to 6938.50 at 3:35. It pulled back to 6928.50 and traded at 6935.25 as the 3:50 cash imbalance showed $2.5 billion to buy. It traded at 6944.00 at 3:55 and traded at 6940.50 on the 4:00 cash close, down 69 points or -0.98%.
After 4:00, the ES traded down a bit, then up to 6946.00, sold off to 6931.75, and settled at 6938.75, down 63.75 points or -0.91%.
The NQ settled at 25,421.25, down 428.75 points or -1.66%; the YM settled at 49,366.00, down 157 points or -0.36%; and the RTY settled at 2,656.00, up 6.30 points or +0.24%.
In the end, the market giveth and the market taketh away. We live in a salty dog world where the news is painted to fit the markets overnight and then oversold. In terms of the ES and NQ’s overall tone, it was like someone switched off the lights. In terms of the ES’s overall trade, volume was higher at 1.878 million contracts traded.
There is so much cat and mouse going on, it’s silly. From the government shutdown being avoided to Russia upping its attacks on Ukraine one day before the scheduled peace talks; the US military shooting down an Iranian drone as it approached the USS Abraham Lincoln aircraft carrier in the Arabian Sea; the US–India trade deal announcement; Trump calling for Republicans to “nationalize” elections; and the threat of new AI tools wiping $300 billion off software data stocks.
Guest Posts
Transition from Cycle Day 3 to Cycle Day 1
Cycle Day 1 Playbook: Reload Longs on Decline
The market already did Cycle Day 1’s work—on Cycle Day 3.
An aggressive liquidation flushed price beyond the average decline typically reserved for CD1. That’s not a typo. But these aren’t the markets your daddy traded. Not even close.
This tape is driven by algorithmic buy/sell programs locked in self-reinforcing feedback loops—an unruly beast that must be constantly fed. Those who disrespect its nature, or worse, misalign with it, become the offering.
👉 Do not be the Feast for the Beast.
Stay aligned.
Cycle Day 1 downside projections have already been fulfilled and exceeded during the prior session’s liquidation. The late-day bounce merely squared some intraday exposure—it did nothing to alter the broader dynamic.
Volatility remains elevated and is likely to stay that way. That’s not a threat—that’s an opportunity. But only for those who stay disciplined, patient, and intentional.
Bottom Line
-
CD1 favors buying weakness — not chasing strength
-
Let price come to you
-
Reload with intent, not adrenaline
-
Patience is the edge
Stay sharp. Stay aligned. The beast rewards respect—and punishes impatience. 🐺📉📈
The Two Pillars of the PTG Trade Plan
1️⃣ Stay Aligned with the Dominant Force
Think current, not prediction.
When price structure establishes a support zone, we don’t argue—we align. Bias shifts to a long-lean, and we patiently stalk entries via Stackers or the first PB ATR / Discount.
When structure flips? Same process, opposite direction. No emotion. No hero trades. Just flow.
Picture a surfer:
You don’t fight the wave—you paddle, position, and let gravity do the work.
2️⃣ Trade from Statistical Range Extremes
Welcome to the wabbit hunt 🐇
PKB entries inside the D-Level Money Box (DLMB) Zones live here. And let’s be clear—this is not counter-trend trading. This is timing.
When range values stretch too far, Market Makers don’t chase—they set traps. Stops get flushed. Liquidity gets harvested. Price snaps back like a rubber band.
This is reversionary trading inside range-type rhythms—
high accuracy, repeatable, and ruthless when executed correctly.
Cue the imagery:
Lights dim. Liquidity pools glow. Stops line up like dominos.
M&M’s smile. Click. Run the stops.
The Toolbox Matters—But the Hand Using It Matters More
The PTG Trader Toolbox has everything (yes, even the weird wrench you didn’t know you needed).
Your job isn’t to use everything.
Your job is to master the right tools for your plan.
The PTG Member’s Area is stacked—dozens of educational videos, real trade examples, and market walkthroughs designed to compress learning curves and eliminate guesswork.
And when the chart gets loud?
PTGDavid is always in the room.
Guiding. Grounding. Keeping traders on the right side of structure and statistics.
Cycle Day 1 isn’t about being right.
It’s about being ready.
Strap in. Manage risk.
And let volatility do what it does best. 💥📊
🎯 Cycle Day 1 Focus
Scenarios to consider for today’s trading.
🟢 Bull Case
-
Hold north of 6950 +- 5 pts targets 6965…6970…6975
🔴 Bear Case
-
Hold south of 6950 +- 5 pts targets 6930…6920…6910
PVA High Edge = 6967 PVA Low Edge = 6899 Prior POC = 6942
— PTG
From Jeff Hirsch Stock Trader’s Almanac
February has opened strongly but then reverses after President’s Day
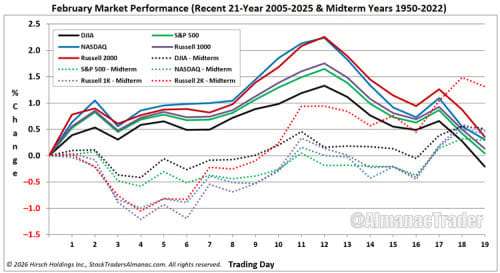
February’s first trading day has been bullish for DJIA, S&P 500, NASDAQ, Russell 1000 and 2000. Average gains on the first day over the most recent 21-year period (solid lines in above chart) range from 0.39% by DJIA to 0.78% by Russell 2000. However, after a strong opening day, positive momentum has tended to stall out until around the seventh or eighth trading days. From there until around the 12-trading day all five indexes have historically enjoyed gains. But those gains have not held with the indexes beginning to decline after Presidents’ Day through the end of February.
Midterm-year February performance (dotted lines in above chart) has taken a different trajectory with weakness typically prevailing until around the sixth trading day, but afterwards the major indexes have demonstrated strength through the end of February with some consolidation around monthly options expiration and/or Presidents’ Day holiday.
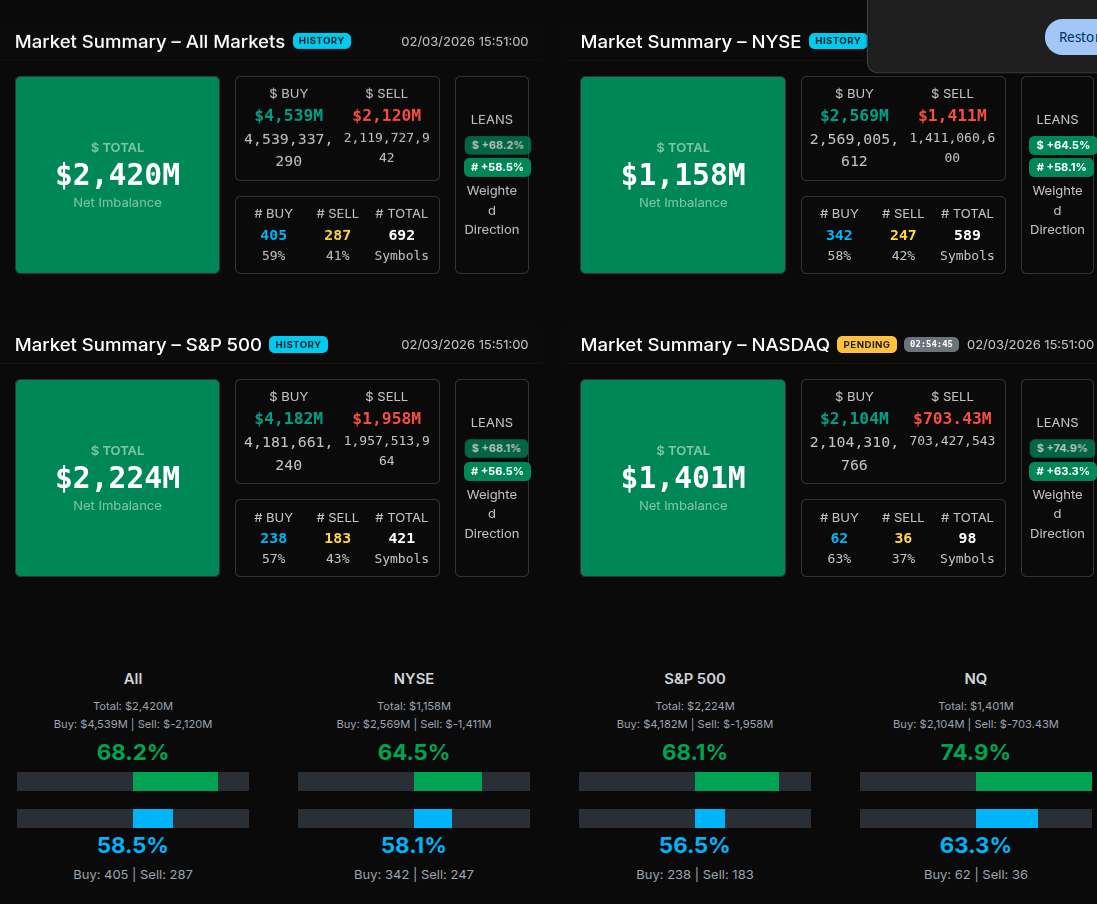
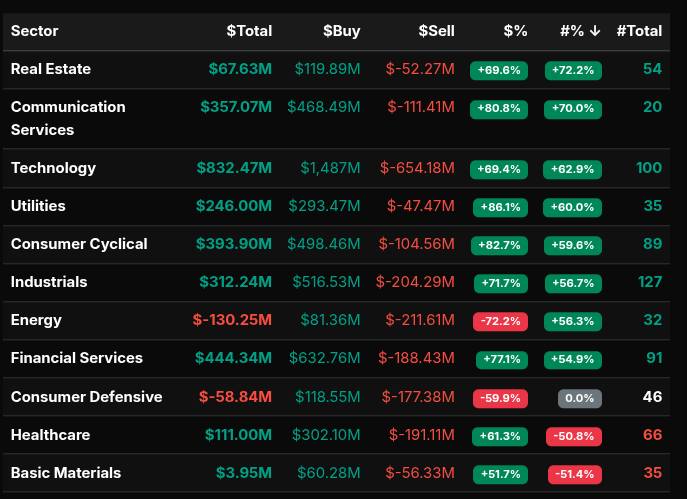
MOC Recap
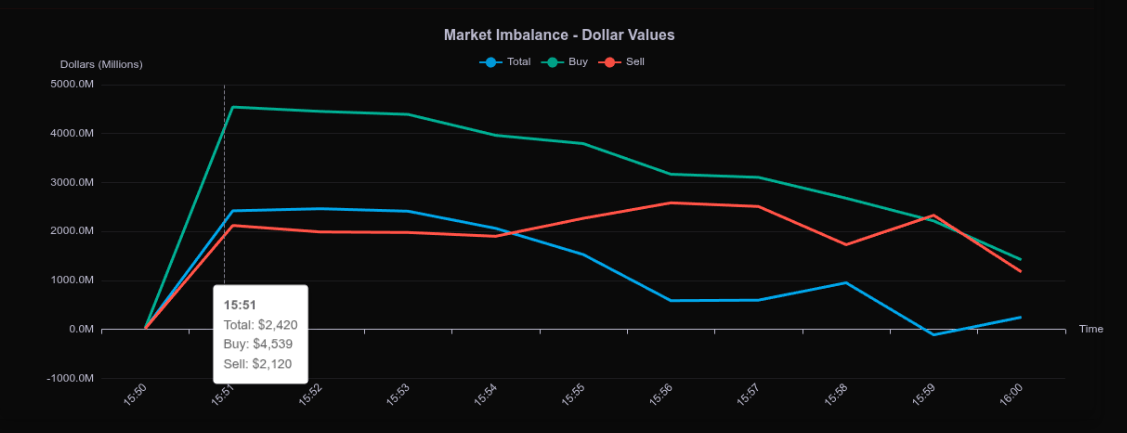
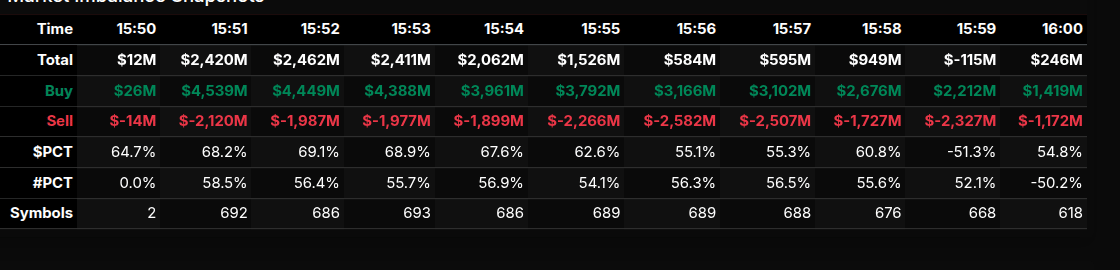
The market-on-close auction opened with an immediate surge in buy-side interest, quickly establishing a strong positive imbalance across all major venues. By 15:51 ET, total net imbalance jumped to roughly $2.4B, driven by aggressive early buying that peaked above $4.5B before sell programs began to assert themselves. From that point forward, the auction transitioned into a more rotational profile, with buy pressure steadily bleeding off while sell interest rose into the final minutes.
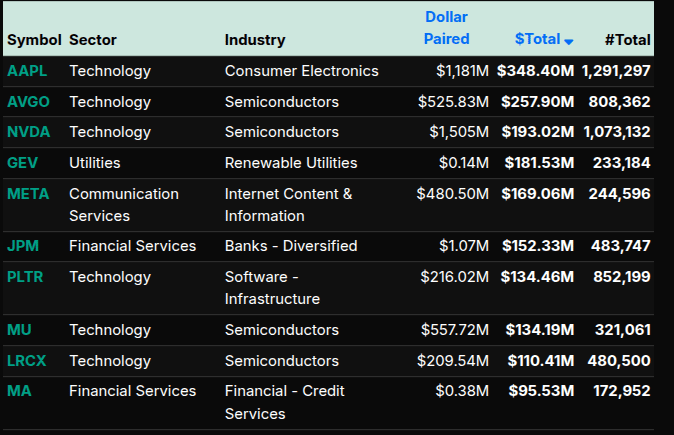
Sector participation tells a clean story of where institutional money was leaning. Technology dominated the tape, finishing with over $830M net positive, despite heavy gross selling, signaling wholesale accumulation rather than passive rotation. Communication Services and Consumer Cyclical also showed strong directional conviction, both posting buy leans north of +80%, well above the +66% threshold that typically defines programmatic or fund-driven demand. Utilities quietly stood out as well, registering one of the highest percentage buy leans on the board, suggesting defensive allocation rather than short-term speculation.
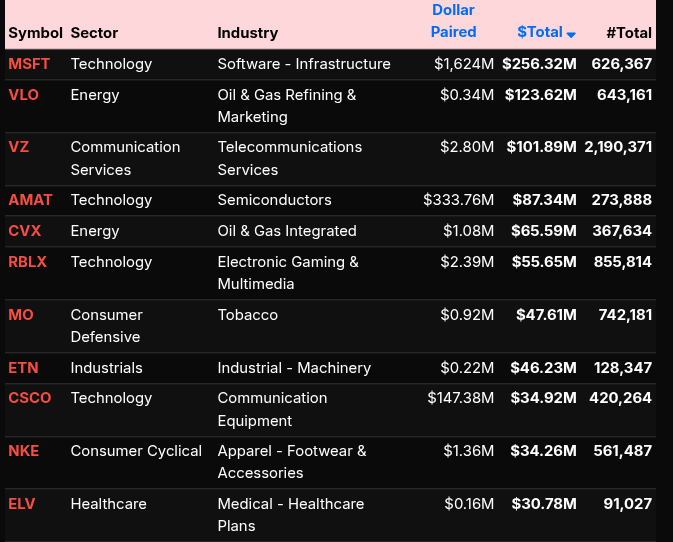
On the flip side, Energy and Consumer Defensive were clear sources of supply. Energy’s -72% lean marks a decisive wholesale sell, consistent with end-of-day risk reduction rather than simple rebalancing. Consumer Defensive and Healthcare also skewed meaningfully lower, reinforcing the broader “risk-on within growth, risk-off within defensives” dynamic.
At the single-stock level, the auction was led by mega-cap tech. AAPL, MSFT, NVDA, AVGO, and META absorbed substantial buy flow, confirming that the Technology sector strength was driven by concentrated size, not breadth alone. Financials showed selective strength through JPM and MA, while Industrials’ participation was narrower but still constructive.
Into the close, overall market imbalance compressed as sell programs offset earlier buys, flipping briefly negative before stabilizing. The final read was not one of exhaustion, but of controlled distribution against strong prior demand — a textbook example of a directional open transitioning into late-stage rotation rather than a full unwind.
Technical Edge
Fair Values for February 4, 2026:
-
SP: 23.4
-
NQ: 102.23
-
Dow: 100.97
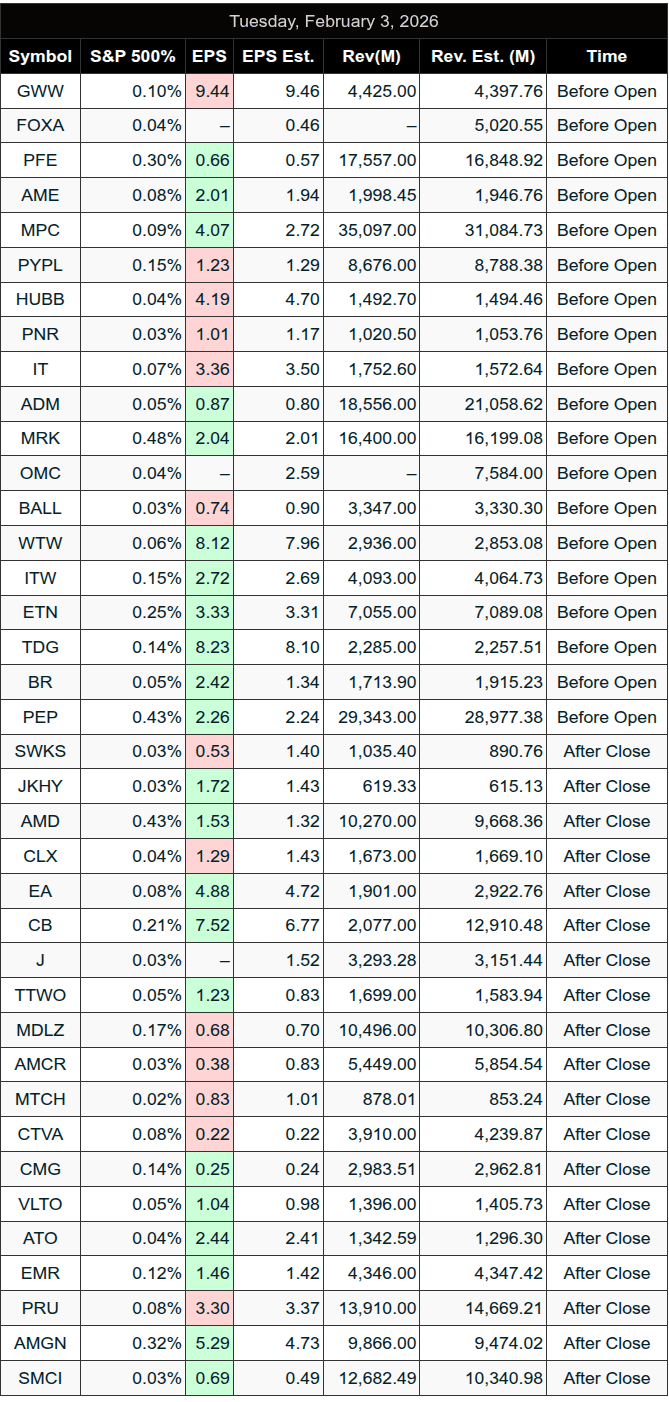
Daily Market Recap 📊
For Tuesday, February 3, 2026
-
NYSE Breadth: 58% Upside Volume
-
Nasdaq Breadth: 51% Upside Volume
-
Total Breadth: 52% Upside Volume
-
NYSE Advance/Decline: 54% Advance
-
Nasdaq Advance/Decline: 42% Advance
-
Total Advance/Decline: 46% Advance
-
NYSE New Highs/New Lows: 281 / 127
-
Nasdaq New Highs/New Lows: 307 / 417
-
NYSE TRIN: 0.90
-
Nasdaq TRIN: 0.66
Weekly Market 📈
For the week ending Friday, January 30, 2026
-
NYSE Breadth: 46% Upside Volume
-
Nasdaq Breadth: 46% Upside Volume
-
Total Breadth: 46% Upside Volume
-
NYSE Advance/Decline: 47% Advance
-
Nasdaq Advance/Decline: 35% Advance
-
Total Advance/Decline: 39% Advance
-
NYSE New Highs/New Lows: 452 / 119
-
Nasdaq New Highs/New Lows: 667 / 458
-
NYSE TRIN: 0.99
-
Nasdaq TRIN: 0.64
Trading Room Summaries
Polaris Trading Group Summary – Tuesday, February 3, 2026
The trading day was heavily focused on Cycle Day 3 dynamics, with the market playing out a textbook downside scenario, fulfilling all key projection targets identified early in the session by PTGDavid. While tech issues briefly interrupted participation, traders managed to capitalize on a strong bearish trend with precision entries, and a modest late-day bounce showed signs of recovery.
Key Lessons & Strategy Highlights
-
Cycle Day 3 Pattern Recognition: PTGDavid emphasized early that all Cycle Day 3 upside targets had been fulfilled, designating the day as a “wild-card”, which often hints at reversal or continuation unpredictability. However, once the downside took hold, the lower targets became the focus.
-
Gamma Level at ES 7025 (SPX 7000): Market stalled and reversed at this key gamma strike. David advised to scalp dips above 6950 and sell rips near 7000, consistent with low volatility expectations from high gamma levels.
-
Volume Trigger & Bearish Confirmation: The Volume Trigger at 6985 marked the shift to downside momentum. Once the market lost 7015, it quickly moved to hit 6995, 6985, and 6975, then extended down to 6954 and 6939, both identified in the morning DTS briefing.
-
BOON! Targets Fulfilled: Traders who followed the plan caught clean moves down through each level, with 6954 tagged mid-morning and 6939 hit in the early afternoon.
-
FVG & Bull Flag: Later in the session, a Falling Knife pattern reversed into a bull flag, offering a scalpable long setup. This was confirmed by a $2.5B MOC buy imbalance, signaling end-of-day buying interest.
Notable Trades & Moments
-
CL OPR Long Early Win: One of the first trades of the day hit TGT1 quickly, setting a confident tone.
-
ES Open Range Short: Continued to pay throughout the midday decline with trailers filled around the lows.
-
Volume Trigger 6985 & CD3 Targets: Clean execution zone with PTGDavid guiding level-by-level down through 6954 and ultimately 6939.
-
Afternoon Rebound: Market showed 2-way balance developing post-lunch, and traders saw a bull flag form and play out successfully.
Bearish Dominance Early, Bullish Effort Late
-
Sellers controlled most of the session, erasing the CD1 rally from Monday and hitting deep support zones.
-
Late day, bulls managed a respectable bounce, reclaiming some levels, but PTGDavid noted more work ahead.
Takeaways:
-
Respect Key Levels: 7015 LIS and the 6985 volume trigger defined the day’s structure.
-
Cycle Day Awareness is Critical: Knowing the CD3 context helped anticipate both the selloff and afternoon balance.
-
Stick to the Plan: Those who followed the DTS levels and strategy saw multiple profitable opportunities.
Discovery Trading Group Room Preview – Wednesday, February 4, 2026
-
Market Focus:
-
Corporate earnings, tech stock volatility, AI disruption concerns, and a precious metals rebound.
Tech Sector Weakness:
-
High-growth tech names under pressure amid AI disruption fears.
-
Microsoft (MSFT) and Nvidia (NVDA) both closed down 2% on Tuesday.
-
AMD beat earnings but is down over 7% premarket due to a weak Q1 outlook.
-
Super Micro Computers (SMCI) jumped 11%+ premarket after raising annual revenue guidance, citing strong AI server demand.
Software Stocks Selloff:
-
SaaS names hit hard on concerns AI may replace core functionalities.
-
Anthropic’s AI tool for in-house legal teams triggered sharp declines in legal tech stocks:
-
London Stock Exchange Group (LSEG): -13%
-
Thomson Reuters (TRI): -16%
-
SC Disco (LAW): -12%
-
LegalZoom (LZ): -20%
-
-
S&P North American Software Index fell 15% in January — worst month in 17 years.
-
Microsoft (MSFT) down four days in a row; January was its worst month in over a decade.
Precious Metals Rebound:
-
Gold recovered above $5000; silver around $90 after last week’s steep drop (silver plunged from $121 to $71 in two days).
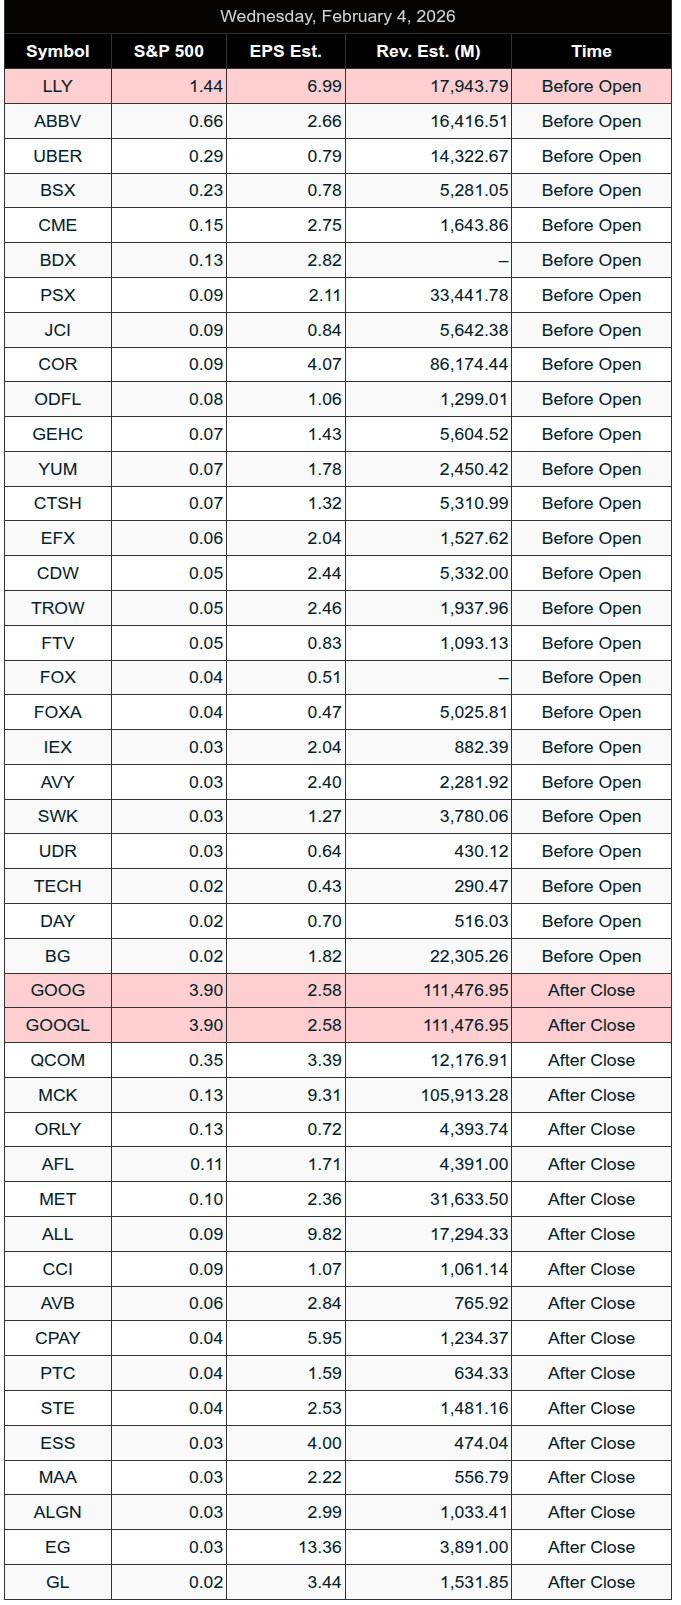
Earnings Calendar Highlights:
-
Premarket: ABBV, LLY, GEHC, UBER, UBS, YUM, PSX, SWK, CDW, COR, CTSH, EQNR, FLEX, JCI, NVO, PFGC
-
After the bell: GOOG[L], ARM, QCOM, AFL, ALL, EQH, MCK, MET, ORLY
-
Thursday morning: BMY, CAH, CARR, CI, COP, CMI, HSY, IQV, LIN, SHEL
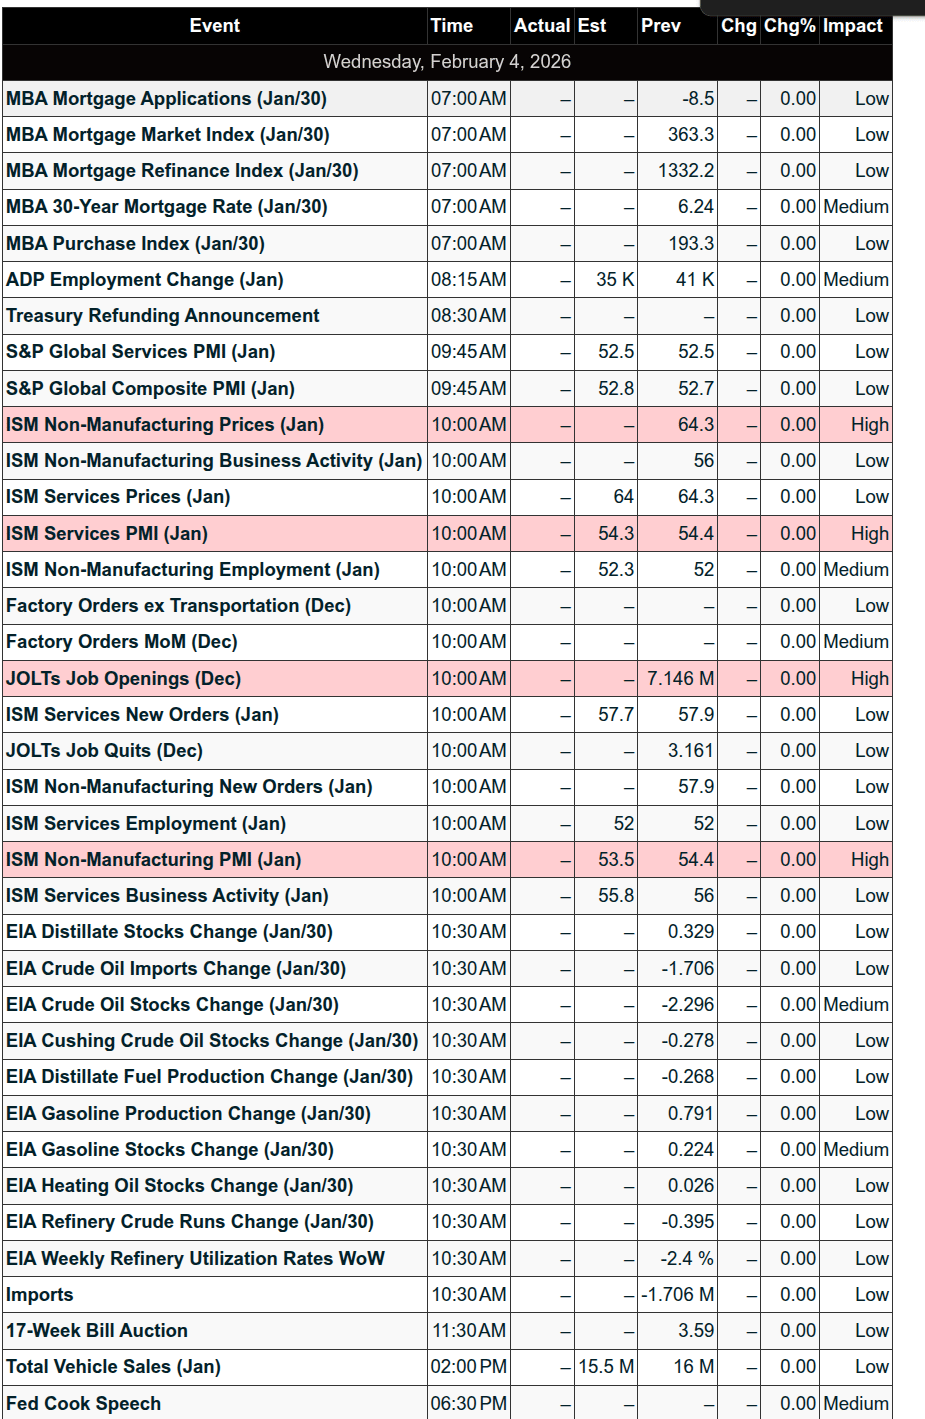
Economic Data Today (ET):
-
ADP Non-Farm Employment Change – 8:15 AM
-
S&P Global Services PMI – 9:45 AM
-
ISM Services PMI – 10:00 AM
-
Crude Oil Inventories – 10:30 AM
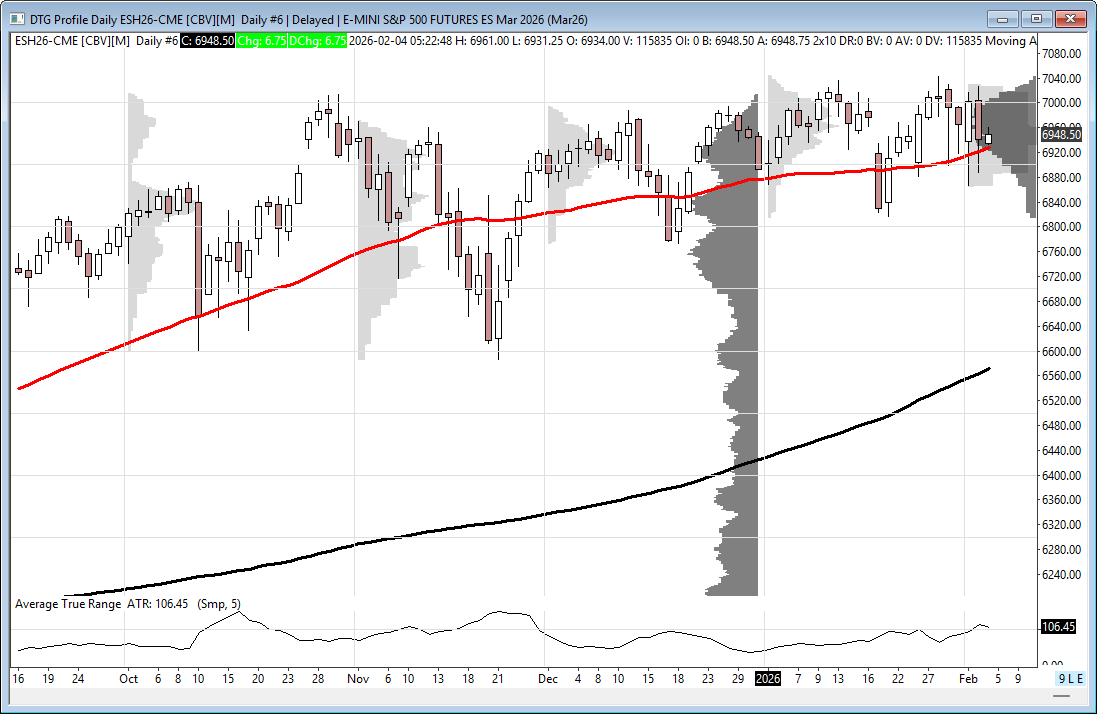
Volatility & Price Action:
-
ES futures range exceeded 140 points Tuesday; volatility remains near extreme levels.
-
Two consecutive outside days hint at a possible breakout from 2+ months of sideways movement.
-
5-day average daily range for ES: 113.75 points.
-
Whale bias is bullish heading into the ADP report, driven by strong overnight volume.
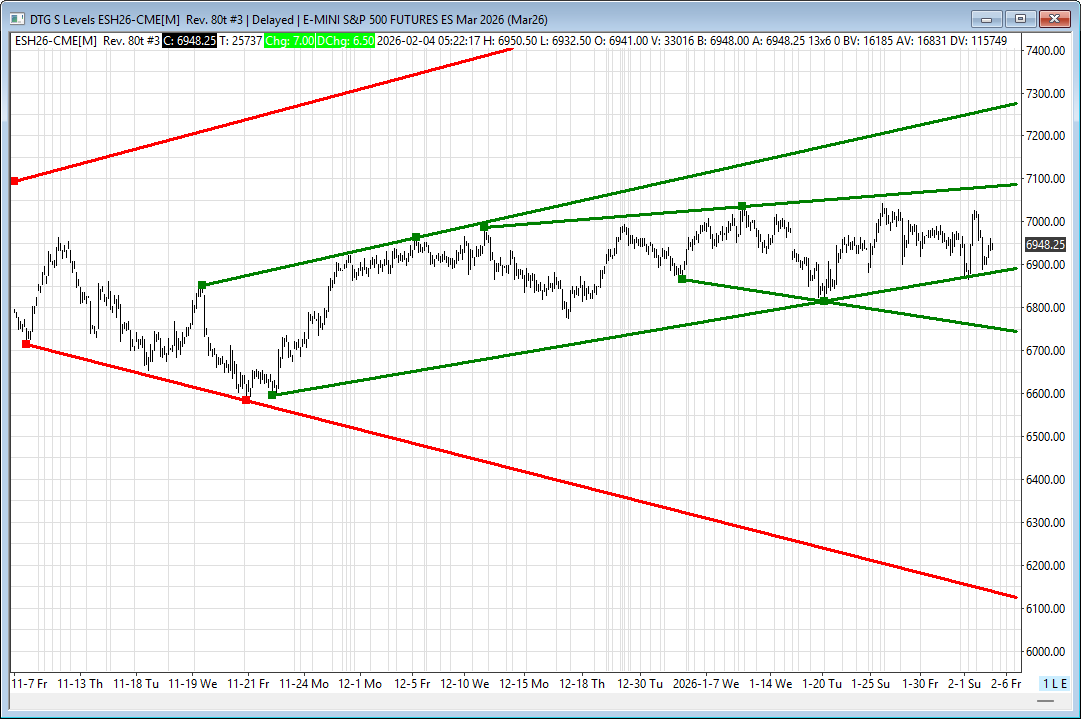
Key ES Levels:
-
Support: 6886–6891, 6750–6745; 50-day MA at 6927.50
-
Resistance: 7085–7090, 7276–7281
-
Channel bottom at 8868–8891 held Tuesday’s low and remains a key support zone.
-
Affiliate Disclosure: This newsletter may contain affiliate links, which means we may earn a commission if you click through and make a purchase. This comes at no additional cost to you and helps us continue providing valuable content. We only recommend products or services we genuinely believe in. Thank you for your support!
Disclaimer: Charts and analysis are for discussion and education purposes only. I am not a financial advisor, do not give financial advice and am not recommending the buying or selling of any security.
Remember: Not all setups will trigger. Not all setups will be profitable. Not all setups should be taken. These are simply the setups that I have put together for years on my own and what I watch as part of my own “game plan” coming into each day. Good luck!
This post goes out as an email to our subscribers every day and is posted for free here around 2 PM ET. To get your real-time copy, sign up for the free or premium version here: Opening Print Subscribe.
Comments are closed