This post goes out as an email to our subscribers every day and is posted for free here around 2 PM ET. To get your real-time copy, sign up for the free or premium version here: Opening Print Subscribe.
April 23, 2026 | Read online
From Strait Fights to All-Time Highs — ES Traders Keep Hitting Bids Like Peace Is a Done Dea
Follow @MrTopStep on Twitter and please share if you find our work valuable!
Our View

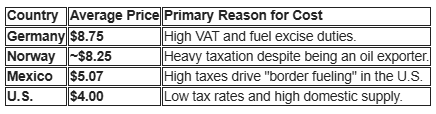
The Global Gas Gap: U.S. vs. The World
While the war in Iran has pushed U.S. gas prices to a four-year high of over $4 a gallon, American consumers still pay significantly less than their international counterparts. This discrepancy isn’t due to the cost of crude oil, but rather domestic policy and production advantages.
Key Drivers of Lower U.S. Prices
-
The Tax Advantage: Taxes are the single biggest factor in price differences. In the U.S., federal and state taxes make up only about 15% ($0.60) of a $4 gallon, while in Europe, taxes typically account for 50% to 60% of the total retail price.
-
Energy Independence: As the world’s top oil producer, the U.S. is better shielded from global supply shocks than many other developed nations.
-
Infrastructure Strategy: While countries like Germany and France use high fuel taxes to fund public transit and green initiatives, the U.S. maintains lower rates to support its car-centric culture, where the average driver travels 13,000 miles annually.
Comparative Snapshot (March Averages)
Our View
The mullahs are out and the IRGC is in. Since early March, Brigadier General Ahmad Vahidi has consolidated power as Commander-in-Chief of the IRGC following a rapid succession of leadership due to the Iran war. Vahidi, a veteran hardliner, now functions as the “grey cardinal” of Tehran. By dominating strategic coordination and exercising a silent veto over civilian government, he has effectively become the most powerful man in the country, steering both the military machine and the political future of Iran. He’s a hardliner and has shown no interest in negotiations with the US.
Wow, it’s 8:19 pm Wednesday and the PitBull just called; while we were on the phone, crude oil jumped $4, and the ES dropped from 7162.50 down to 7105.50 and then rallied 40 points up to 7145.00 in less than 5 minutes off of some BS headline from the Washington Defender about some bogus headline on X. Just another bad example of how stupid things have gotten.
Our Lean
Despite the lack of an agreement to meet in Islamabad, all three major indexes climbed yesterday, with the ES notching its 8th record close in 2026. The gain extended the rally that has pushed the index to multi-all-time highs, even as Iran refuses to keep a permanent peace agreement and attacks ships in the Strait of Hormuz. I read a Bloomberg story saying that it could take 6 months to get a deal and clear the Strait.
Depending on what you read about the war, the total loss is $60 billion as of April 20, but some say the cost is between $2 to $3 billion a day, and the Pentagon has already requested an additional $200 billion from Congress to sustain operations for the remainder of the year. Professor Linda Bilmes warns that once interest payments on war debt and long-term veteran care are factored in, the total cost could eventually exceed $1 trillion. To illustrate the scale, the Center for American Progress notes that the $25 billion spent in the first few weeks is equivalent to the annual cost of providing Medicaid for over 3 million people.
I generally am good at picking through things, but there are so many known and unknown moving parts, I just don’t know what to think. What we do know is that the president’s cease-fire extension doesn’t bring any clarity!
Our lean: The index markets continue to price in a deal being made, and the mediators are pushing to get Iran and the US back to the negotiating table this Friday, but the fight for control of the strait goes on. I think that’s right, but the longer this drags on, the worse it gets. I can’t rule out some drops or sell-offs, but they continue to get bought; bottom line, it’s still a “buy the pullbacks” market.
Take a Free Premium Trial to see this section in action.
Guest Posts:
Dan @ GTC Traders
Running Her Hot … Until Something Breaks
In the movie Ford vs. Ferrari (however true the actual incident was), it was shown that operating under the oderous committee’s of the Ford Motor Company … the Ford GT has been ordered to keep it under 7000 RPM while racing. Preserve the engine. Stay within limits. Stay within what the engineers and the committees have deemed “safe.” And for a while … that constraint governed how the vehicle and driver raced. Speed was capped, and risk was managed. The system was contained.
Until Carroll Shelby had enough, finally breaks from that constraint … and sends a simple message to Ken Miles:

7,000 plus … Go Like Hell.
Push it beyond the limit. Run it hot. Accept that something may give … something may even break … but the decision has been made to win no matter what the cost.
That may bear some relevance to what we see in markets.
For a long time, we have stated that monetary policy has been far too loose for far too long. We have long complained that rates were cut too quickly, too aggressively. Financial conditions were eased into an environment that did not warrant it. The result was not stability … it was the embedding of structural inflationary pressure into the system we have discussed for years. We were right.
Then, for the last month and a half, we have witnessed crisis-level global energy dislocations. Physical shortages beginning to appear in oil and refined products from Europe to Asia. Major carriers cutting capacity as Lufthansa cut 20,000 flights, citing such shortages. Supply chains under stress.
And yet … U.S. equities push to new highs.
To many, this looked completely irrational. We’ll admit it was confusing to us for a while, before we realized that it is all part and parcel of the same policy environment.
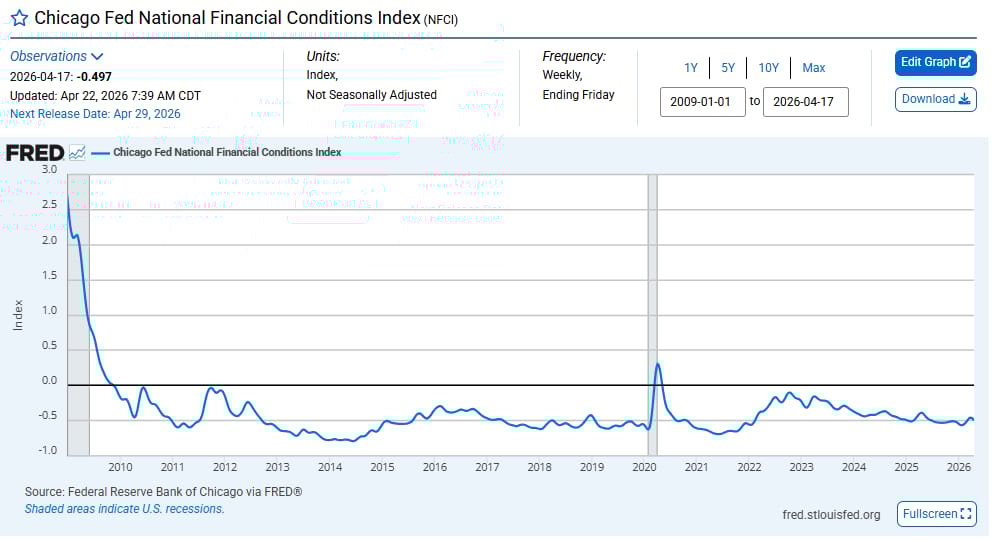
As Danny Dayan correctly pointed out in referencing the Financial Conditions Index in his X stream …
“When policy is restrictive, markets take even the smallest bad news poorly. When policy is loose, markets brush off even catastrophic news.”
That is exactly what we are witnessing.
The system has been told, implicitly and explicitly …
7,000 plus … Go Like Hell.
Liquidity is abundant. Risk is tolerated. Bad news is discounted. The marginal buyer is not focused on deteriorating fundamentals, but on the availability of capital and the expectation of continued accommodation. War? Ignored. Supply shock? Discounted. Structural inflation? Deferred.
Because the engine is being run hot.
And when you run a system hot for long enough … two things happen.
First, performance looks exceptional. Markets rally. Volatility compresses. Drawdowns are shallow. Participants begin to believe the system is more stable than it actually is.
Second … the underlying stress accumulates.
Components degrade. Margins for error shrink. Correlations tighten. Liquidity, which appears abundant, becomes conditional. And when the system finally reaches its limit … it does not fail linearly.
It fails all at once.
We have yet to see that last part. But we do feel that it is absolutely and consistently misunderstood. Loose financial conditions do not eliminate risk. They postpone its expression. They allow imbalances to build beneath the surface while price action signals the opposite.
Which brings us to the present.
Given the above we are not surprised by the rally. Given the policy backdrop, it is entirely consistent. In fact, it would be more surprising if markets were not rallying under these conditions.
But that does not make it sustainable.
Because the same factors driving the rally are the ones embedding the instability. Structural inflation is not resolved. Supply constraints are not resolved. Geopolitical tensions are not resolved. They are simply being overwhelmed … temporarily … by liquidity and positioning.
Run her hot.
Until something breaks.
We do not know the exact point of failure. No one does. Timing is always the variable that humbles participants. But we do understand the structure of the system we are operating in. And right now, that structure is one of excess, of compression, of latent instability.
So while others chase the highs, we remain grounded in process. Aware of the regime. Respectful of the asymmetry.
Because when the engine finally gives … it will not send a warning.
Until next time, stay safe and trade well.
Market Recap:
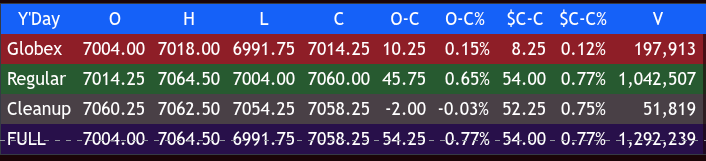
After a big whipsaw trade late in the day Tuesday, the ES traded up to 7157.25 and opened Wednesday’s 9:30 ET regular session at 7150.75.
After the open, the ES traded up to 7166.25, pulled back to 7153.25, and rallied up to a lower high at 7165.75 at 10:40. It then sold off down to a new low at 7151.75 at 11:05, rallied up to 7164.00 at 11:25, and sold off down to a new low just below the VWAP at 7150.00 at 11:45.
The ES then back-and-filled above the VWAP in a 7 to 9 point range, broke down to a new low at 7146.50 at 12:25, and continued to back-and-fill just below and just above the VWAP. It traded 7146.75 at 12:55, rallied up to 7163.00 at 1:20, and fell back into another round of back-and-fill until 2:10, when the ES again pulled back under the VWAP down to 7150.50.
The ES traded up to 7159.50 at 2:45, had one last push under the VWAP down to 7150.00, and then stutter-stepped back up to 7165.75 at 3:55. It traded 7165.50 as the 3:50 cash imbalance showed $3.1 billion to buy, rallied up to 7173.00, and traded 7170.25 on the 4:00 cash close.
After 4:00, TSLA reported earnings and beat on earnings but missed on revenue; the ES sold off down to 7160.00 and settled at 7164.50, up 64.50 points or 0.91%. The NQ settled at 27,106.50, up 471.75 points or +1.77%, the YM settled at 49,888, up 149 points or +0.30%, and the RTY was up 15.80 points or +0.57% on the day.
In the end, you can read between the lines: all sorts of back-and-fill and low volume “thin to win,” with $3.1 billion to buy on the close made for a NHOTC (new highs on the close). In terms of the ES’s overall tone, it was firm and thin. In terms of the ES’s overall trade, volume was the lowest in the last 9 sessions at 1.134 million contracts traded.
The CLK26 made a high at 93.73 and settled at 92.87, up 3.20 points or +x%; while still off its war highs. Gas prices remain stubbornly high but still lower than most places around the world.
Economic Calendar and Earnings
8:30 Initial jobless claims
9:45 S&P PMI
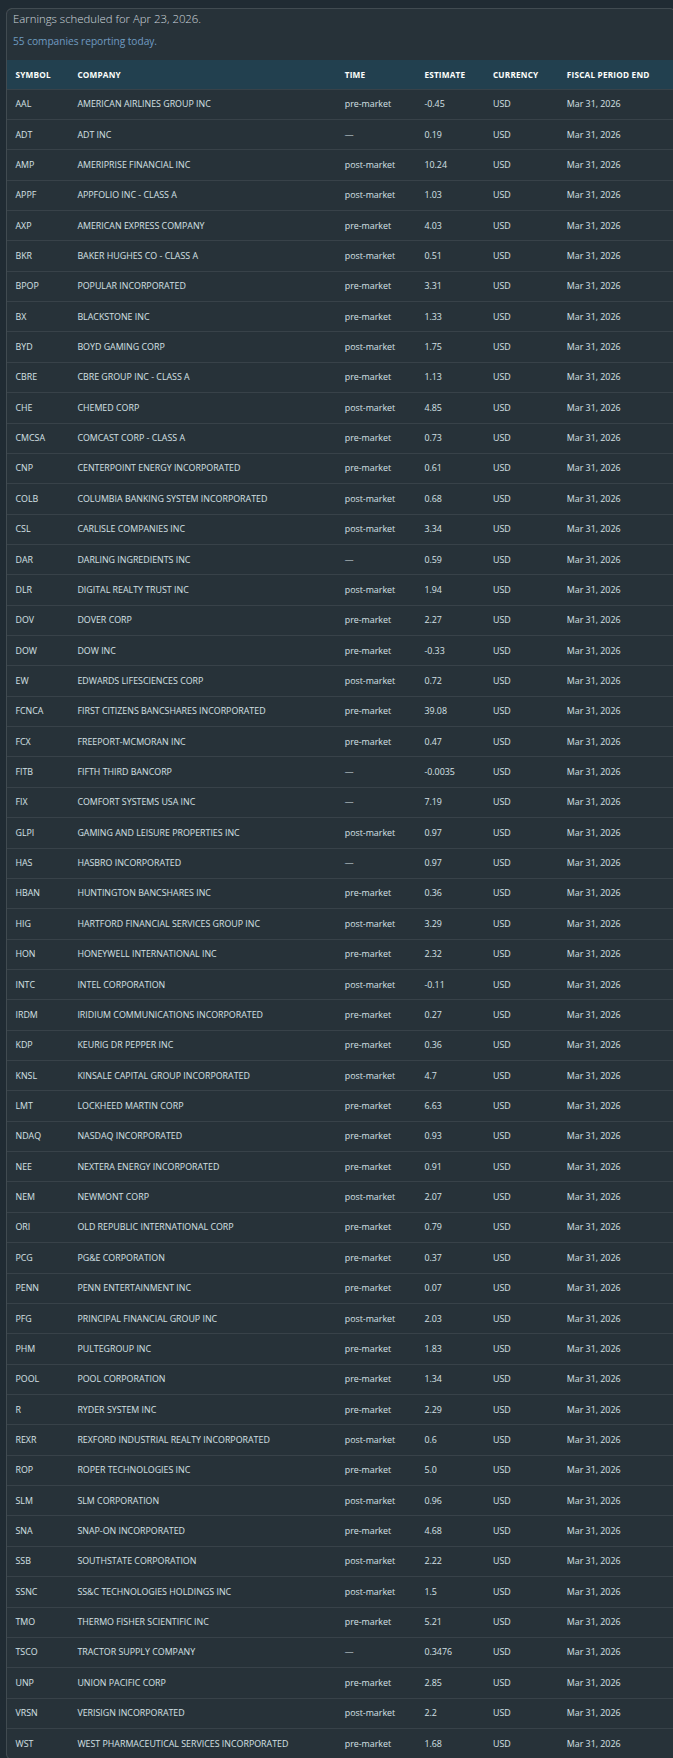
Earnings:
MCSA — Before Open
LUV — Before Open
CME — Before Open
INTC — After Close
DLR — After Close
MiM
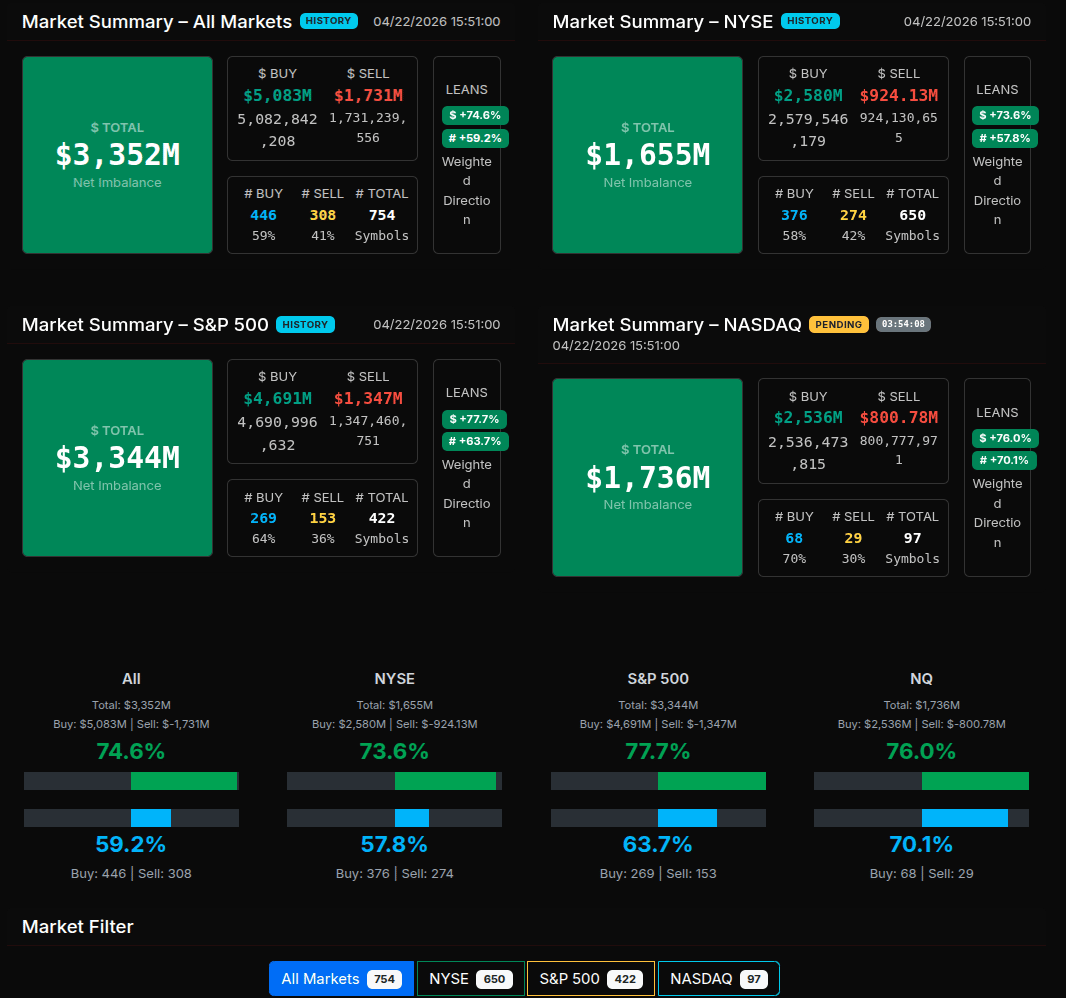
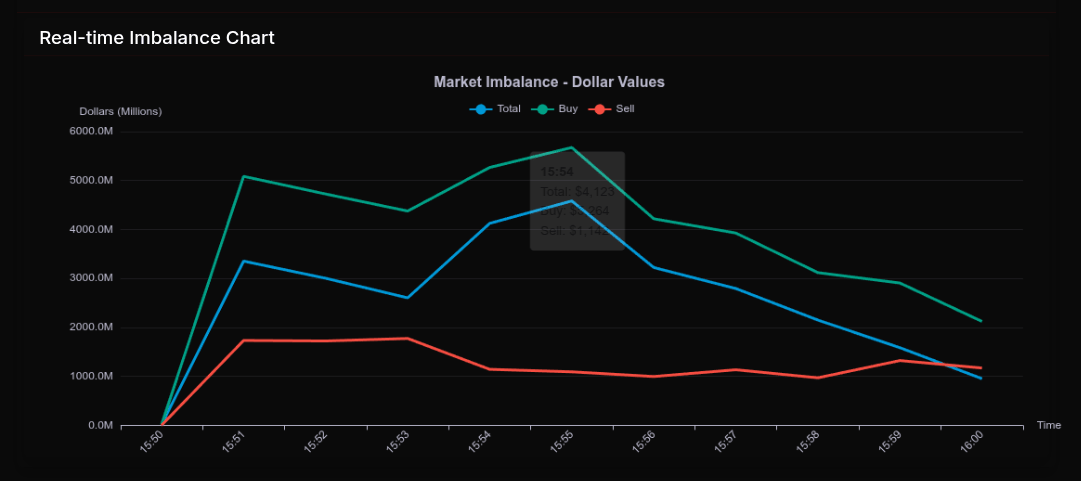
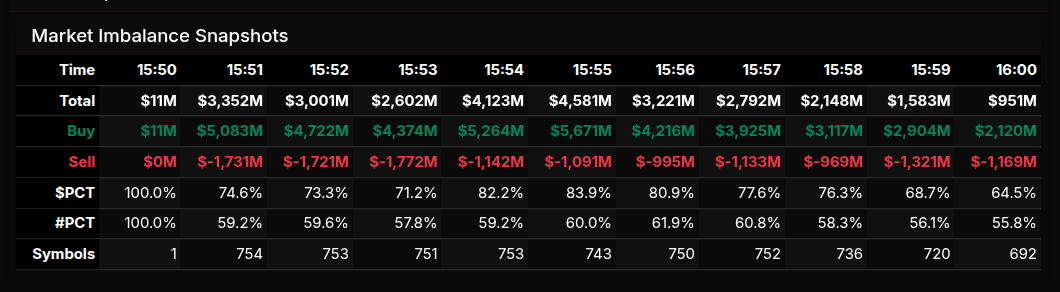
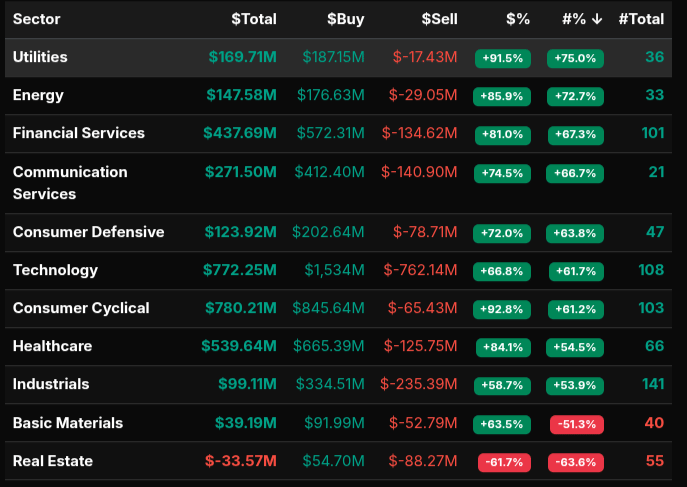
The MOC session opened with an immediate and aggressive buy-side imbalance, setting the tone early as capital flowed decisively into equities. At 15:50, the market showed a clean $2B buy imbalance, jumping to over $3.3B. From there, the session maintained strong buy control, peaking around 15:55 with total imbalances near $4.5B. The $PCT consistently held in the mid-70% to low-80% range, signaling persistent institutional demand rather than rotational noise.
As the session progressed into the final minutes, there was a gradual fade in total imbalance—from the $4B+ range down toward $951M into the close—but importantly, the buy-side dominance remained intact. Even at 16:00, the imbalance still leaned roughly +64.5%, showing that while participation thinned, directional conviction did not fully unwind.
Sector flows reinforced this strong buy-side narrative. Leadership came from Consumer Cyclical (+92.8%), Utilities (+91.5%), and Energy (+85.9%), all showing broad accumulation. Financials (+81.0%) and Communication Services (+74.5%) also contributed meaningfully, suggesting a risk-on posture across both defensive and growth areas. Technology printed a +66.8% lean, right at the threshold of trend, indicating strong but slightly more two-way participation relative to other sectors. The only notable outlier was Real Estate at -61.7%, reflecting a clear pocket of distribution.
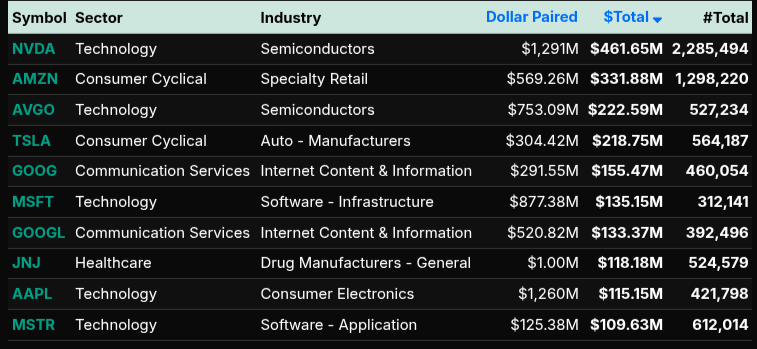
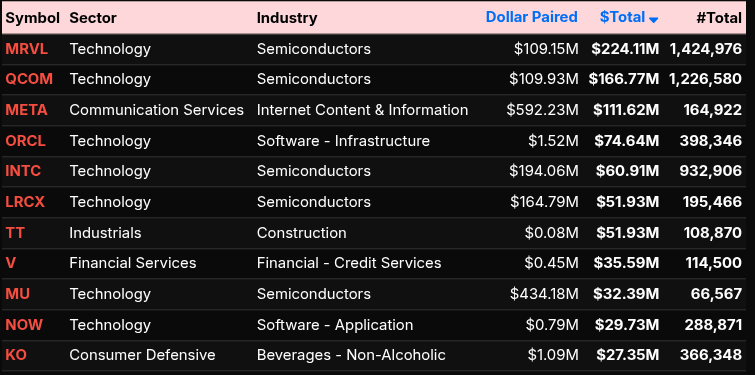
At the symbol level, flows were concentrated in mega-cap leadership. NVDA (+$461M), AMZN (+$331M), AVGO (+$222M), and TSLA (+$218M) led the buy programs, alongside strong participation in GOOG/GOOGL and MSFT. Semiconductors were particularly dominant, with names like MRVL, QCOM, INTC, and LRCX all seeing steady demand. META also stood out on the communication side, reinforcing the tech-heavy bid.
Overall, this was a structurally bullish MOC. The session opened with urgency, built into broad-based institutional buying, and while it tapered into the close, it never transitioned into meaningful sell pressure—indicating accumulation rather than rotation.

Replay:

Technical Edge
Fair Values for April 23, 2026
-
S&P: 34.09
-
NQ: 149.15
-
Dow: 170.43
Daily Breadth Data 📊
For Wednesday, April 22, 2026
• NYSE Breadth: 54% Upside Volume
• Nasdaq Breadth: 67% Upside Volume
• Total Breadth: 62% Upside Volume
• NYSE Advance/Decline: 55% Advance
• Nasdaq Advance/Decline: 64% Advance
• Total Advance/Decline: 60% Advance
• NYSE New Highs/New Lows: 106 / 15
• Nasdaq New Highs/New Lows: 279 / 76
• NYSE TRIN: 1.03
• Nasdaq TRIN: 0.88
Weekly Breadth Data 📈
For the Week Ending Friday, April 17, 2026
• NYSE Breadth: 66% Upside Volume
• Nasdaq Breadth: 73% Upside Volume
• Total Breadth: 70% Upside Volume
• NYSE Advance/Decline: 76% Advance
• Nasdaq Advance/Decline: 80% Advance
• Total Advance/Decline: 79% Advance
• NYSE New Highs/New Lows: 284 / 59
• Nasdaq New Highs/New Lows: 710 / 264
• NYSE TRIN: 1.70
• Nasdaq TRIN: 1.53
BTS Levels:
ESM2026
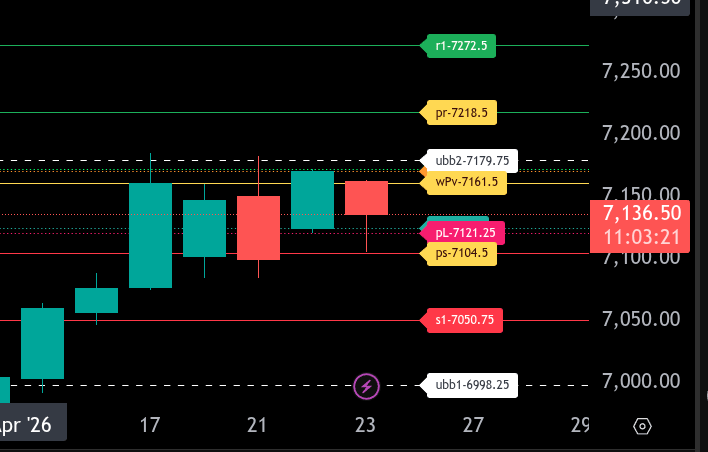
The bull/bear line for ES is at 7161.50. This remains the key pivot for today. Holding below this level keeps the market in a bearish posture, while reclaiming it would be the first step toward regaining upside momentum.
ES is currently trading around 7136.50, positioning it below the bull/bear line and indicating early weakness during the Globex session. As long as price remains below 7161.50, expect downside pressure to continue, with initial support at 7125.00 and 7121.25. A break below these levels opens the door to 7104.50, which is the lower range target for today. If selling accelerates through that level, further downside could extend toward 7050.75.
On the upside, resistance is layered at 7171.25 and then 7179.75. These are key areas where sellers may step back in. If buyers can reclaim 7161.50 and hold above it, a move toward 7218.50, the upper range target, becomes likely. A sustained push beyond that level would shift momentum more firmly bullish and open the door to a test of 7272.50.
Overall, the market remains bearish below 7161.50, and rallies into resistance should be treated with caution unless that level is reclaimed and held. The key intraday focus is whether buyers can reclaim the pivot or if sellers press price into the lower range targets.
NQM2026
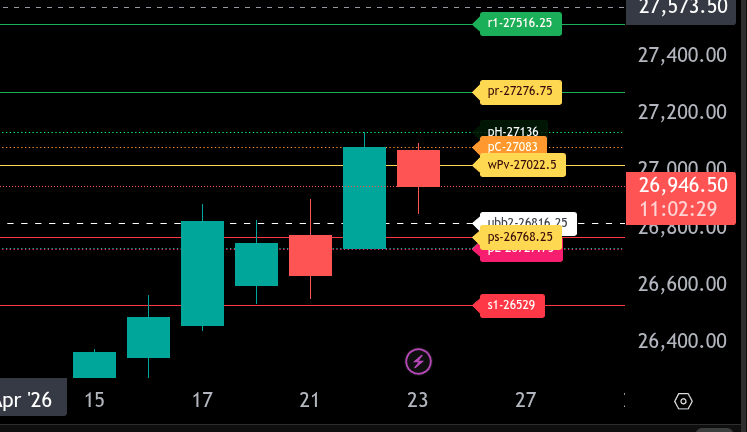
The bull/bear line for the NQ is at 27022.50. This is the key level that must be reclaimed to shift momentum back to the upside. Holding below this level keeps the market in a weaker, sell-the-rip environment.
Currently, NQ is trading around 26946.50, positioning it below the bull/bear line and indicating continued pressure. If price remains below 27022.50, the downside targets come into focus at 26768.25, which is the lower range target for today. A break below this level opens the door toward 26529.00 as the next major support.
On the upside, initial resistance comes in at 27083.00 and 27136.00. If buyers can reclaim 27022.50 and hold above it, we can look for a push toward 27276.75, the upper range target. A sustained move above that level would shift momentum more convincingly bullish and open the door toward 27516.25.
Overall, the market remains bearish below 27022.50, and rallies into resistance should be treated cautiously unless that level is reclaimed and held. A shift above the upper range would signal stronger upside continuation, while continued rejection below keeps pressure on lower supports.
Today’s Economic Calendar
Earnings:
`
Trading Room News:
PTG Room Summary – For Wednesday, April 22, 2026
The day unfolded very much in line with the Daily Trade Strategy (DTS), with a strong emphasis on respecting key levels and staying aligned with the broader bias.
Pre-market & Plan
David set a clear tone early:
-
7125 was identified as the Line in the Sand (LIS) and held firmly overnight.
-
Bias was long above 7125, with a bull case targeting 7140 → 7145 → 7155.
-
The session was labeled Cycle Day 2, with expectations for typical rhythm and expansion.
Right out of the gate, the market validated the plan:
-
7155 target was fulfilled early, reinforcing the importance of trusting the pre-market roadmap.
Morning Session
-
The team maintained a “long-lean” posture, with David emphasizing that dips remained buyable.
-
Key execution concept: buying pullbacks into ATR support (ATR 7 Bull) and playing mean reversion setups.
-
Members discussed structure:
-
Watching consolidation breaks (CC) and first pullbacks
-
Staying aware of 50% retracement levels and prior key breakout zones (PKB)
-
Lesson: Structured pullbacks in a bullish environment provide high-probability entries—don’t chase, let price come to you.
Midday
-
As expected, edge diminished into midday:
-
Narrowing ranges
-
Choppy price action
-
-
David explicitly called out “midday chop” and advised stepping away.
Lesson: Recognizing when not to trade is just as valuable as finding entries. Protecting capital during low-edge periods is key.
Afternoon & Close
-
Market rotated tightly around mid-VWAP, confirming low momentum conditions.
-
Late-day development:
-
$3.1B MOC buy imbalance
-
Price pushed to close near highs of the day
-
This confirmed underlying strength and validated the earlier long bias.
Key Takeaways
-
Plan execution matters: The 7125 LIS and upside targets worked cleanly.
-
Stay aligned with bias: Long setups continued to offer opportunity throughout the morning.
-
Buy the dip in trend: ATR-based pullbacks were effective.
-
Avoid midday chop: Discipline in stepping aside preserved gains.
-
Closing strength reinforced that buyers controlled the session.
Overall, this was a clean, trend-respecting day where traders who trusted the levels, stayed patient on entries, and avoided overtrading likely had a solid session.
DTG Room Preview – Thursday, April 23, 2026
Macro / Geopolitics
-
U.S.–Iran negotiations stalled → weighing on equities & gold
-
Strait of Hormuz remains blocked → oil up 4th straight day
-
Ongoing geopolitical tension keeping volatility elevated
Earnings / Market Drivers
-
Corporate earnings helping offset macro pressure
-
Heavy earnings slate:
-
Premarket: AXP, BLK, CMCSA, HON, LMT, NEM, NEE, FCX, etc.
-
After close: Intel, SAP, GILD, BKR
-
Friday AM: PG, HCA, SLB, NSC
-
Tesla / AI / Robotics
-
TSLA beat earnings → initially higher, then reversed lower
-
Negative reaction driven by:
-
>$25B 2026 capex guidance
-
Implies continued negative free cash flow
-
-
Growth initiatives:
-
AI compute + new factories ramping
-
Megapack 3, Cybercab, Tesla Semi production prep
-
-
Robotaxi:
-
Miles nearly doubled QoQ
-
Cybercab expected to replace Model Y fleet
-
-
Optimus robots:
-
Factory prep starts Q2
-
V3 reveal expected mid-2026
-
Long-term goal:
-
Fremont: ~1M units/year
-
Texas: up to 10M units/year
-
-
-
Skepticism remains around real-world functionality
Semiconductors
-
Tesla to use Intel 14A process → major validation for Intel foundry business
-
Intel stock +3.6% ahead of earnings
-
TSMC:
-
New chip tech announced
-
Focus on lower cost + higher efficiency
-
Avoids need for expensive next-gen EUV machines
-
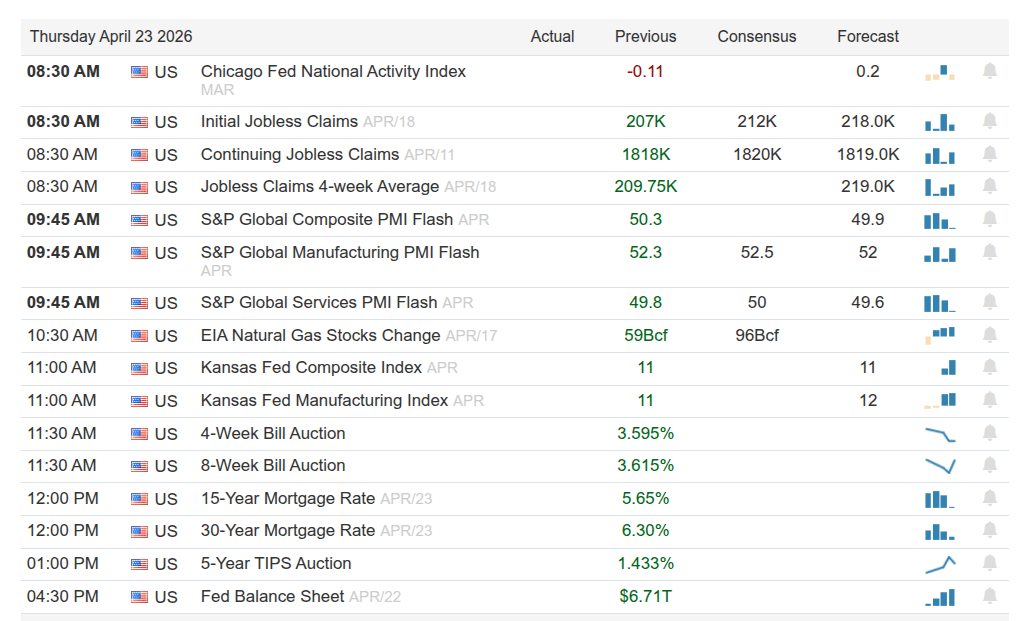
Economic Data (Today)
-
8:30am ET: Jobless Claims
-
9:45am ET: Flash PMIs
Volatility / Positioning
-
ES 5-day avg range: ~80 points (unchanged)
-
Whale bias: bearish into Jobless Claims
-
Overnight volume lighter than recent sessions
Technical Levels (ES)
-
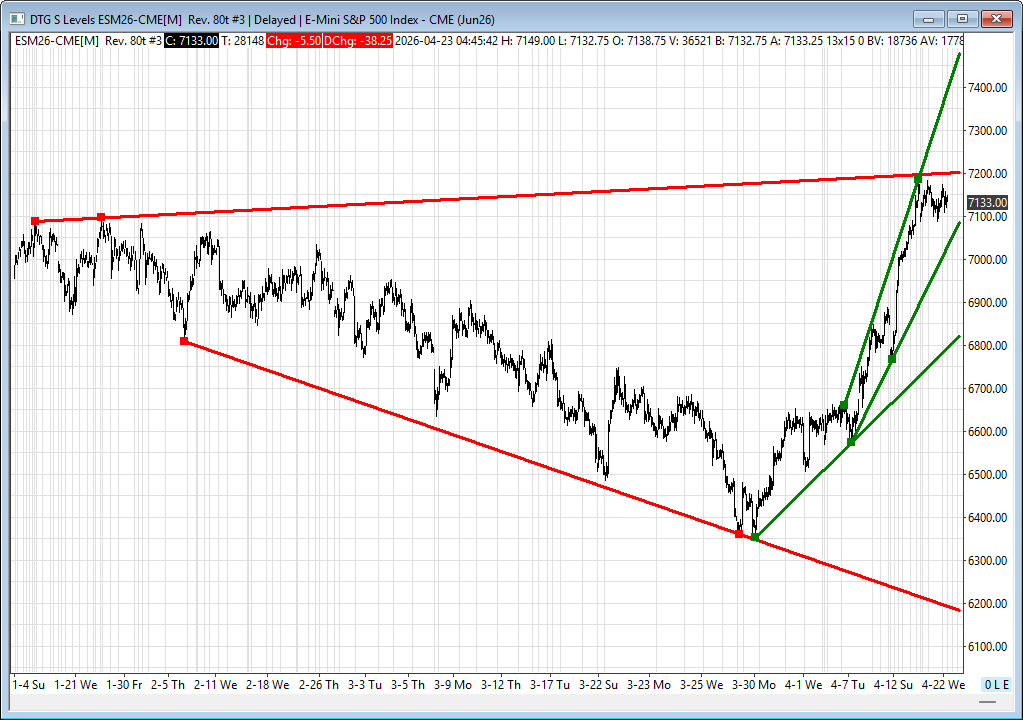
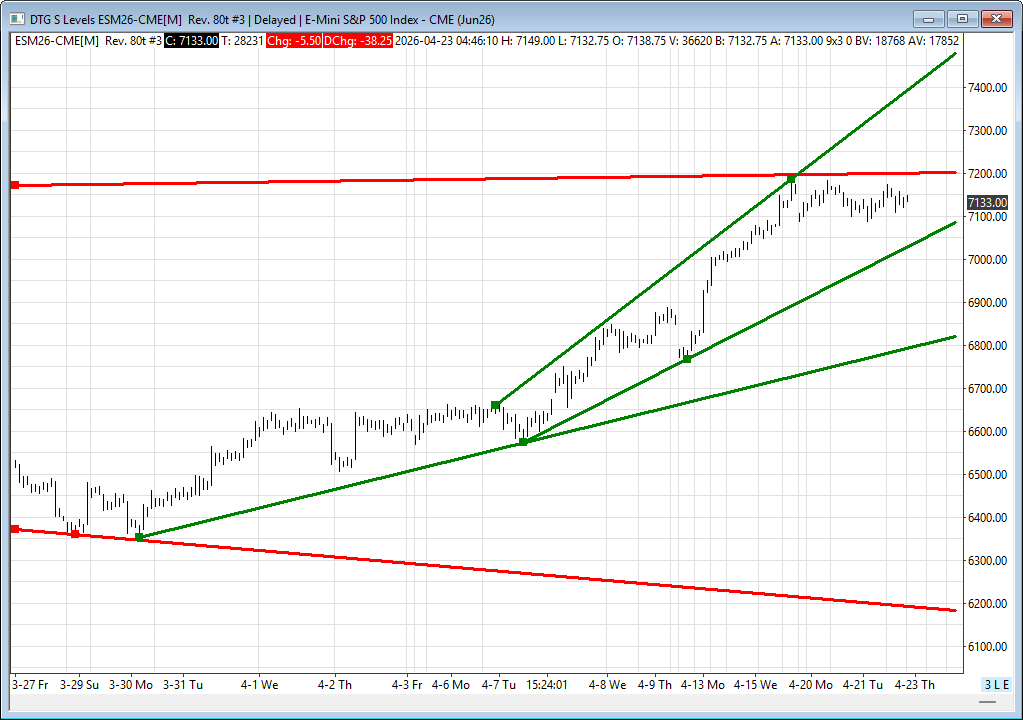
Market still range-bound below ATH
-
Resistance:
-
7200–7203 (trendline)
-
7425–7430
-
-
Support:
-
7030–7035 (channel support)
-
6805–6810
-
6185–6180 (major downside)
-
-
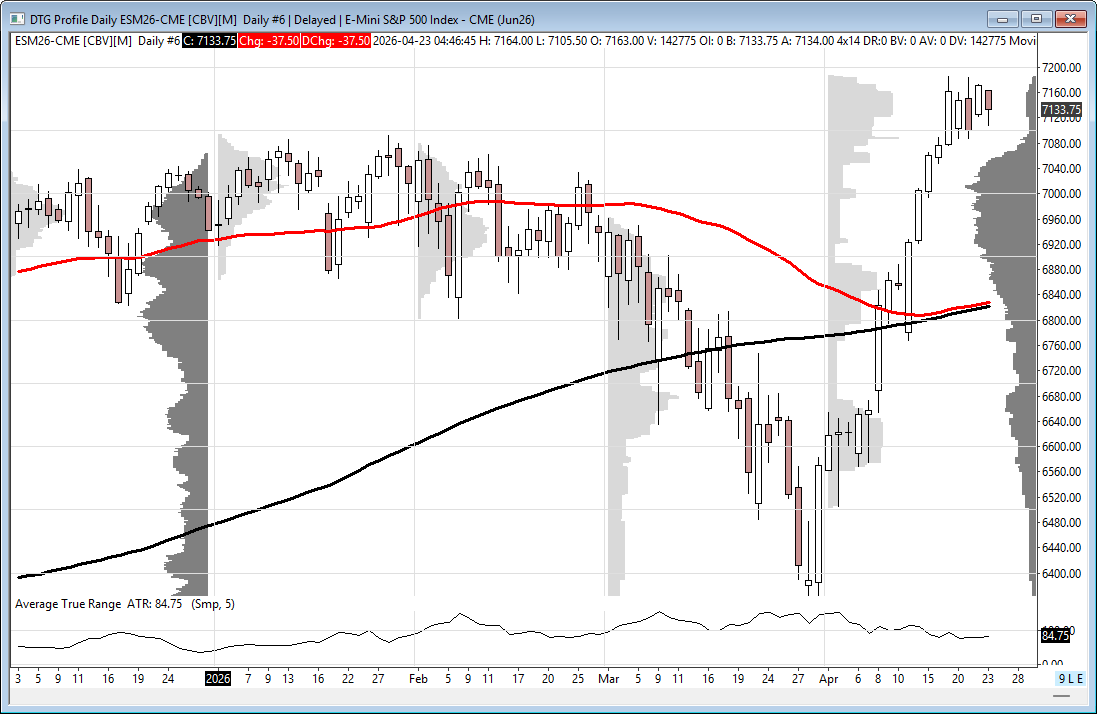
Moving averages:
-
50D (6827) > 200D (6822) → bullish bias intact
-
Bottom Line
-
Market caught between:
-
Geopolitical risk (bearish)
-
Earnings + AI/semis momentum (supportive)
-
-
Focus today: Jobless Claims + key technical levels
Affiliate Disclosure: This newsletter may contain affiliate links, which means we may earn a commission if you click through and make a purchase. This comes at no additional cost to you and helps us continue providing valuable content. We only recommend products or services we genuinely believe in. Thank you for your support!
Disclaimer: Charts and analysis are for discussion and education purposes only. I am not a financial advisor, do not give financial advice and am not recommending the buying or selling of any security.
Remember: Not all setups will trigger. Not all setups will be profitable. Not all setups should be taken. These are simply the setups that I have put together for years on my own and what I watch as part of my own “game plan” coming into each day. Good luck!
This post goes out as an email to our subscribers every day and is posted for free here around 2 PM ET. To get your real-time copy, sign up for the free or premium version here: Opening Print Subscribe.
Comments are closed