This post goes out as an email to our subscribers every day and is posted for free here around 2 PM ET. To get your real-time copy, sign up for the free or premium version here: Opening Print Subscribe.
From the Pit to the Blockchain: Somebody Always Knows First
Follow @MrTopStep on Twitter and please share if you find our work valuable!
Our View
The Trumps and Bitcoin
I think if you ask most people about Bitcoin, they’ll say it’s dead in its tracks. And while President Donald Trump has not publicly confirmed his personal purchases or direct holdings of Bitcoin as of early January 2026, his cryptocurrency exposure is entirely indirect—primarily through Trump Media & Technology Group (TMTG), the parent company of Truth Social, in which he holds majority ownership.
In 2025, TMTG built a substantial corporate Bitcoin treasury that reached approximately $2 billion in Bitcoin and related assets, holding around 11,542 BTC by late December. That stake is valued at over $1 billion despite price fluctuations, giving Trump a significant indirect stake previously estimated at around $870 million.
Additionally, a separate family-backed venture—American Bitcoin—co-founded by sons Eric Trump and Donald Trump Jr., holds over 5,427 BTC, while other family projects like World Liberty Financial have focused on DeFi and token sales rather than direct Bitcoin accumulation.
The U.S. government’s Strategic Bitcoin Reserve, established under Trump in March 2025, consists solely of seized assets—around 200,000 BTC—with no taxpayer-funded purchases.
In short, while Trump has not bought Bitcoin personally, his company’s aggressive treasury strategy has made him one of the largest indirect Bitcoin holders through corporate ownership.
Wall Street Journal: American Bitcoin Stock Jumps After Buying from Eric Trump, Other Insiders
Shares of American Bitcoin, a Bitcoin mining and treasury company backed by Eric Trump and Donald Trump Jr., jumped on Monday after recent stock purchases by insiders.
The shares rallied as much as 18% Monday afternoon. They had fallen 15% in 2025. Bitcoin recently traded above $94,000 after bouncing off recent lows.
American Bitcoin insiders, including Chief Strategy Officer Eric Trump, Executive Chairman Asher Genoot, Chief Executive Michael Ho, and director Richard Busch, bought nearly 24 million shares between Dec. 16 and Jan. 2, according to regulatory filings.
Eric Trump, who is also a co-founder of the firm, purchased 285,000 shares on Dec. 18. He now owns a total of more than 68 million shares, giving him a 7.4% stake in the company, a filing shows.
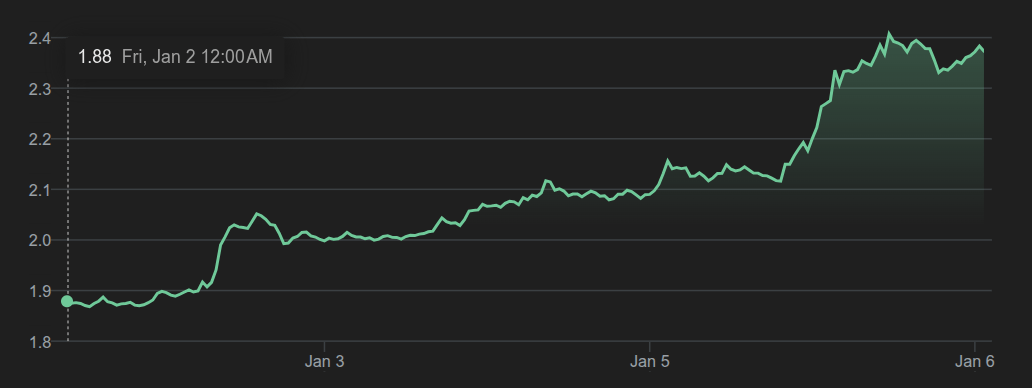
I said last year that President Trump will announce some type of stablecoin this year, and I think the family is setting up the table. What I don’t know is how to get in front of it. A lot of investors have been pushing XRP—and like everything else, the front-run is on.
Below is a 5-day chart of XRP. You tell me what you think is going on!
Our View
INSIDER TRADING
If you still think the boys with the better theater seats don’t exist, I think you are sadly mistaken.
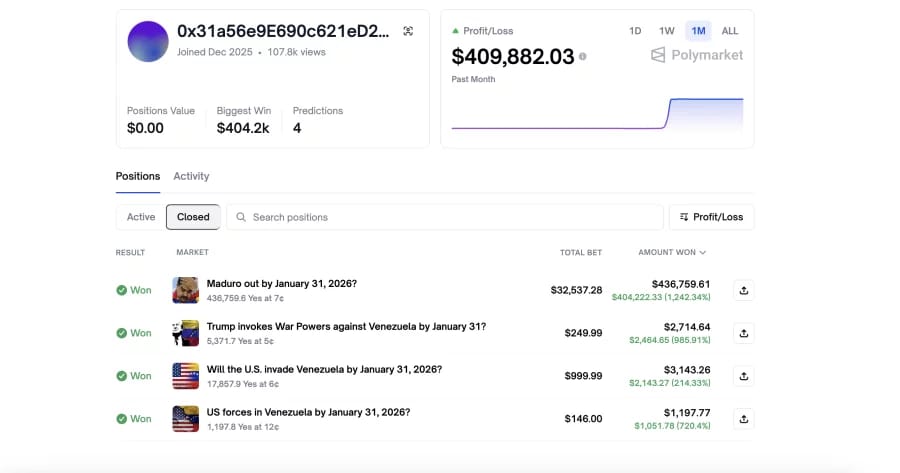
All you have to do is Google SEC front-running cases. The most recent was the Polymarket bets for $32,000 that Maduro would be toppled by the end of January, just days before Trump ordered the operation. When it was clear the U.S. had captured Maduro, the trader made more than $400,000 in profit.
The original account went under the handle “Burdensome-Mix” before changing its display name to a string of letters and numbers. It joined Polymarket just weeks ahead of making the Maduro trade.
The front-running has become much more visible since Trump took office, and guess what? The largest front-run in the history of the U.S. is coming this year.
Our Lean
I think the ES is going to make new contract highs. You can sell the early rallies and buy the pullbacks, or just be patient and buy the pullbacks.
ES Support:
6930, 6910, 6900, 6800–85
ES Resistance:
6975–6978, 6989, 6999, 7004, 7014
The majority of the buy stops start above 6987.

Santa Claus Rally Comes Up Hair Short, Focus on January Barometer
From Jeff Hirsch @AlmanacTrader
For several hours today it looked like the Santa Claus Rally was going to materialize but Santa was a no-show for the third year in a row despite solid market gains today. From its close of 6909.79 on December 23, 2025, through today’s close of 6902.05, S&P 500 declined 0.11% thus the Santa Claus Rally is now officially negative. For what it’s worth the Dow was up 1.1% over the Santa Claus Rally period and logged a new all-time high today to ring in the year with across-the-board strength.
Defined in the Stock Trader’s Almanac, the Santa Claus Rally (SCR) is the propensity for the S&P 500 to rally the last five trading days of December and the first two of January with an average gain of 1.3% since 1950. This indicator was discovered and first published by Yale Hirsch in the 1973 edition of the Almanac.
The lack of a rally can be a preliminary indicator of tough times to come. This was certainly the case in 2008 and 2000. A 4.0% decline in 2000 foreshadowed the bursting of the tech bubble and a 2.5% loss in 2008 preceded the second worst bear market in history. Down SCRs were followed by flat years in 1994, 2005 and 2015, and a mild bear that ended in February 2016. In 2024, New Year’s jitters were quickly shrugged off, and the S&P 500 logged its second straight yearly gain in excess of 20%. However, last year, in 2025, the absence of Santa preceded the brisk tariff-induced selloff that knocked S&P 500 down 18.9% from its February closing high to its April 8 closing low. Of the 17 down SCRs since 1950, 12 years have been up and 5 down, but the average gain is a tepid 6.7%. As Yale Hirsch’s now famous line states, “If Santa Claus should fail to call, bears may come to Broad and Wall.”
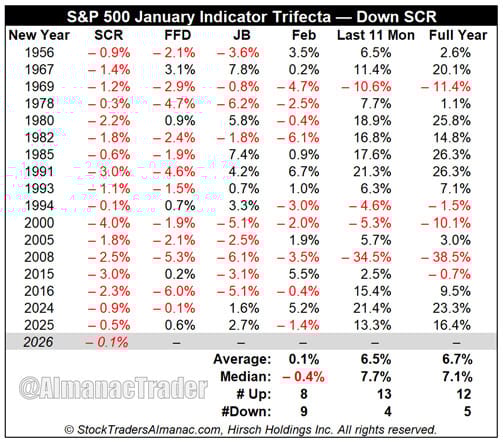
With the Santa Claus Rally a no-show, we will be watching for a positive First Five Days (FFD) and January Barometer (JB), the second and third legs of our January Indicator Trifecta. With two more January indicators remaining, we will reserve final judgement until the end of January when the JB result is officially known. However, should the January Barometer be negative, it will weigh heavily on the outlook for full-year 2026.
Guest Post: Tom Incorvia – Blue Tree Strategies
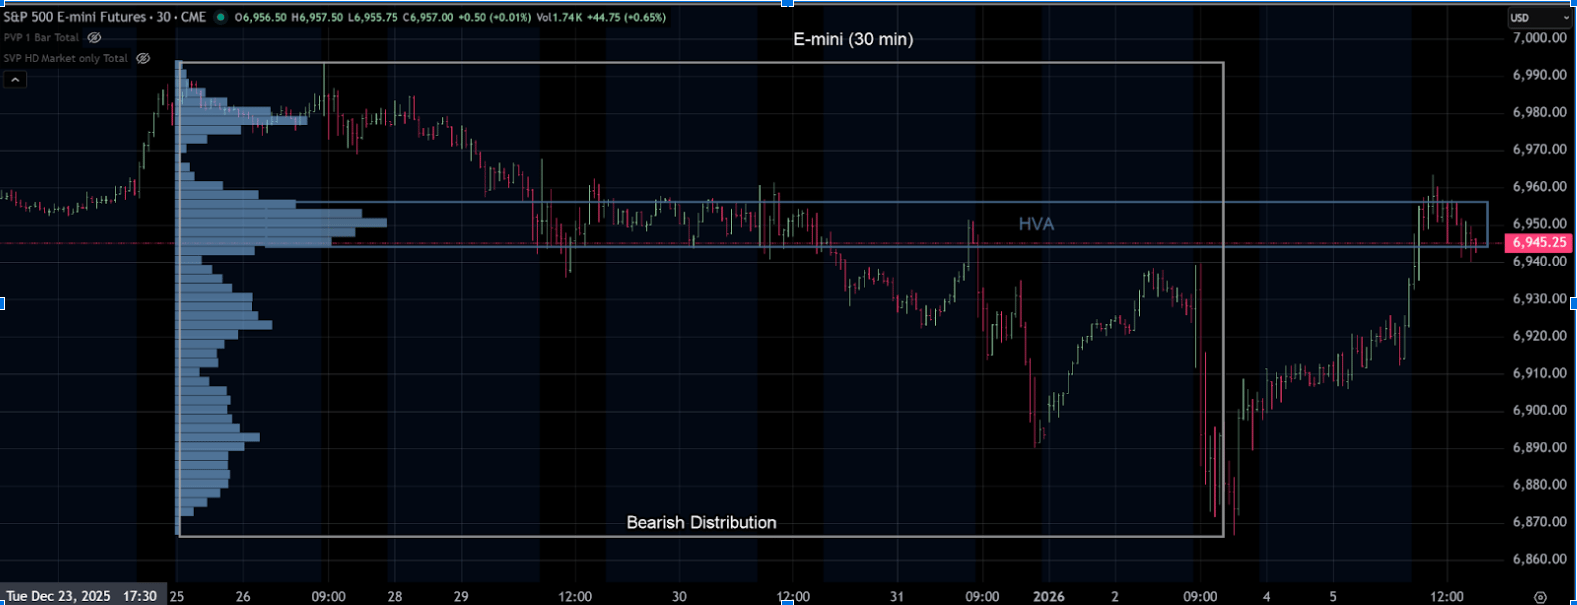
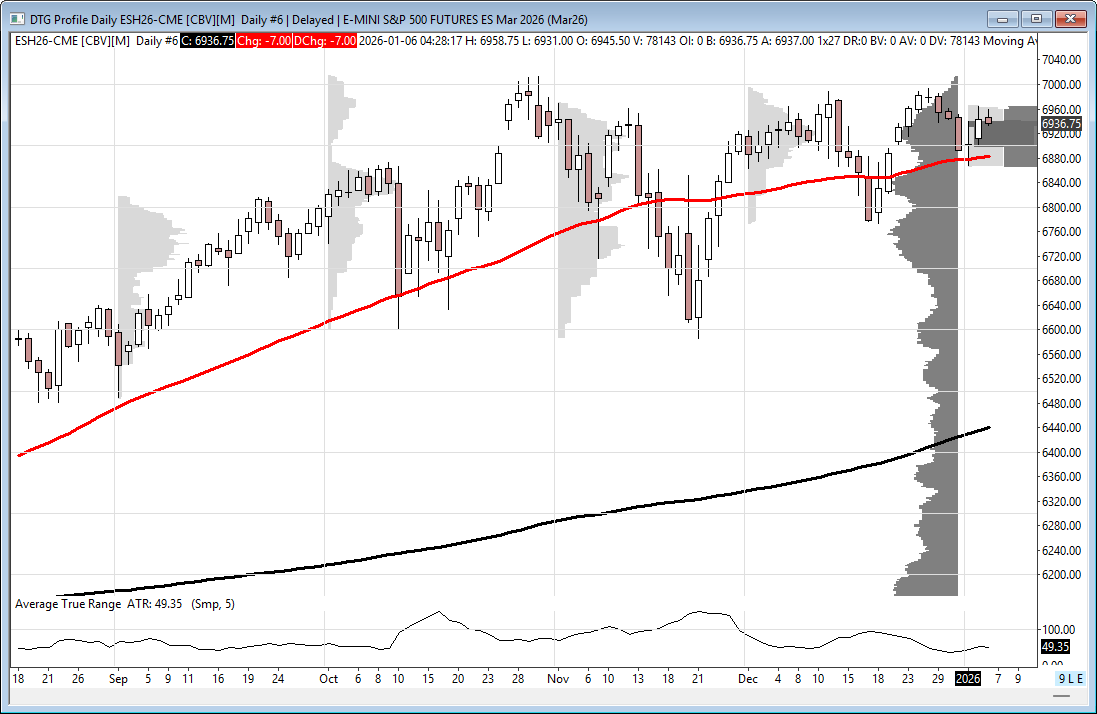
From a market profile standpoint, I constructed a merged volume profile encompassing the range from the December 25th swing high through the January 2nd swing low. That composite distribution reveals a clearly defined high-volume area established during the December 29–30 timeframe. Today’s advance stalled precisely within that prior area of acceptance, which is consistent with well-established market behavior. High-volume areas frequently function as reference points for support or resistance, as they represent zones where two-sided trade previously occurred. Should price achieve sustained acceptance above today’s high, the next upside reference becomes a test of the upper high-volume node near the 6,978 level.
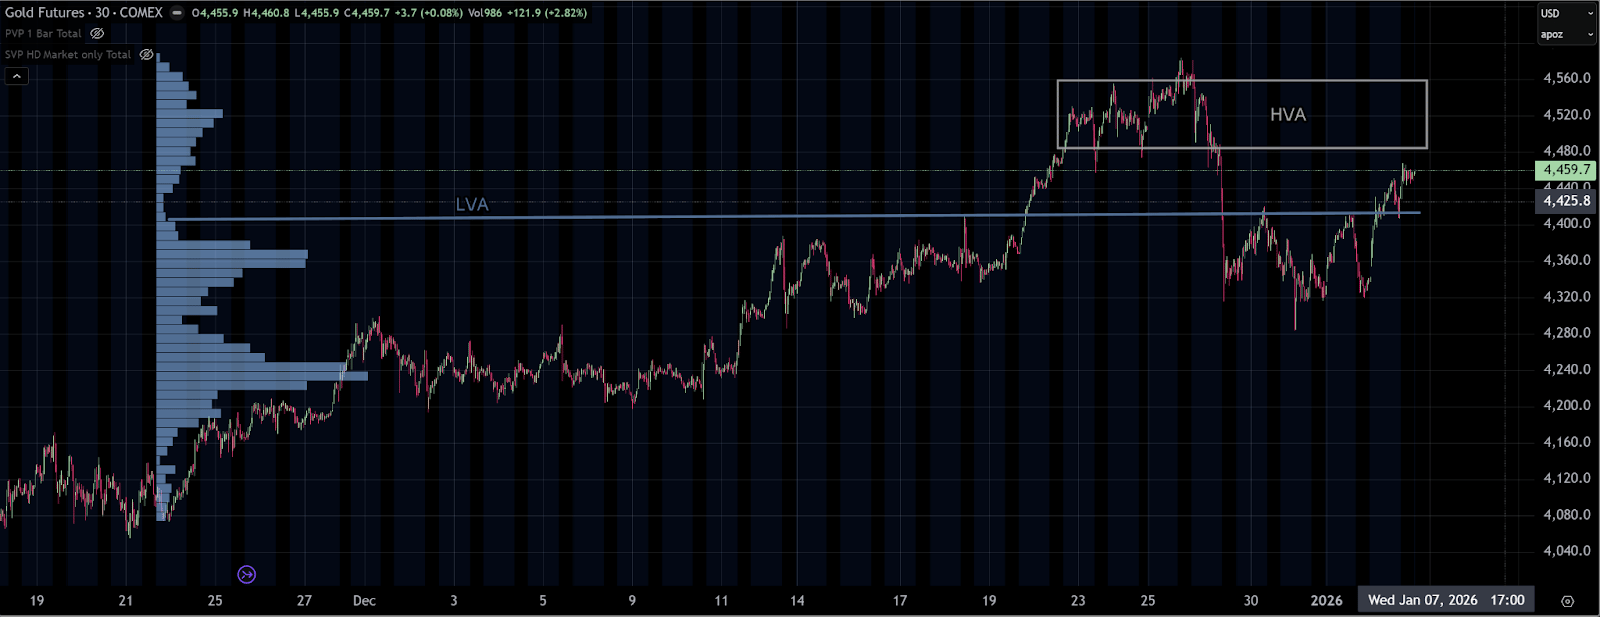
Gold appears to be approaching a technically significant price zone. From a market profile perspective, price has been developing within a sustained bullish distribution dating back to early 2024, reflecting persistent higher value and ongoing buyer control. On Monday, December 29th, the market experienced a sharp liquidation break; however, that sell-off was met with responsive buying, with buyers repeatedly defending the 4,300 level. Subsequent trade established a three-day balance, and today’s auction resolved higher, as demand pushed price out of that balance area. Should price gain acceptance into the prior high-volume area between 4,489 and 4,588, the profile suggests a high probability of a continuation move toward a test of the all-time highs.
You can purchase Tom’s Course on Volume Profile here.
Market Recap
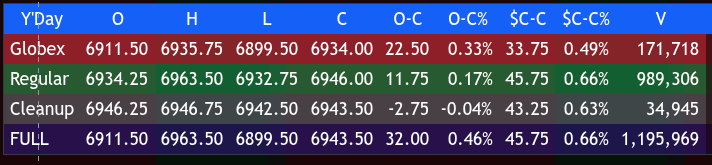
The ES rallied up to 6935.75 on Globex and opened Monday’s regular session at 6924.25, up 0.49% from Friday’s close. After the open, the ES made an RTH low at 6932.50, traded up to 6957.25 at 10:30, traded 6948.50, and then traded up to 6963.50 at 11:50—right into my suggested resistance level at 6960–6965.
It pulled back to 6950.75 at 12:30, traded up to a lower high at 6957.00 at 12:45, pulled back to 6945.00 at 1:15, traded back up to 6957.00 at 1:45, and slowly pulled back to the VWAP at 6941.25 at 2:40. It rallied back up to 6951.00 at 3:15, back-and-filled in a 4-point range until 3:45, and traded 6946.75 as the 3:50 imbalance showed $1.9 billion to sell. It sold off down to 6942.00 at 3:55 and traded 6946.00 on the 4:00 cash close.
After 4:00, the ES flatlined and settled at 6943.50, up 43 points or +0.63%. The NQ settled at 25,578.25, up 193 points or +0.76% on the day. Oil closed up 1% at 58.32, the VIX settled at 14.90, up 2.69%, and gold closed up 121.9 points at 4,451.50
The yield on the 10-yr note fell by -3 bps to 4.16% after the December ISM manufacturing index unexpectedly fell -0.3 to 47.9, worse than expectations of an increase to 48.4 and the steepest pace of contraction in 14 months.
In the end, the index markets shook off the Venezuela news. In terms of the ES’s overall tone, all the indices marched higher, with the YM closing up 604 points or +1.24% to a new contract high. The RTY (Russell futures) settled at 2,560.50, up 38 points or +1.51%. In terms of the ES’s overall trade, volume was low at 1.169 million contracts traded.
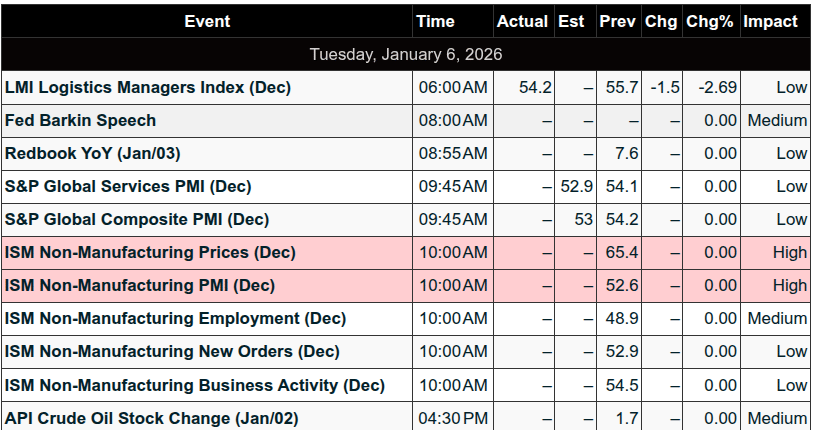
Today’s economic and Fed speak:
8:00 AM – Richmond Fed President Tom Barkin speaks
9:45 AM – S&P Final U.S. Services PMI
MiM
Market-on-Close Recap – MiM
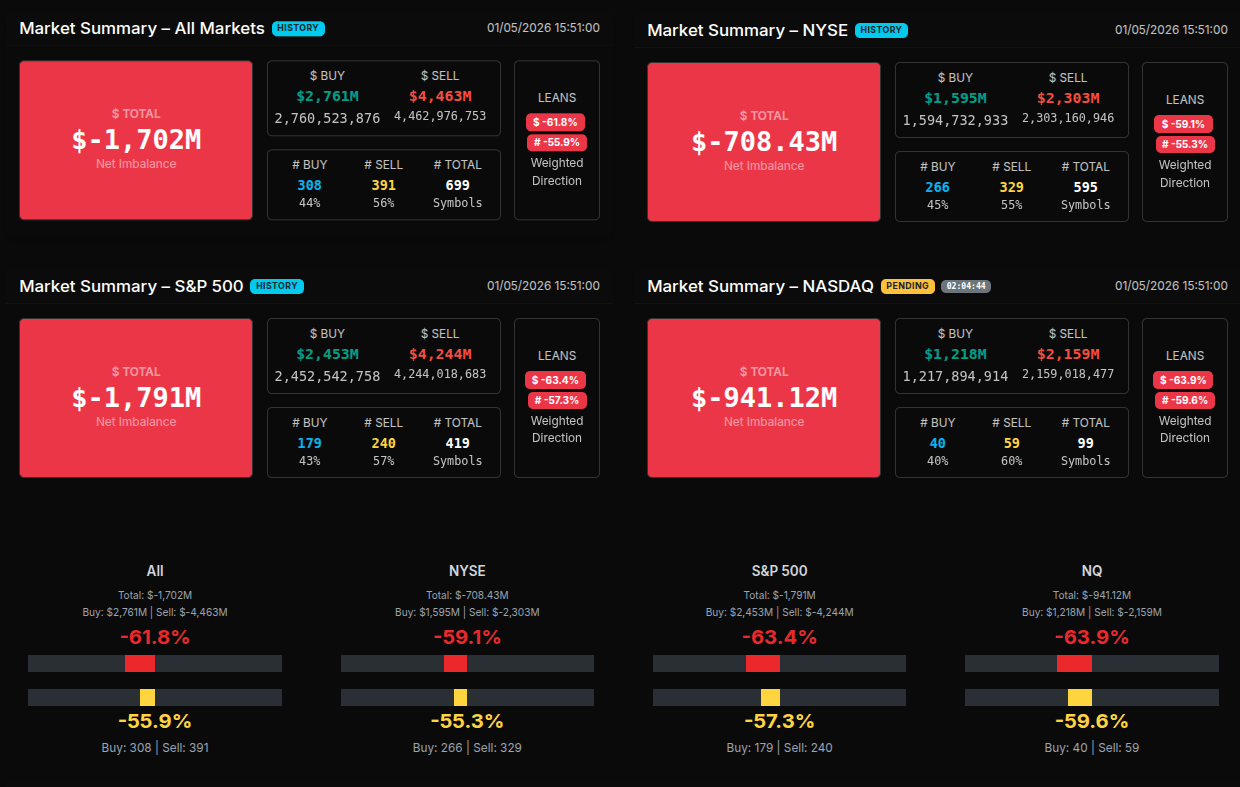
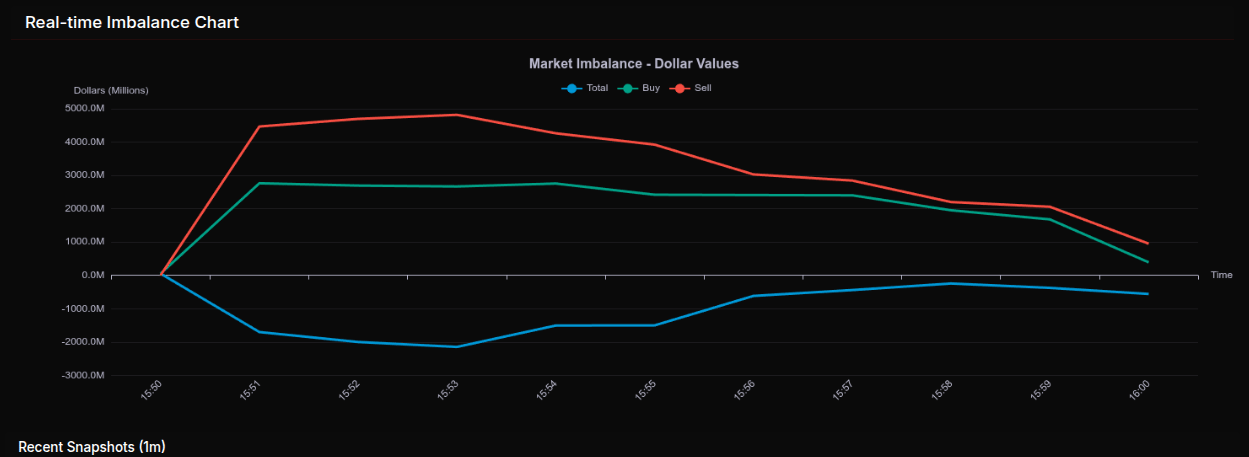
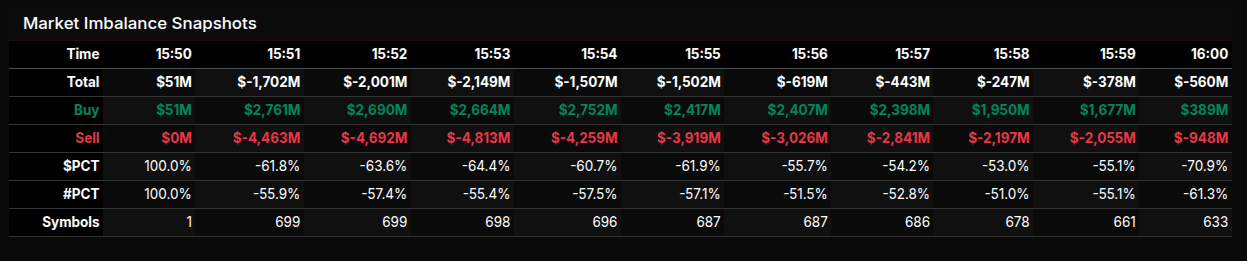
The Market-on-Close auction opened decisively on the sell side and never truly recovered, setting a clear tone for the final ten minutes of trade. Early snapshots showed the imbalance swinging sharply negative almost immediately after 15:50, with sell pressure accelerating into the 15:52–15:54 window as total imbalances pushed beyond $2 billion to the downside. While there were brief attempts at stabilization later in the auction, the session ultimately resolved as a firm sell program into the close.
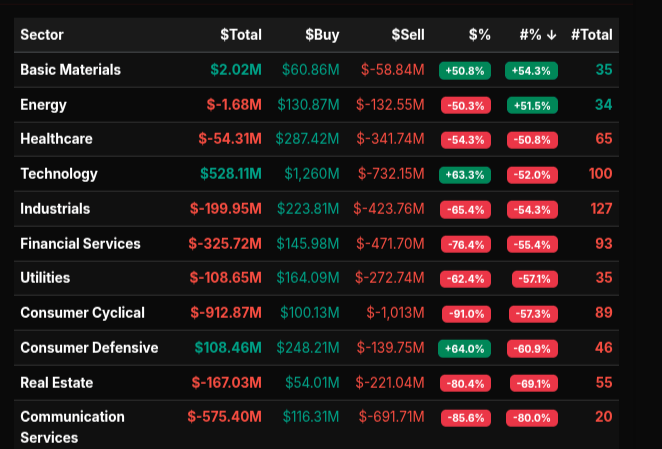
Sector flow confirmed that this was not a narrow or idiosyncratic event, but a broad-based de-risking. Consumer Cyclical was the most notable outlier, posting a -91% lean, a textbook example of wholesale selling rather than rotation. Communication Services (-85.6%), Real Estate (-80.4%), Financial Services (-76.4%), and Industrials (-65.4%) also registered deep negative leans, all well beyond the -66% threshold that signals institutional-size supply. Utilities and Healthcare were similarly pressured, reinforcing the defensive posture of the auction.
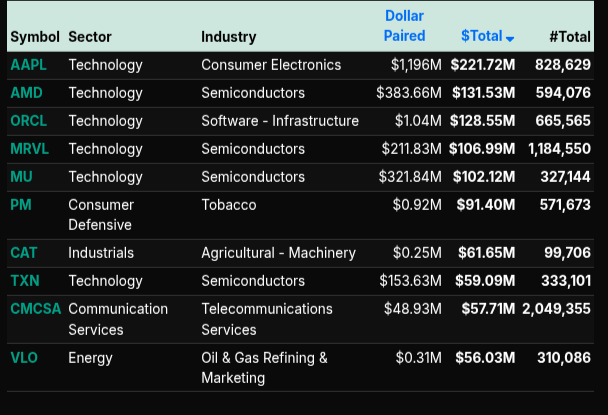
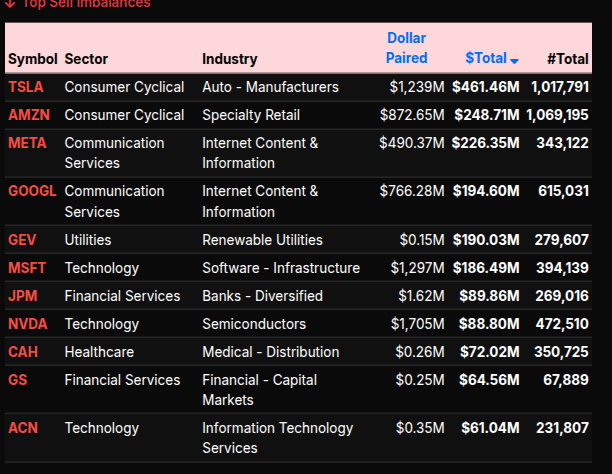
Technology was more nuanced. Despite a positive dollar total at the sector level, its +63.3% lean sat just below the wholesale buy threshold, suggesting selective buying rather than aggressive accumulation. This interpretation was reinforced by the symbol-level data: while large-cap names like AAPL, AMD, NVDA, and MSFT appeared on the buy side, they were overwhelmed by heavy sell imbalances in TSLA, AMZN, META, and GOOGL. The result was a rotational bid within tech rather than a sector-wide risk-on move.
Consumer Defensive stood out as the lone sector with a meaningful positive lean at +64.0%, indicating relative safety-seeking into staples late in the day. Basic Materials also leaned modestly positive, though its smaller totals suggested opportunistic positioning rather than conviction.
By the final print, all major market groupings—NYSE, S&P 500, and Nasdaq—closed with weighted sell leans clustered around -60% to -64%. This consistency underscores that the MOC was driven by systematic selling, not late-day noise, and reinforces the message of distribution into the close rather than end-of-day short covering.
Technical Edge
Fair Values for January 6, 2026:
-
SP: 42.48
-
NQ: 181.49
-
Dow: 246.68
Daily Market Recap 📊
For Monday, January 5, 2026
• NYSE Breadth: 65% Upside Volume
• Nasdaq Breadth: 71% Upside Volume
• Total Breadth: 70% Upside Volume
• NYSE Advance/Decline: 69% Advance
• Nasdaq Advance/Decline: 71% Advance
• Total Advance/Decline: 70% Advance
• NYSE New Highs/New Lows: 207 / 31
• Nasdaq New Highs/New Lows: 299 / 72
• NYSE TRIN: 1.08
• Nasdaq TRIN: 0.96
Weekly Breadth Data 📈
For Week Ending Friday, January 2, 2026
• NYSE Breadth: 47% Upside Volume
• Nasdaq Breadth: 52% Upside Volume
• Total Breadth: 50% Upside Volume
• NYSE Advance/Decline: 43% Advance
• Nasdaq Advance/Decline: 38% Advance
• Total Advance/Decline: 40% Advance
• NYSE New Highs/New Lows: 136 / 86
• Nasdaq New Highs/New Lows: 225 / 521
• NYSE TRIN: 0.84
• Nasdaq TRIN: 0.56
ES & NQ Levels (Premium only)

ES – H26 Levels
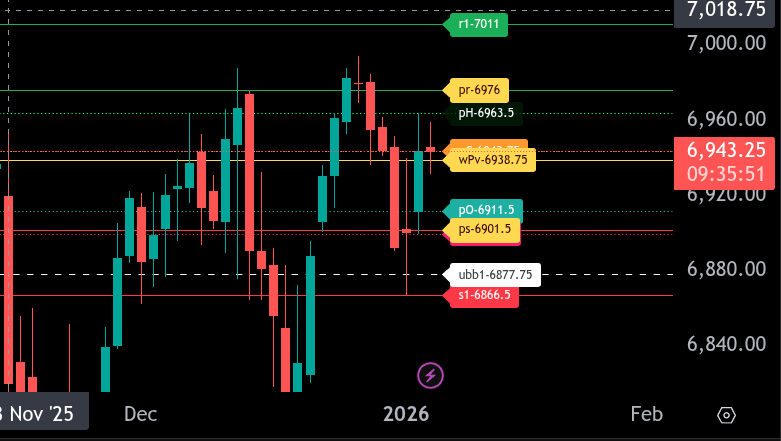
The bull/bear line for the ES is at 6938.75. This is the key pivot for today’s trade. Holding above this level keeps the tone constructive, while acceptance below it shifts control back to sellers.
ES is currently trading near 6943.25 after rejecting higher levels overnight. Failure to sustain above the bull/bear line opens the door to rotation lower toward 6911.50 and then 6901.50, and a clean break below that level exposes 6866.50 as the next downside objective.
On the upside, initial resistance comes in at 6963 and then the upper range target at 6976.00, followed by 7011.00. Buyers need acceptance above 6976.00 to re-engage upside momentum and open the path toward 7011.00.
Overall, ES is range-bound with a bearish tilt below 6938.75. Bulls need a sustained hold above the bull/bear line to regain control, while continued rejection keeps the focus on testing the lower range levels.
NQ – H26 – Levels
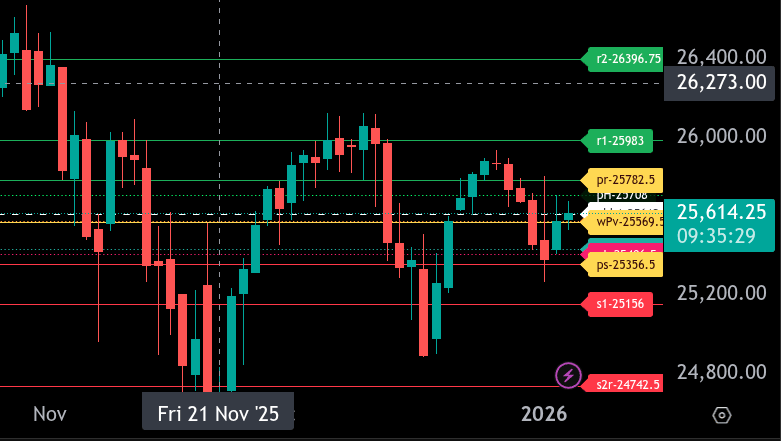
The bull/bear line for the NQ is at 25,569.50. This wPv level is the key pivot for today’s trade. Acceptance above it keeps buyers in control, while failure below it opens the door to renewed downside pressure.
NQ is currently trading near 25,614.50, holding above the bull/bear line. As long as price holds above 25,569.50, look for rotational strength back toward 25,708.00 and then 25,782.50, which is today’s upper range target. A sustained move above 25,782.50 would signal stronger upside continuation and seek out 25,983.
On the downside, initial support sits at 25,612.75 and then 25,577.75. A clean break back below the bull/bear line shifts control to sellers, targeting 25,431.75 and 25,406.50. Below there, the lower range target for the session is 25,356.50, which would be the key downside objective if selling accelerates.
Overall, the NQ remains in a recovery phase as long as it holds above 25,569.50. Failure to hold that level puts the overnight lows and the lower range target back in play.
Calendars
Economic Calendar
Today
Important Upcoming
Earnings
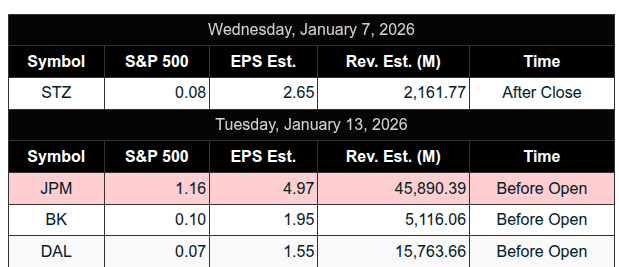
Recent
NONE
Trading Room Summaries
Polaris Trading Group Summary – Monday, January 5, 2026
The PTG trading room kicked off 2026 with strong energy, camaraderie, and a bullish market tone. This was Cycle Day 3, and it played out favorably for the bulls, with all DTS Briefing targets fulfilled and exceeded by mid-morning. It was a textbook start to the year, offering multiple learning and trading opportunities.
Key Highlights & Positive Trade Outcomes:
-
Early Call: PTGDavid identified an early “sandbox” zone at 6935–6945, which acted as the initial consolidation area.
-
Target Tag: By 10:30 AM, the 6953.45 level from the PTG Daily Range Target Calculator was tagged, validating the pre-market range plan.
-
Full DTS Targets Hit: At 10:40 AM, David confirmed “All DTS Briefing targets fulfilled and exceeded”, an important benchmark for traders following the daily strategy.
-
Bullish Control: Price action settled in an acceptance zone between 6945–6955, and bulls were clearly in control through most of the day. David emphasized “The Bulls own the ball” and only needed to “hold serve” after defending VWAP pullbacks.
-
2 PM Shake & Bake: The typical afternoon volatility emerged as expected. David noted bulls needed to C&C (close and confirm) the 6957 handle for further upside. They had already done a “dent job” buying the VWAP pullback.
-
Cycle Day 3 Targets Fulfilled: By 3:17 PM, both ES DLMB Levels and upper penetration targets for CD3 were completed — a strong technical confirmation for those tracking intraday range expansions.
-
End-of-Day Flow: Despite a $1.9B MOC sell imbalance, the market absorbed it well, and price closed within the mid-VWAP zone, suggesting balanced action into the close.
Lessons & Takeaways:
-
Preparation Pays: The precise tagging of Daily Range Calculator levels reinforced the value of pre-market planning using PTG’s tools.
-
Price Structure Matters: The acceptance zone around 6945–6955 served as a solid framework for intraday decisions — an important reminder of identifying and respecting consolidation zones.
-
Cycle Day Awareness: Understanding the implications of Cycle Day 3 helped traders anticipate range extensions and stay aligned with the dominant trend.
-
VWAP as a Pivot: The bullish defense of VWAP pullbacks provided high-probability entries, showing again why VWAP is a core intraday reference for PTG traders.
Discovery Trading Group Room Preview – January 6, 2026
U.S. equities pushed higher yesterday, buoyed by major AI announcements at CES 2026, while gold and silver reflected a more cautious tone amid geopolitical shifts following the U.S.-led capture of Venezuela’s Maduro.
CES 2026 Highlights:
-
Nvidia unveiled the Vera Rubin superchip and NVL72 AI server, aimed at powering agentic AI and MoE systems. Rubin is 4x more efficient than Blackwell and targets hyperscalers like Microsoft and Google. Nvidia also teased plans for humanoid robots and self-driving tech.
-
AMD launched its Helios AI rack and MI500 chips, claiming a massive 1,000x performance leap over MI300x. CEO Lisa Su forecasted 5 billion AI users in five years.
-
Hyundai revealed a plan to mass-produce 30,000 robots annually by 2028, using Boston Dynamics’ Atlas in its plants, backed by Mobis and Glovis for an integrated robotics supply chain.
Market & Economic Notes:
-
No key earnings today.
-
Watch for S&P Global Services PMI at 9:45am ET and comments from Richmond Fed’s Barkin at 8:00am ET.
-
Volatility is ticking up as volumes normalize. Expect faster downside expansion near all-time highs, while upside may see contracting vol.
-
Overnight whale positioning turned bullish after yesterday’s selling.
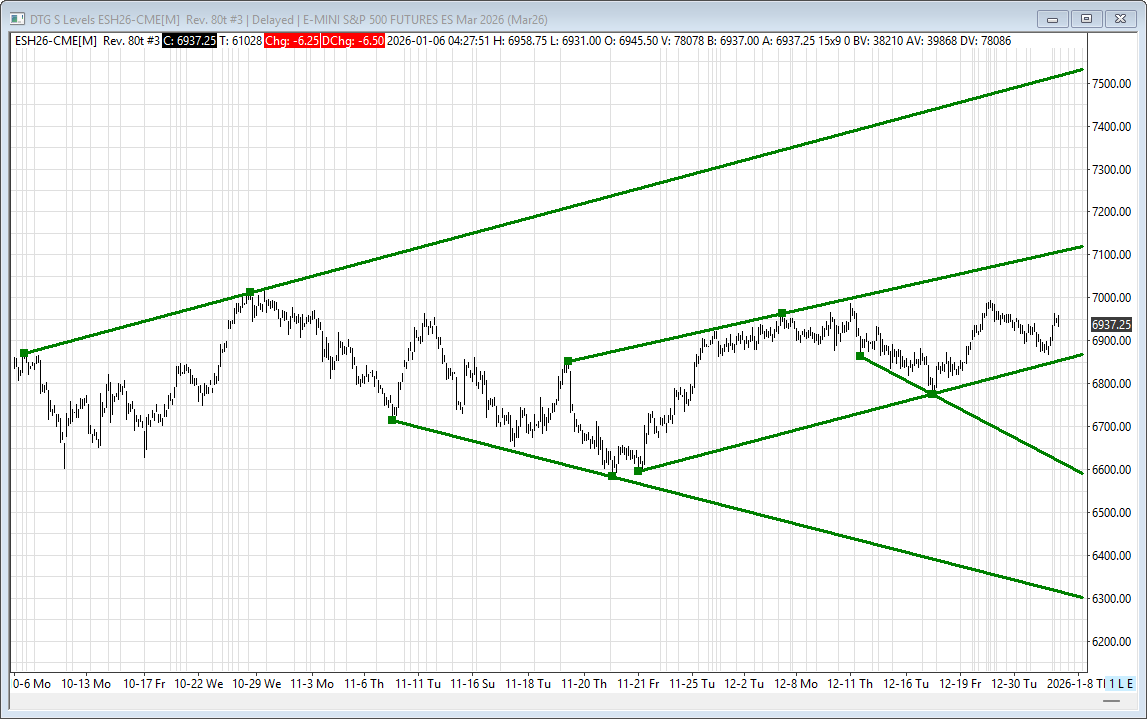
ES Technicals:
-
Trendline support: 6861/66s, 6593/88s, 6300/95s
-
Resistance: 7115/20s, 7542/47s
-
50-day MA: 6883.52 acting as loose support
-
5-day ADR: 53.50 points
Affiliate Disclosure: This newsletter may contain affiliate links, which means we may earn a commission if you click through and make a purchase. This comes at no additional cost to you and helps us continue providing valuable content. We only recommend products or services we genuinely believe in. Thank you for your support!
Disclaimer: Charts and analysis are for discussion and education purposes only. I am not a financial advisor, do not give financial advice and am not recommending the buying or selling of any security.
Remember: Not all setups will trigger. Not all setups will be profitable. Not all setups should be taken. These are simply the setups that I have put together for years on my own and what I watch as part of my own “game plan” coming into each day. Good luck!
This post goes out as an email to our subscribers every day and is posted for free here around 2 PM ET. To get your real-time copy, sign up for the free or premium version here: Opening Print Subscribe.
Comments are closed