This post goes out as an email to our subscribers every day and is posted for free here around 2 PM ET. To get your real-time copy, sign up for the free or premium version here: Opening Print Subscribe.
FRYday Shorts Could Get Cooked Above 6804
Follow @MrTopStep on Twitter and please share if you find our work valuable!
Our View
The ES traded up to 6812.50 on Globex, then opened the 9:30 ET futures session at 6802.75. After the open, it climbed to 6809.50 before making a series of lower highs, eventually dropping to 6778.50 at 10:42. It bounced up to 6788.00 at 11:15, then sold off again to a higher low at 6769.00. The market rallied to another lower high at 6785.25, then sold off to a new low at 6760.75 at 1:30.
After that, it back-and-filled and rallied up to 6782 as the NQ started going bid and rallied up. ES then sold off to 6760.75 and fell into a 10-point chop while the NQ bounced.
Following the pullback, the ES stutter-stepped up to the 6779.50 level at the the 3:50 cash imbalance which showed $5.3 billion to buy. It then traded 6781.75, pulled back slightly, and traded 6781.25 on the 4:00 cash close, settling at 6779.75 — down 21.50 points or -0.32%, and -0.33% on the 5:00 futures close.
In the end, can you say “up a day, down a day?” I can.
Date
Last Price
Change
% Change
10/09/2025
6,779.25
-22.00
-0.32%
10/08/2025
6,801.25
+39.75
+0.59%
10/07/2025
6,761.50
-27.25
-0.40%
10/06/2025
6,788.75
+24.75
+0.37%
10/03/2025
6,764.00
-2.75
-0.04%
10/02/2025
6,766.75
+5.25
+0.08%
I’ve seen this many times, and it generally is a bullish pattern.
In terms of overall tone, both the ES and NQ were weak — but this time, the weakness came from the ES. As for the ES’s overall trade, Wednesday’s total volume was low at 1.048 million contracts, while Thursday’s volume was higher at 1.317 million.
On Tap
-
9:45 am – Chicago Fed President Austan Goolsbee: Opening remarks
-
10:00 am – Consumer Sentiment (Prelim, Oct): 53.5 vs. 60.4
-
2:00 pm – Monthly U.S. Federal Budget* (Sept)
Our View
Have you noticed how the Globex trading ranges and volume have shrunk? The ES tends to trade down and then short-cover before the regular session opens. This morning’s range is only 20.50 points — a far cry from earlier in the year, when the ES was seeing 100+ point ranges and 500K minis traded. Maybe that will change when third-quarter earnings season kicks off on Wall Street next week.
Since 10/02, the lowest the ES has traded is 6741.50 and the highest is 6812.25 — a 70.75-point range over six sessions. Clearly, the government shutdown has lowered volatility.
I don’t know if yesterday’s low will hold, but it was PitBull Thursday’s low before today’s Week Two Friday options expiration. The notional value of options expiring today is approximately $1.2 trillion. That seems high, but we could see a small pickup in trade.
Our Lean
I understand the markets are way up, and the government shutdown isn’t good — but the ES and NQ don’t seem like they’re going down. In fact, the narrow range looks like a big back-and-fill pattern.
On the flip side, the ES is having a hard time holding above the big figure at 6800.00.
Our lean: If you’re a trend follower, I’d say just buy the pullbacks. But selling the gap-ups or early strength has been working well. I just have a feeling today could be different.
My guess is that all the little selloffs over the last six sessions have added shorts. Maybe I’m wrong, but today is FRYday — and if the ES starts holding above 6804, I could see it trading up to the 6820 level, and if that holds, 6834.
If I’m wrong, we should know early.

We’ve never offered a deal like this before, and it includes all our tools, including the Imbalance Meter.
Guest Posts:
Tom Incorvia: BlueTreeLLC.com
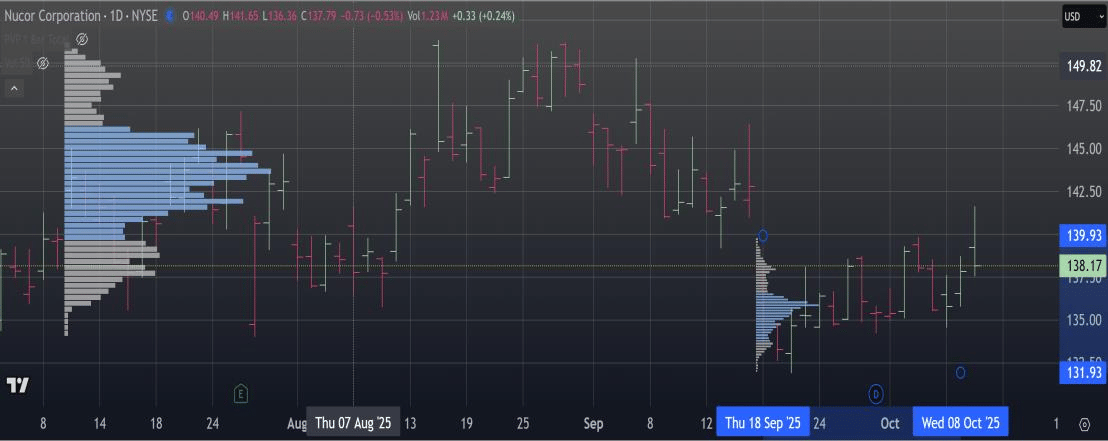
Nucor Corporation (Daily)
There are two balance areas. The balance area to the right illustrates that prices have broken below the previous Value Area
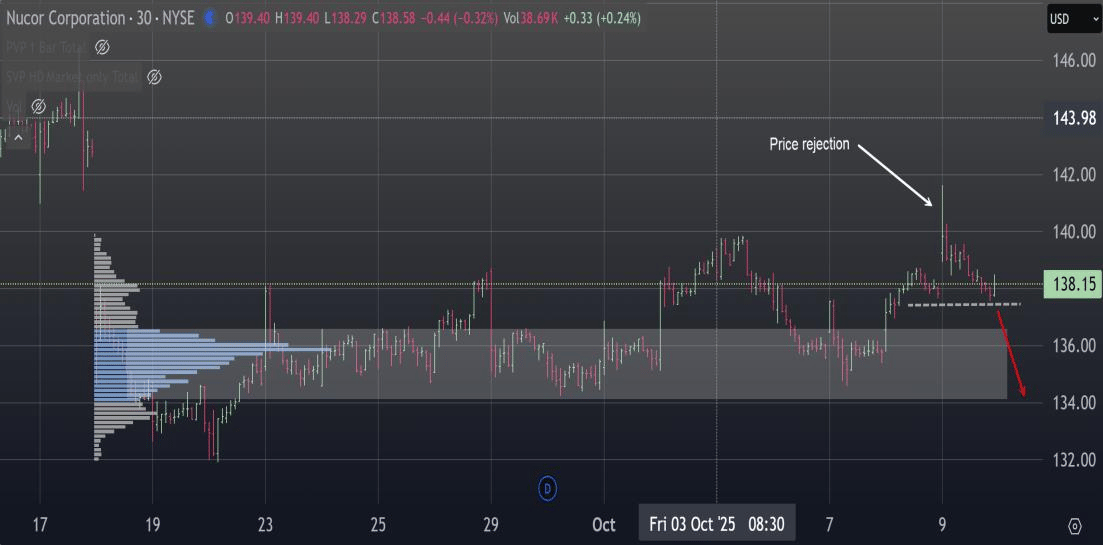
Nucor Corporation (30 min)
Today’s price rejection is an indication of continued price weakness. If prices break below the 137.50 area may be a sign that prices test the opposite value area (134 area)
About Strategy:
Strategy As a disciple of Market Profile, I base my trading philosophy on the principles of Volume Price Analysis. Building on Pete Steidlmayer’s groundbreaking work, I’ve expanded the core concepts of Market Profile to apply effectively to swing trading equities. Steidlmayer discovered that when time is removed from the chart, markets naturally organize into distributions that clearly reveal areas of supply and demand. I use this framework to identify and execute historically asymmetrical trades — opportunities where the potential reward significantly outweighs the risk. This approach allows me to align with the market’s true intent and structure trades within the context of evolving value.
About Tom Incorvia:
With over 35 years in the markets, Tom has traded from both the buy and sell sides of the industry—starting as a retail broker, progressing to hedge fund manager, and now working as an independent swing trader. He specializes in Volume Price Analysis and Market/Volume Profile, techniques he’s studied and refined since learning directly from Market Profile founder Pete Steidlmayer in 1989. His proprietary swing trading approach merges profiles to reveal the true intent of price action, maintaining the natural distribution principles that define Market Profile.
Learn More: https://bluetreellc.com/

Get instant access to our partners’ real-time market data and insights not available anywhere else. Here is last night’s Founder’s note getting you ready for today’s market and explaining the constraints in yesterday’s market. – MrTopStep
Founder’s Note:
Key dates ahead:
-
10/9: Jobless Claims, Powell Speaking
-
10/10: NFP
10/7 Risk Alert: COR1M crossed <8, which is our trigger to add on >=end of October downside hedges. This means we will look to add a tranche of puts, put spreads and possibly risk reversals. Should SPX cross our risk-off level (<6,700) we will be more aggressively adding downside plays. This risk flag triggers with SPX 1-month RV at bottom-basement levels of 5% – and indicator SPX realized vols may move higher in the into/round OPEX.
10/2: We raise our key risk off level to 6,680 (from 6,600). We prefer remaining long of stocks while above that level, with an short term upside target of 6,750-6,765. If 6,680 breaks, we would look for a test of 6,600. Of note: Single stock skews are getting objectively rich, and the CBOE COR1M at ~9 is also flagging this excess bullishness. Should that metric get sub 8 we will be sharply reducing upside exposure.
Key SG levels for the SPX are:
-
Resistance: 6,770
-
Pivot: 6,700 (bearish <, bullish >)
-
Support: 6,750, 6,720, 6,700
Opt-in to receive FlowPatrol™ — our daily AM report detailing the most significant options trades and their impact on the stock market
Stay informed of how options flow evolves each day: Opt in to receive FlowPatrol daily
PM Note:
As remarked in our AM Note, futures were flat throughout most of the extended trading hours. However, it took mere minutes for the RTH session to expand that range lower with a strong push towards the put spread of the 20k lot Iron Condor.
We’ve seen some discussion regarding the IC and “Captain Condor” within our Discord, and we want to expand on why we feel this is important to discuss.
As visible in TRACE today, we can see exactly what we should have expected coming into today. Interacting with either spread of the condor should dramatically suppress realized volatility in local price action, as was the case with the 6,720/6,715 put spread.
This is something JT has also discussed at length within the Sharpen Your Skills sessions over the summer, especially those revolving around TRACE and the Synthetic OI model.
Remember: When you hear gamma, you should immediately think in terms of ‘realized volatility’
We view this as a critical theme you should latch onto for understanding options dynamics, and if you don’t understand it quite yet, jump into our Discord server and ping users like JT (defnotjec) to start the conversation!
The suppression of price action to a 10-handle range for multiple hours is directly related to two main elements: (1) local gamma, and (2) lack of sufficient participant volume.
The overall size of the position requires dealers to hedge considerably as price nears the put spread, meaning the volume would have to be quite sizable to break through. Then, as time passes we expect this positive gamma to have a measurable charm influence that further insulates the position.
We would normally expect price to oscillate near the 6,720 level into the close given the strong positive gamma at that strike, unless we saw a save by the MOC or a sudden bullish change in behavior. Today, we saw exactly the latter after price danced around the 6,720 level through the afternoon. Given the condor won today, we could see RV expand meaningfully in either direction with the market lacking the Captain’s suppressive influence tomorrow.
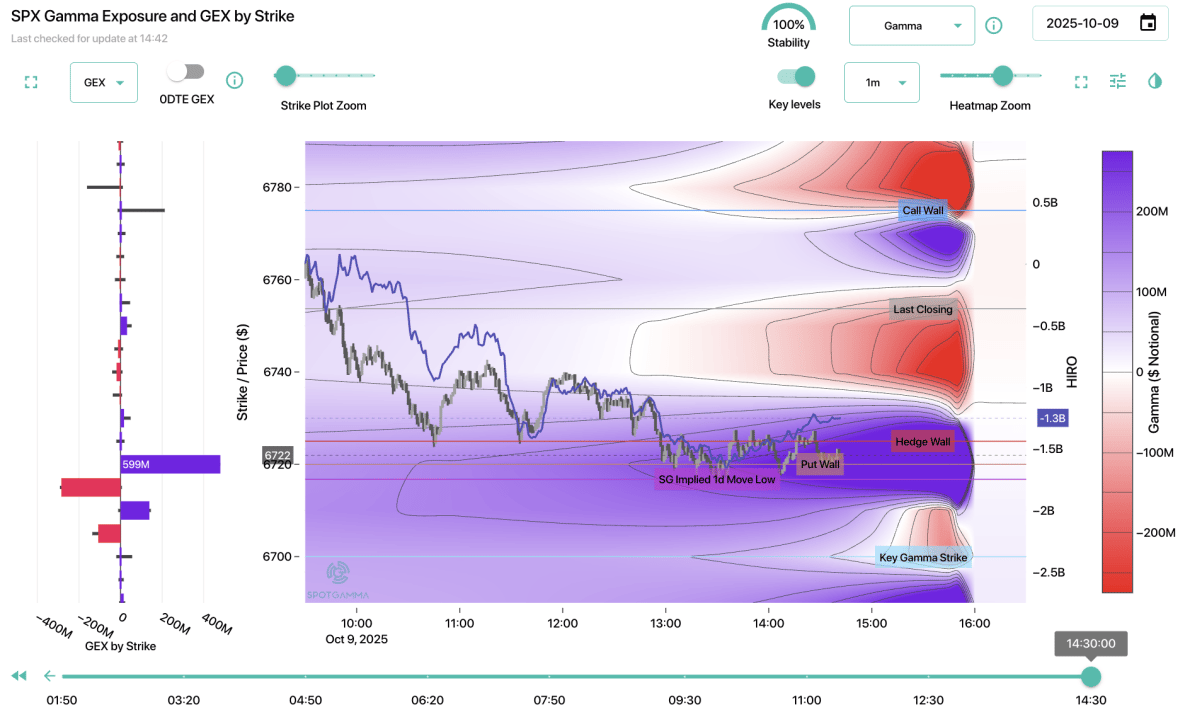
In terms of general trader behavior, participation weighed heavily to the downside for the S&P 500, starting from the open as seen in HIRO:
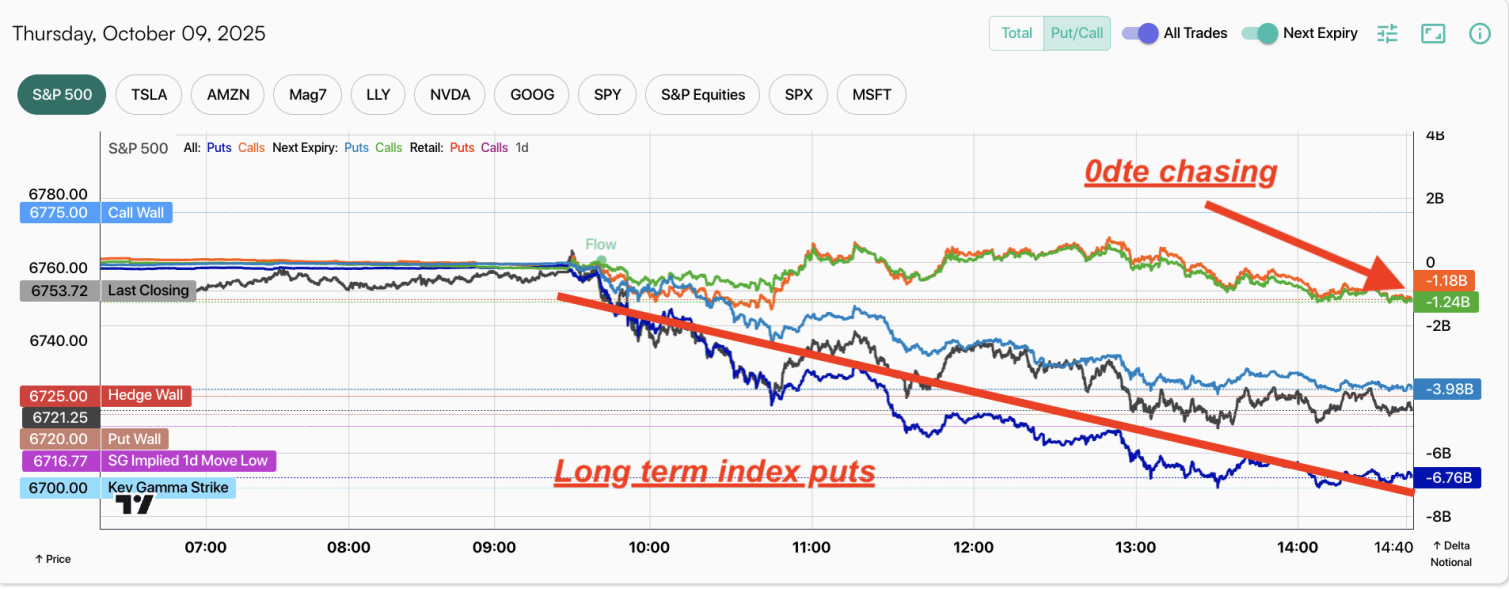
The early dip buying did pick up early at that 10-11 ET timeframe, but wasn’t strong enough to buoy the market and we saw traders still short delta and leaning with the current price action.
Interestingly, VIX began to catch a bid today, briefly breaking above 17 early this morning before eventually retreating back and holding ~16.5 into the close.
OPEX remains our main focus into next week, even more so than normal given the lack of economic data prints. It’s important to remember that when gamma does shift, large realization of volatility can occur quickly.
Today’s AM note also mentioned this very perspective based on the CO1M look. There’s a lot of risk appetite in the market, yet there are also growing signs that taking chips off the table might be a good idea.©2025 TenTen Capital LLC DBA SpotGamma
Get instant access to our partners real-time market data and insights not available anywhere else. Here is last night Founder’s note getting you ready for today’s market and explaining the constraints in yesterday’s market. – MrTopStep
MiM and Daily Recap
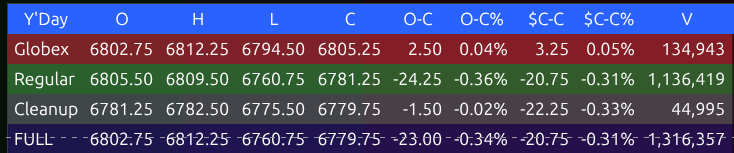
The S&P 500 futures (ES) traded in a narrow and choppy range on Thursday, consolidating recent gains in what looked like a classic back-and-fill session. The Globex session began quietly, opening at 6802.75 and rising to 6812.25 by 19:25 before rolling over into a steady decline. Sellers pressed the ES down to 6794.50 by 22:50, a 17.75-point drop from the high. A modest rebound carried prices back to 6800.50 by 23:10, followed by a retest of 6795.00 and then a lift to 6807.50 at 02:10. Another wave of selling followed, sending the contract to 6795.50 by 05:00 before buyers reemerged, taking the ES back up toward 6805.25 into the 9:30 ET open. Overall, Globex settled up 2.5 points (+0.04%) from its session open, closing at 6805.25 on moderate overnight volume of 134,943 contracts.
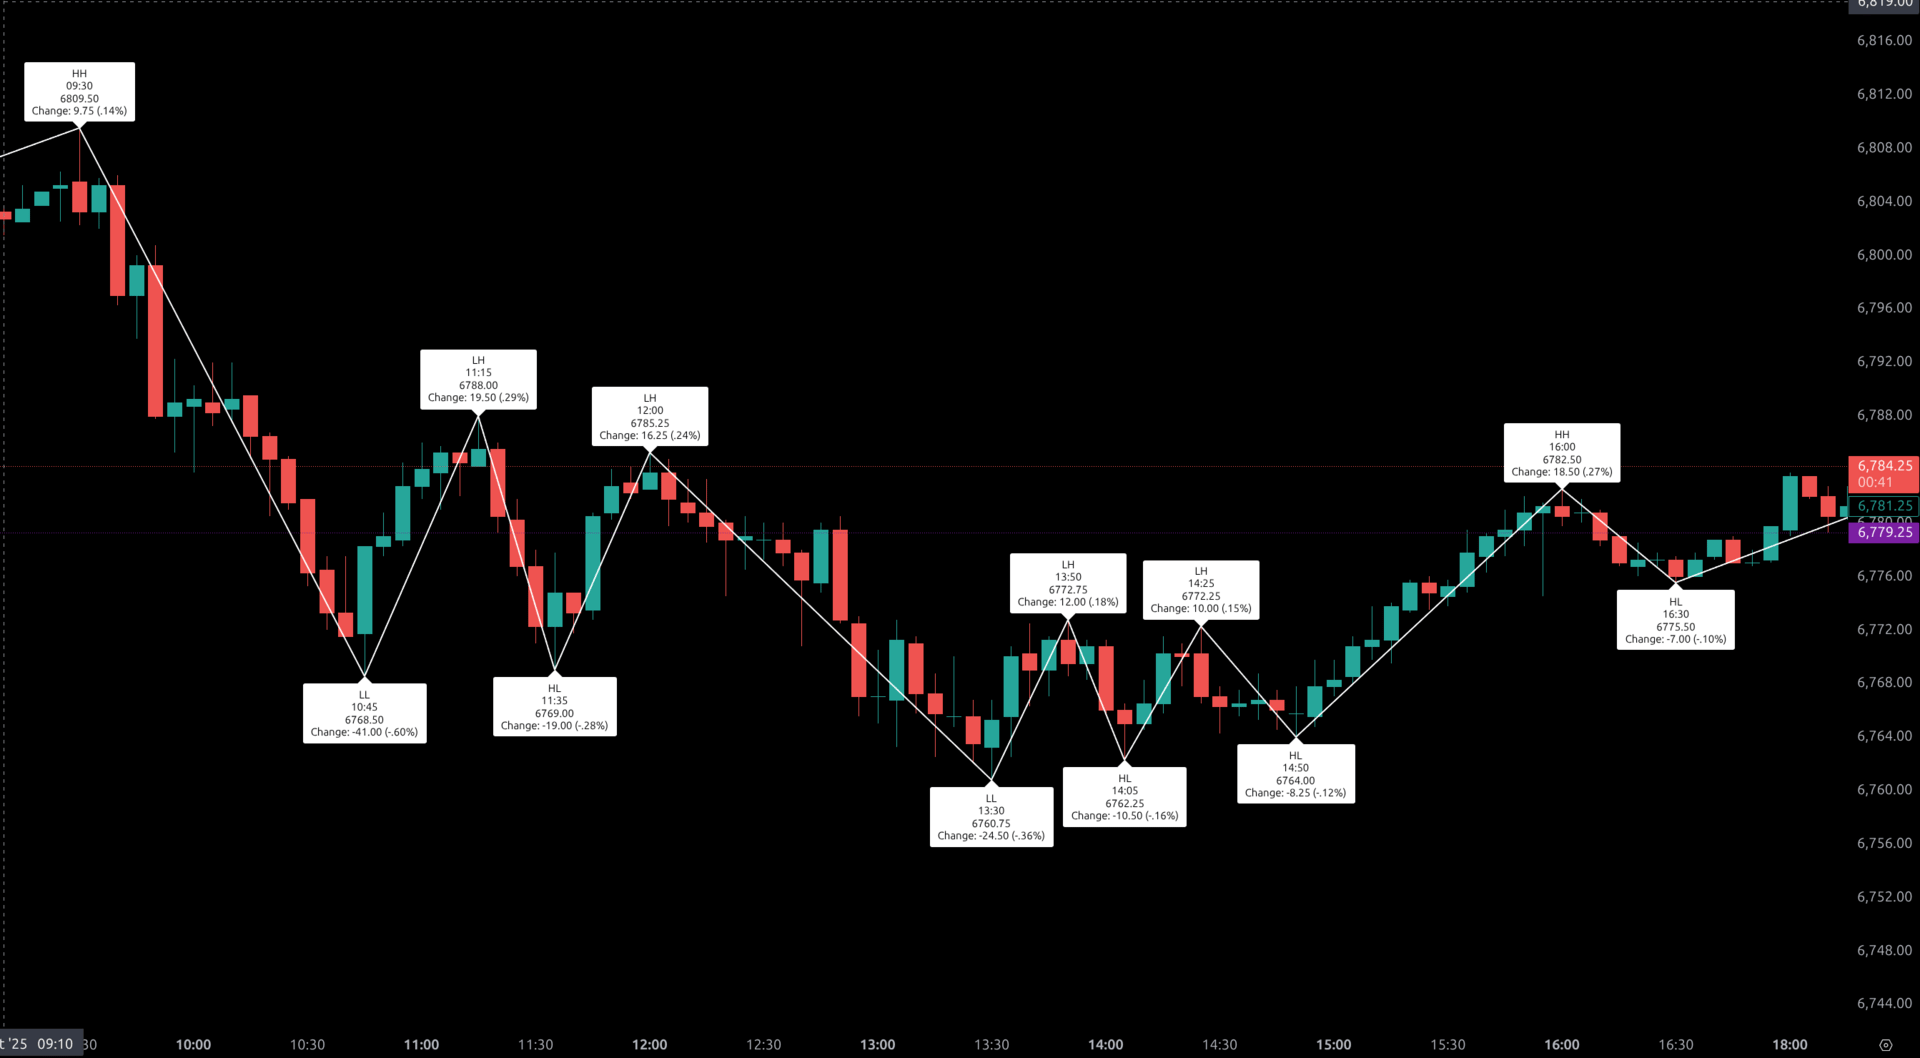
The regular session opened at 6805.50 and immediately saw early weakness. The ES printed its session high at 6809.50 at 9:30 before turning lower. A fast drop hit 6768.50 at 10:45, down 41.0 points (-0.60%) from the high. A midday recovery pushed the ES up to 6788.00 at 11:15, but the bounce stalled below the morning highs. The index faded again, reaching 6760.75 by 13:30. A slow grind higher followed, with the ES climbing back toward 6782.50 by the 4:00 cash close and finishing the regular session at 6781.25, down 24.25 points (-0.36%) from the open and -20.75 points (-0.31%) from the prior day’s close. Volume was decent at 1,136,419 contracts.
In the 4:00–5:00 cleanup session, the ES traded narrowly between 6775.50 and 6782.50, closing at 6779.75, down 1.50 points (-0.02%) from the session open. Total full-session volume reached 1.32 million contracts. The combined day left the ES lower by 23.00 points (-0.34%) from Wednesday’s settlement.
Market Tone & Notable Factors
Thursday’s tone leaned mildly bearish but with clear two-way trade. Buyers repeatedly stepped in near the 6760–6770 support area, suggesting a short-term base, while sellers faded every rally near the 6800–6810 resistance. The price action resembled accumulation rather than aggressive liquidation, with volume balanced between upticks and downticks throughout the day.
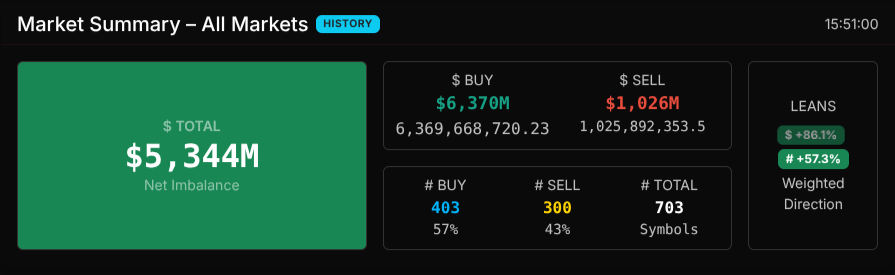
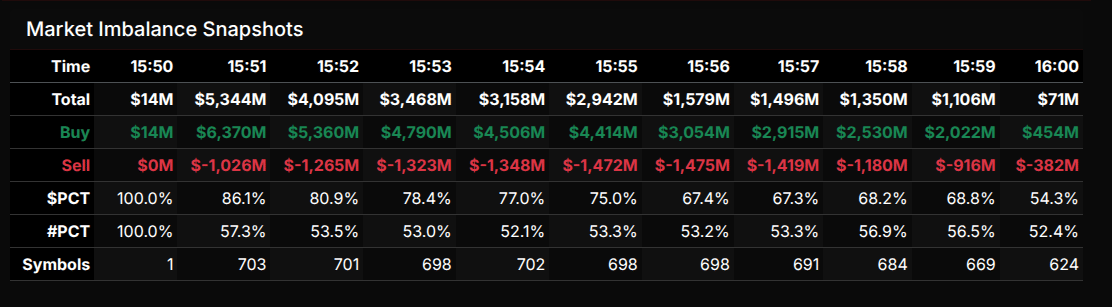
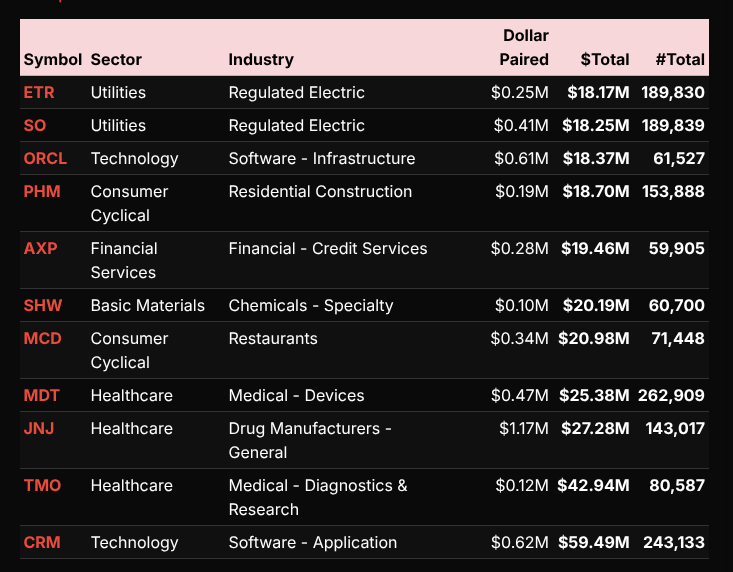
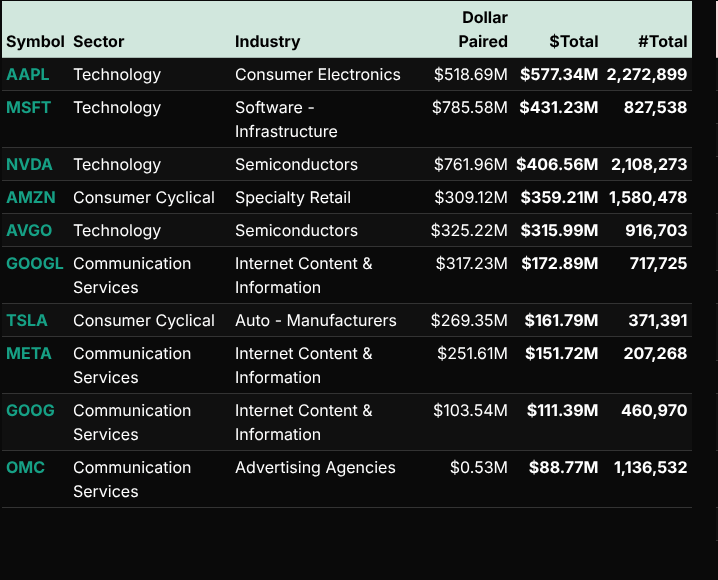
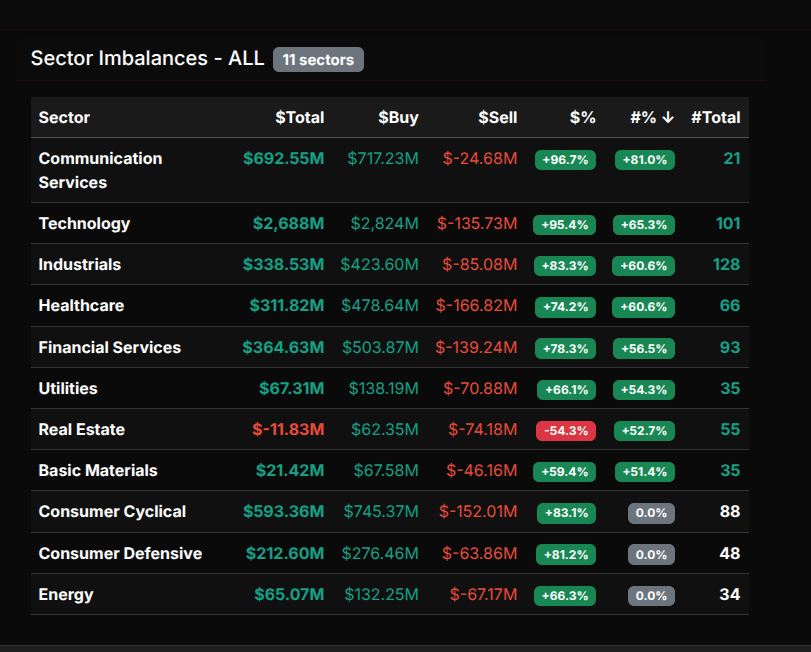
Market-on-Close (MOC) data revealed a strong buy imbalance of $5.34 billion at 3:51 PM, with 403 symbols to buy versus 300 to sell—an 86% buy-lean by value and 57% by count. Technology and Communication Services led the buying, with sector imbalances of $2.68B and $692M respectively, while Real Estate showed slight net selling (-$11.8M). Major contributors on the buy side included AAPL ($577M), NVDA ($406M), and MSFT ($431M). Healthcare names such as TMO and JNJ also saw notable buy programs late in the day.
Despite the heavy buy imbalance, prices failed to mount a strong late rally, reflecting exhaustion near the 6800 handle. The 15:50 imbalance peak faded steadily into the close, signaling institutions may have been pairing off orders rather than initiating new longs. Overall sentiment remains neutral to mildly constructive: the ES continues to hold its upper range, with 6760 acting as short-term support and 6820–6830 as overhead resistance heading into Friday’s session.
ES Levels
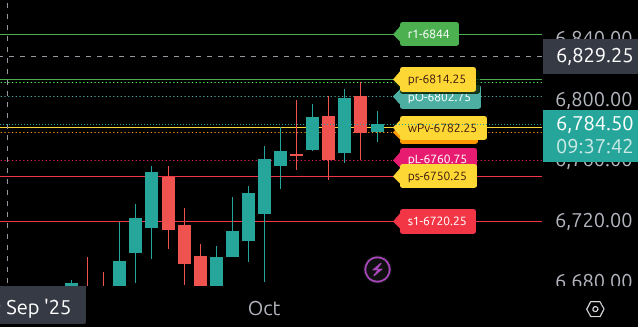
The bull/bear line for the ES is at 6782.25. This level marks the pivot point that determines today’s directional bias. Staying above this line suggests bullish momentum, while sustained action below it indicates weakness.
Currently, ES is trading around 6784.50, slightly above the bull/bear line, showing an early attempt to regain upward traction. If the ES can maintain trade above 6782.25, the first upside resistance is 6802.75, followed by 6814.25, which is the upper range target. Continued strength above this could open the door to test 6844.00 and potentially reach toward the 6846.75 high.
If sellers step in and the ES moves back below 6782.25, initial support sits at 6779.25, followed by 6760.75. A break below there could trigger a deeper pullback toward 6750.25, the lower range target. Further weakness could extend the move to 6720.25.
In summary, above 6782.25, the bias remains constructive, with upside targets at 6802.75 and 6814.25. Losing 6782.25 shifts the short-term tone bearish, with 6750.25 and 6720.25 as key downside objectives. The overall range for the session is framed between 6750.25 and 6814.25.
NQ Levels
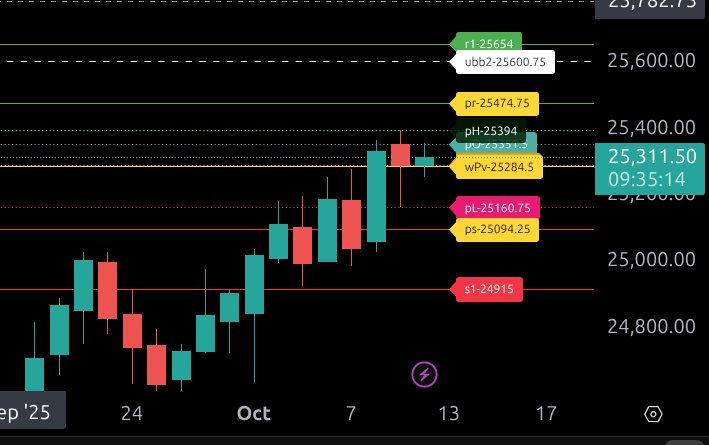
The bull/bear line for the NQ is at 25,284.50. This is the key level that separates bullish from bearish sentiment today. Trading above it favors buying dips, while sustained action below it keeps pressure on the downside.
Currently, NQ is trading around 25,311.25, holding just above the bull/bear line. If it can maintain strength above 25,284.50, the next upside objective is 25,394, followed by the upper range target at 25,474.75. Beyond that, the upper boundary of resistance sits near 25,600.75, where sellers may look to fade strength.
On the downside, a move back below 25,284.50 opens the door to 25,160.75 and then to the lower range target at 25,094.25. A break and close under 25,094.25 would increase the risk of a deeper pullback toward 24,915.
In summary, above 25,284.50, the tone remains constructive with room to test 25,474.75 and 25,600.75. Below 25,284.50, momentum shifts negative, exposing 25,160.75 and 25,094.25 as potential downside magnets.
Technical Edge
Fair Values for October 10, 2025
-
SP: 44.66
-
NQ: 190.49
-
Dow: 239.55
Daily Breadth Data 📊
For Thursday, October 9, 2025
• NYSE Breadth: 31% Upside Volume
• Nasdaq Breadth: 59% Upside Volume
• Total Breadth: 57% Upside Volume
• NYSE Advance/Decline: 25% Advance
• Nasdaq Advance/Decline: 37% Advance
• Total Advance/Decline: 32% Advance
• NYSE New Highs/New Lows: 124 / 57
• Nasdaq New Highs/New Lows: 303 / 80
• NYSE TRIN: 0.63
• Nasdaq TRIN: 0.39
Weekly Breadth Data 📈
Week Ending Friday, October 3, 2025
• NYSE Breadth: 55% Upside Volume
• Nasdaq Breadth: 63% Upside Volume
• Total Breadth: 60% Upside Volume
• NYSE Advance/Decline: 56% Advance
• Nasdaq Advance/Decline: 60% Advance
• Total Advance/Decline: 59% Advance
• NYSE New Highs/New Lows: 315 / 91
• Nasdaq New Highs/New Lows: 748 / 238
• NYSE TRIN: 0.99
• Nasdaq TRIN: 0.88
Calendars
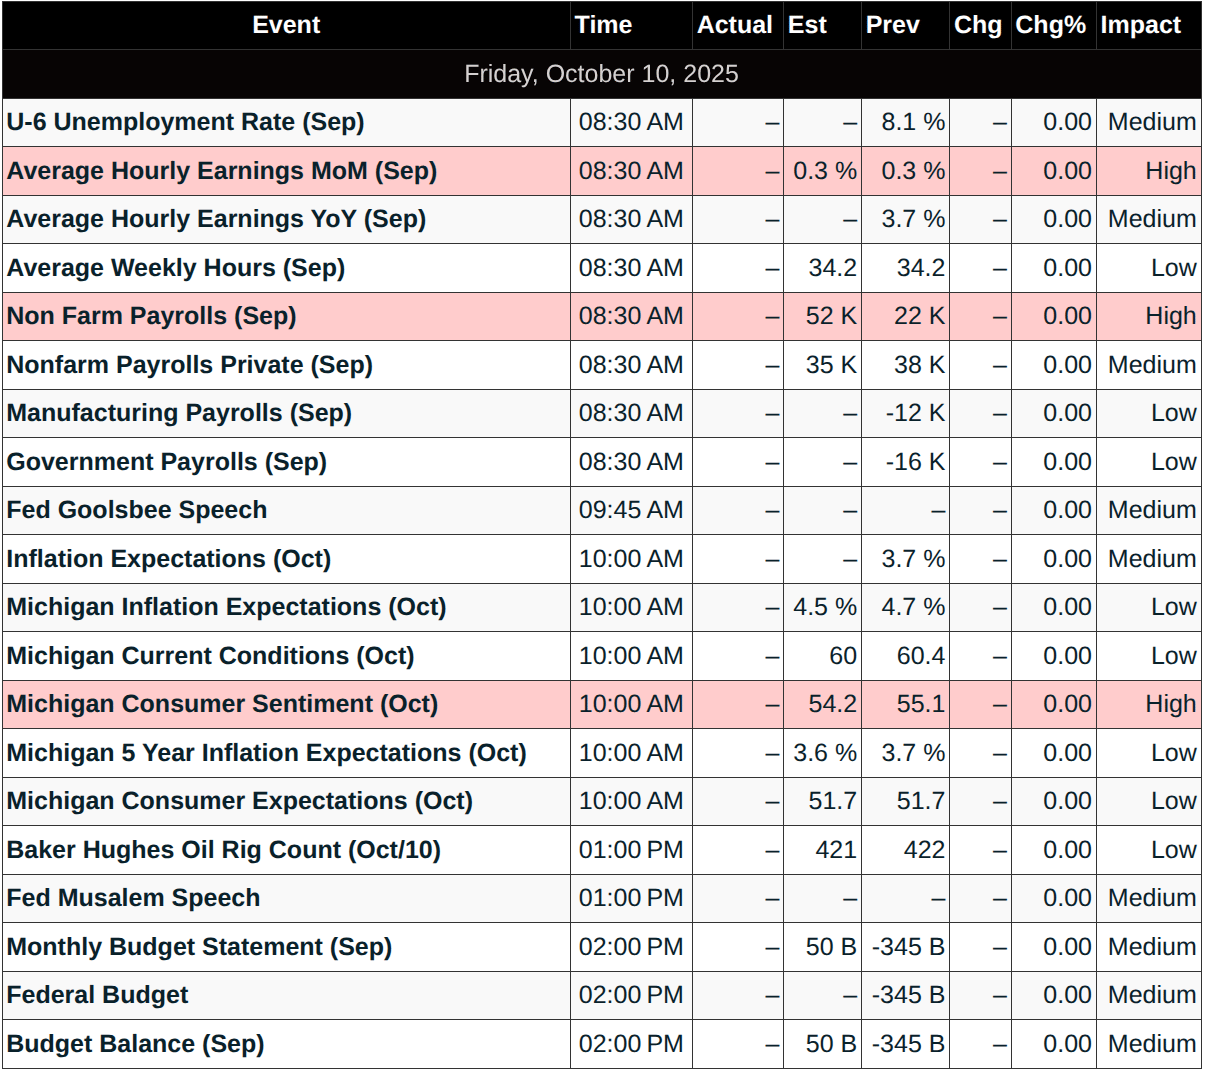
Economic Calendar Today
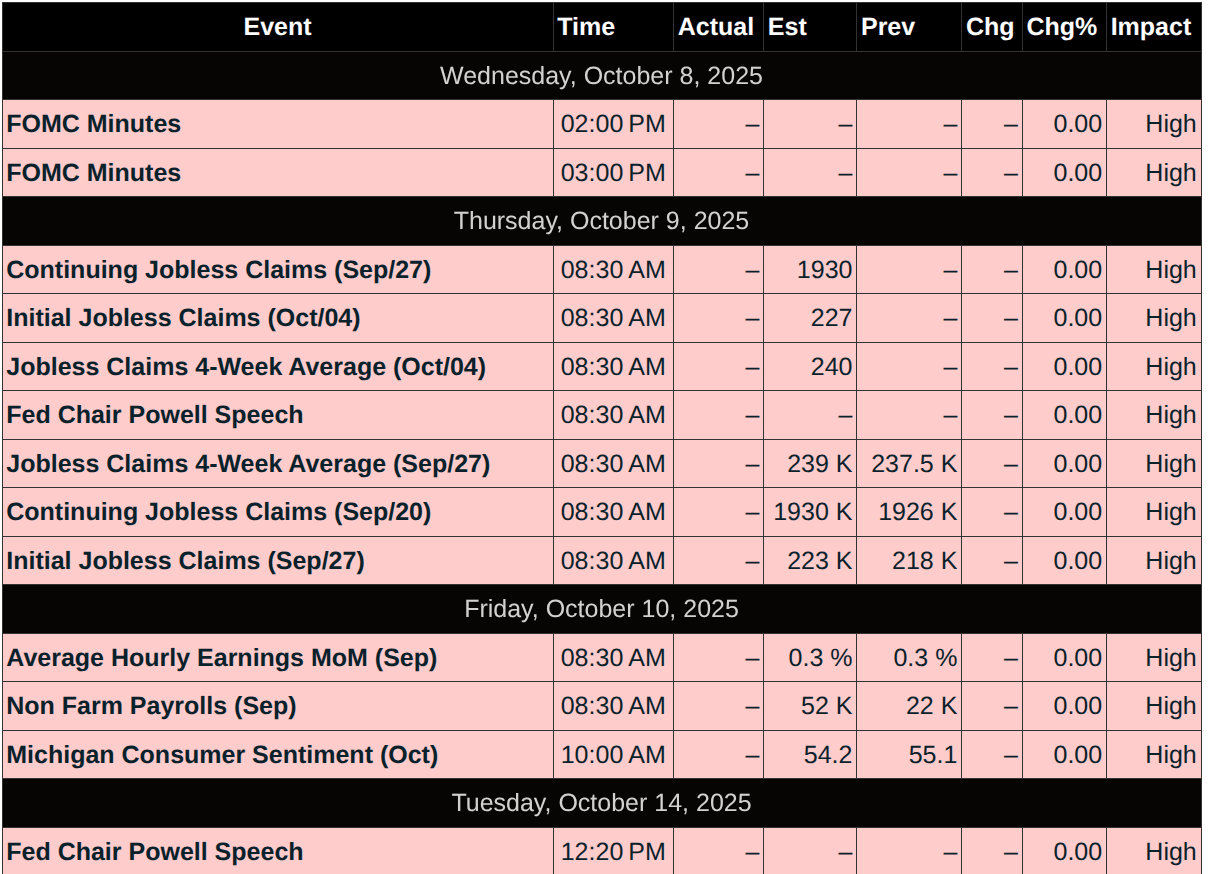
This Week’s High Importance
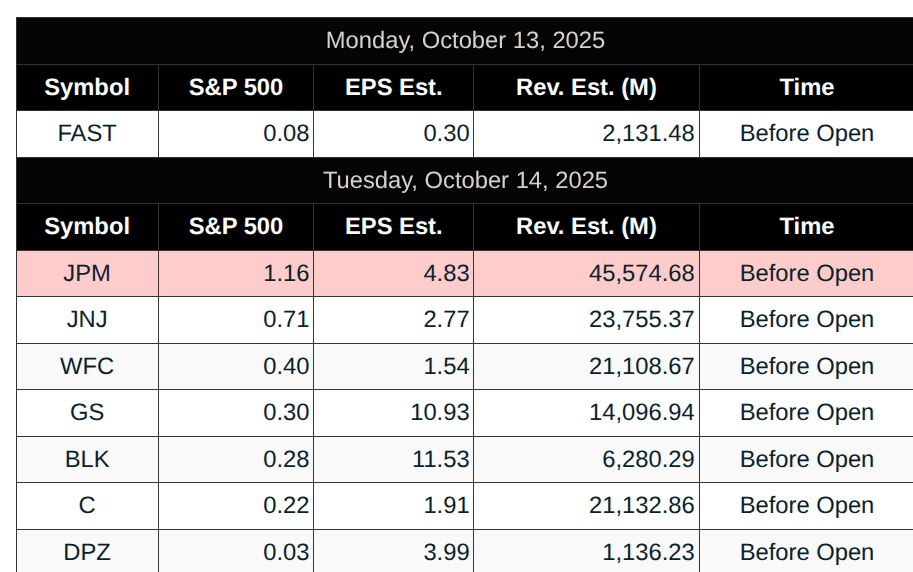
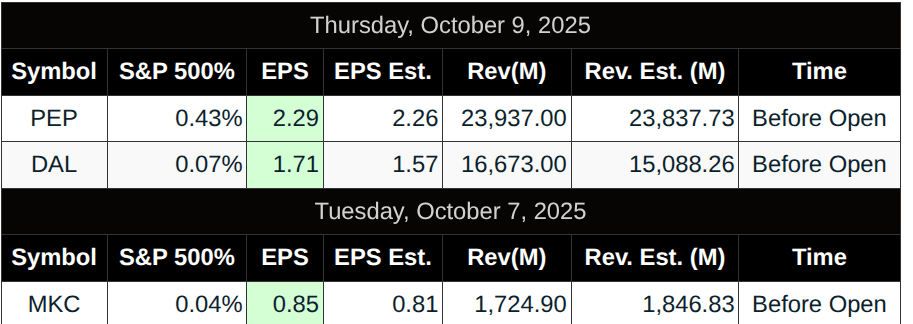
Earnings:
Trading Room News:
Polaris Trading Group Summary – Thursday, October 9, 2025
Thursday was a textbook “Liquidation Day” in the PTG room, led by PTGDavid and supported with in-depth trade planning and clock guidance by Manny. The session was highly educational, with well-executed trades and lessons centered around discipline, cycle theory, and risk control.
Pre-Market Setup
-
David posted the daily strategy and important trading links early.
-
Manny outlined a detailed trade plan with specific support buy triggers (ES 6796.5, 6776.5) and continuation levels (ES 6810/6821.5) along with LB&F setups.
-
Emphasis was on tight risk control and clock pivots:
-
High: 10:00–10:55 (center 10:30)
-
Low: 11:00–12:15 (center 11:45)
-
Afternoon high: 2:00–2:55
-
Active Session Highlights
-
Early short-side bias established by PTGDavid after identifying a PKB bear shift and confirming seller strength.
-
Break of 6785–90 zone opened downside floodgates. David noted bulls needed to reclaim 6792 to regain footing.
-
Manny was cautious early, opting not to force trades, stating he avoids setups before the first clock pivot at 10:00 due to past overtrading mistakes — a key trading lesson in patience and discipline.
-
Cycle Day 3 projection of 6768.50 was fulfilled, confirming David’s downside target. This validated the importance of cycle-based levels.
-
No meaningful long setups developed despite brief bounces — a clear “sell the rip” environment.
Key Trades Called
-
ES and NQ Open Range Shorts were highlighted by David late in the day:
-
“All targets fulfilled” for both ES and NQ shorts — a major win for those following the plan.
-
Images shared confirmed execution and price structure breakdowns.
-
Market Internals & Flow
-
MOC Buy Imbalance of $5.3 Billion was reported near close, leading David to remark:
“Big Boyz are certainly Buying the Effing Dip” — indicating strong institutional interest post-liquidation. -
Despite intraday weakness, no major structural supports were violated, reinforcing the BTFD (Buy The Dip) narrative for future sessions.
Lessons & Observations
-
“Liquidation days” offer high R/R short setups, but only when entries align with structure and timing.
-
Patience and adherence to timing windows was a recurring theme. Manny emphasized not forcing trades early and waiting for probabilities to favor action.
-
Discussion of Bayesian probability, pivot structure, and trade system adaptation offered deep learning moments.
Cycle Outlook
-
Yesterday satisfied CD1 average decline.
-
Today may offer a backtest opportunity around 6768.50 — look for buying interest to validate that level per David’s analysis.
Summary
A strong session with:
-
Clear short-side setups called and paid.
-
Cycle levels and timing windows respected.
-
Discipline and patience emphasized over impulsive trades.
Quote of the Day:
“All bounces get sold… It’s Liquidation Day.” – PTGDavid
Great day for traders who stuck to the plan and stayed aligned with structure and timing.
DTG Room Preview – Friday, October 10, 2025
-
Government Shutdown – Day 10: Senate gridlock continues, but a potential breakthrough is in sight as some Republicans signal openness to reviving ACA subsidies—Democrats’ core demand. Public pressure is rising, with polls showing most Americans support continued healthcare aid and blame GOP hardliners for the stalemate.
-
Oil Slides: WTI crude drops below $62/barrel amid cautious optimism over an Israel-Hamas prisoner exchange deal, which could remove the geopolitical risk premium from oil prices.
-
China Tightens Chip Imports: Chinese customs are now rigorously inspecting Nvidia chip imports (H20, RTX Pro 6000D) as part of a crackdown on smuggling. China aims to grow its domestic AI chip sector, but local chips still lag behind Nvidia’s performance.
-
Microsoft Cloud Strain: Microsoft faces infrastructure shortages in U.S. data centers, limiting new Azure subscriptions. Constraints are expected through 2025, per CFO Amy Hood.
-
Samsung Surge: Samsung shares jump 6% in Hong Kong, pushing the stock toward record highs. The company is riding AI and memory chip optimism and now boasts a $391B market cap.
-
Earnings Watch: No major earnings today. Big banks kick off Q3 earnings season next week.
-
Economic Data: UoM Consumer Sentiment and Inflation Expectations are due at 10:00am ET.
-
Fed Watch: Fed speakers today include Chicago’s Goolsbee (9:45am ET) and St. Louis’ Musalem (1:00pm ET).
-
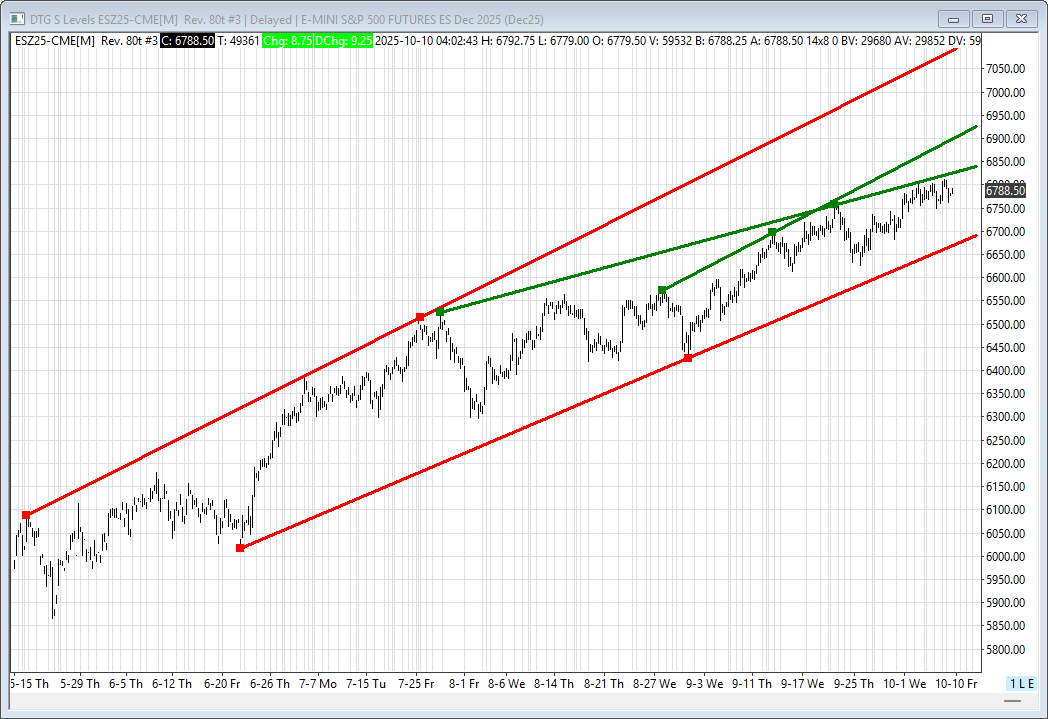
Market Technicals: ES continues to trade below its short-term uptrend channel top (6834/39s), with the structure unchanged. Resistance at 6834/39s, 6925/30s, 7120/25s; support at 6690/95s.
-
Volatility & Flow: ES 5-day ADR up to 47.25 points. Overnight whale volume light and mixed—no clear bias.
-
Heads-Up: Monday is a U.S. banking holiday—bond markets closed, stock markets open regular hours.
Affiliate Disclosure: This newsletter may contain affiliate links, which means we may earn a commission if you click through and make a purchase. This comes at no additional cost to you and helps us continue providing valuable content. We only recommend products or services we genuinely believe in. Thank you for your support!
Disclaimer: Charts and analysis are for discussion and education purposes only. I am not a financial advisor, do not give financial advice and am not recommending the buying or selling of any security.
Remember: Not all setups will trigger. Not all setups will be profitable. Not all setups should be taken. These are simply the setups that I have put together for years on my own and what I watch as part of my own “game plan” coming into each day. Good luck!!
Follow @MrTopStep on Twitter and please share if you find our work valuable!
This post goes out as an email to our subscribers every day and is posted for free here around 2 PM ET. To get your real-time copy, sign up for the free or premium version here: Opening Print Subscribe.
Comments are closed