This post goes out as an email to our subscribers every day and is posted for free here around 2 PM ET. To get your real-time copy, sign up for the free or premium version here: Opening Print Subscribe.
Gaps Are Tradable, But Risk Is Real — Bots, Bots and More Bots in a Thin Market With War Risk on the Radar
Follow @MrTopStep on Twitter and please share if you find our work valuable!
Our View
There will never be a dull moment with regard to the ES, NQ, YM, and RTY. I started trying to break down the daily volume of the ES total volume, and when you take out the 185k from Globex and subtract it from the 1.248 million, that is 1.062 million. Of that, approximately 637,800 to 797,250 contracts (60% to 75% of the 1.062M) are attributed to algorithms, HFT, and AI bots.
What I am trying to say is yesterday’s volume is a good example of what I call “thin to win.” When the crowd is short, the bots take over.
Our Lean


While they have shown little interest in Venezuela, Russia and China are holding naval exercises with Iran in the Strait of Hormuz. The Maritime Security Belt 2026 exercise comes as the U.S. is deploying forces to the Middle East ahead of a possible attack. It really sounds like Trump wants to attack Iran, and some are saying the attack could come in days, but this adds a new twist to the already very volatile situation.
If the USS Gerald R. Ford keeps its current speed, it will arrive off the coast of Israel by Sunday morning. I do not think an attack on Iran is good, and if it does happen, the ES and NQ will drop sharply.
Our lean: I still think the gaps are tradable in either direction. While I still think we can print higher, there remains a lot of risk. I really do not have any targets in mind, but the 6920–6930 level is still a big area. Below are today’s AI levels, which have been fairly accurate.
Resistance Zones
6,902.25
6,914.28 – 6,917.56
6,926.26 – 6,931.65
6,934.62 – 6,937.86
6,945.75 – 6,946.70
6,966.58
Support Zones
6,897.25 – 6,894.25
6,892.36 – 6,889.58
6,887.25
Guest Posts:
Dan @ GTC Traders
The GTC Sample Portfolio … 2025 and 2026 … Part IV
We have had three previous entries discussing the GTC Sample Portfolio’s performance. Both how we performed in 2025, and then how we are looking ahead to 2026. We were interrupted last week from continuing this series, as I had to fly out of town on a family emergency. But as we have returned, we can finish the topic this week.
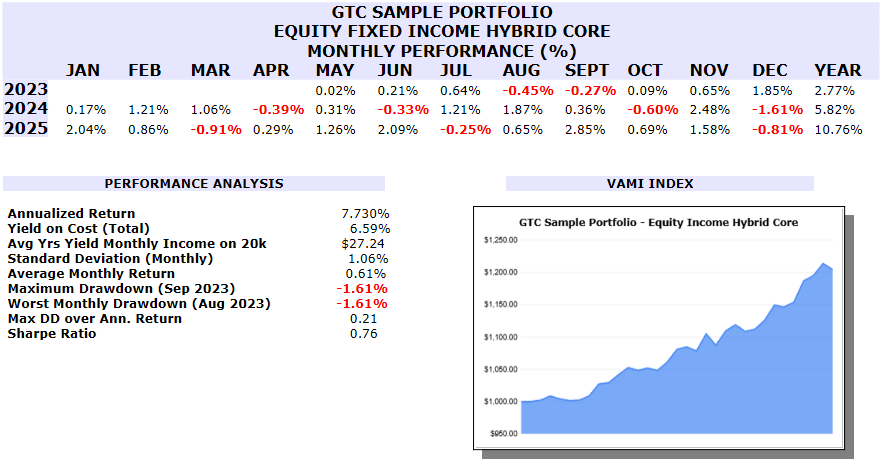
In Part I, we discussed overall portfolio performance. As the portfolio itself is comprised of three programs, in Part II we then discussed the first third of the portfolio; the Equity Fixed Income Hybrid Core program. Next, in Part III we discussed the Long-Short Valuation Account. Let’s discuss the final portion, our short-term trading program.
The Short-Term Trading Account in 2025
As we have previously stated, we are looking for linearity, rather than absolute returns. The first two programs were engineered. The third was assumed.
And as we mentioned in this article, perhaps we made too many assumptions, and a tad bit of arrogance bit us as we began the short-term trading account in 2025. We were positive. We made money.
But again, we were aiming for linearity, and we were not happy at all with the volatility of the return series. We assumed that nearly 30 years of discretionary trading experience each would be enough. So we weren’t working with a formal framework, or codified structure. Just judgment. It wasn’t reckless. It wasn’t disastrous. It was profitable. But it was undisciplined relative to the standard we set elsewhere in the portfolio. So it wasn’t meeting the objective. The risk-adjusted metrics were all over the place.
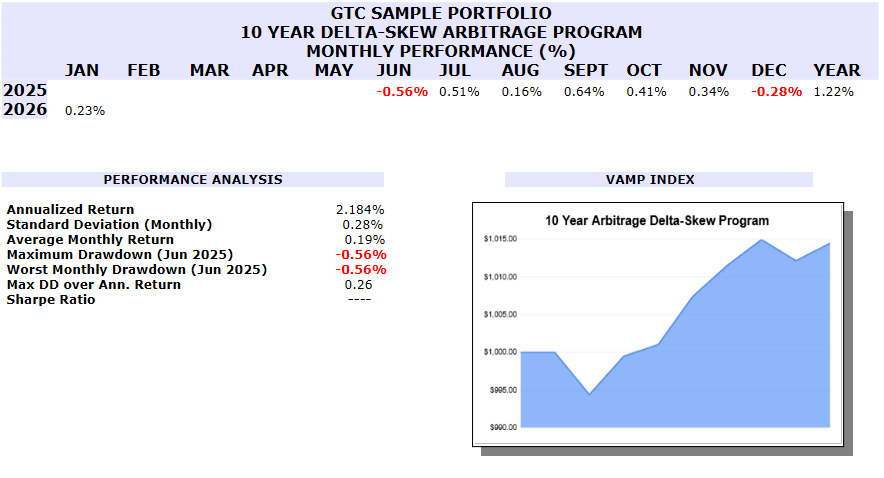
So we introduced two programs specifically designed for the GTC Sample Portfolio:
-
the 10-Year Delta-Skewed Arbitrage Program, and
-
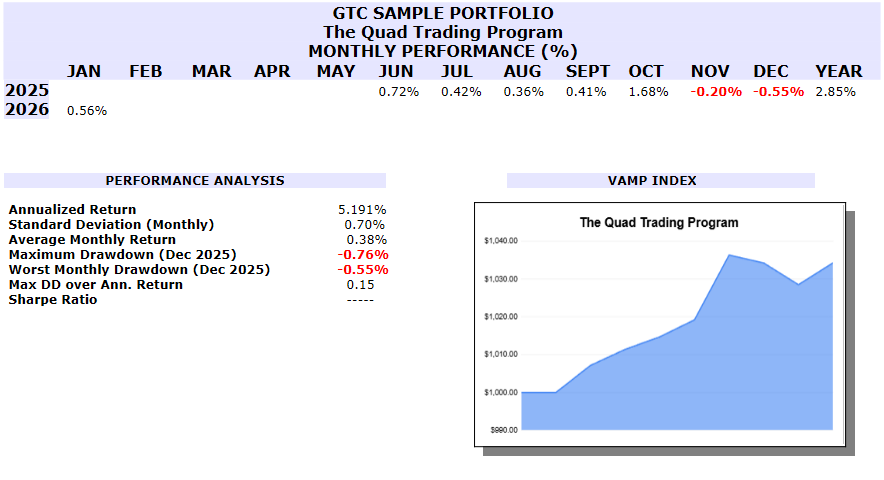
the Quad Trading Program
Both were engineered from the ground up for the GT Traders brand. This avoids conflicts with anything else we may be doing. And both were turned for this particular environment, which is to say: a linear return profile.
If you look at the entire short-term trading program performance grid ..
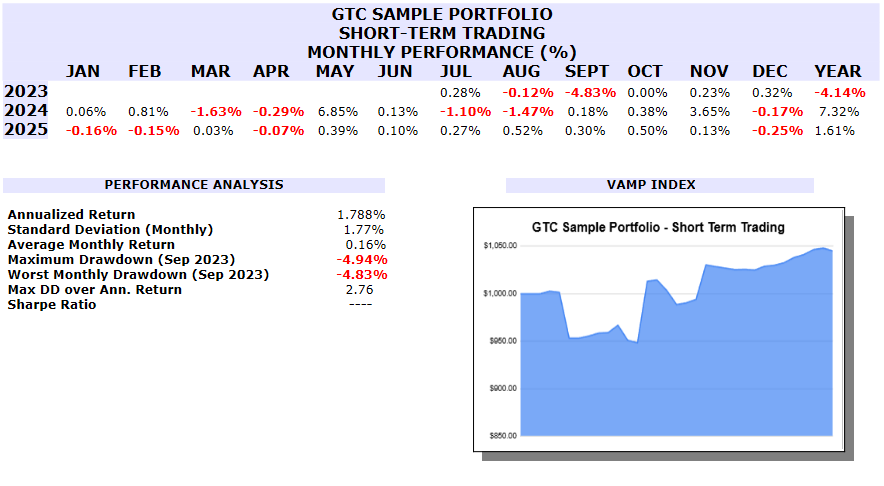
I’m sure you can almost see where we the return profile jumped in that image from a more volatile return series, to one that is more linear.
And to be sure, those two programs (the 10-Year Delta-Skewed Arbitrage Program, and Quad Trading Program) are not the only two programs running within the short-term trading account.
The 10-Year Delta-Skewed Arbitrage Program only comprises about 7% of the total Short-Term Trading Account …
And the Quad Trading Program is only 21% of the total Short-Term Trading Account …
I really want to emphasize this next point …
We could get greater returns in the short-term trading account by simply giving those two programs a greater percentile allocation to the capital in the short-term trading account. And eventually, we will.
Nothing should remain static in any portfolio. It adjusts to greater market conditions. As will the above two programs. Even the models within those programs will change, and to aim for greater returns in the future, as well as the program structure itself
But that time is not now. For now? We are running the 10 Year Delta-Skew Arbitrage Program at about a 7% allocation of the capital in the Short-Term Trading account. And the Quad Trading Program at about a 21% allocation of the Short-Term Trading account. We also have a small ‘Carry’ placed within the account, as well as room for option trades and what we call ‘relationship trades’.
For now, know that we adjusted how the short-term trading account is running in 2025, to meet our objective, and those are the allocations.
Looking to 2026 and the Overall Portfolio
So … look at the overall portfolio to see how we have deliberately tuned it for a linear return profile.
We have a core of assets, which are long only. But they are also hedged up during times of market turmoil. LONG CORE … HEDGED …
Then we have a Long-Short Valuation Account that for the current market? Is running a Program at 100% that is only looking for shorts against the market … SHORT-ONLY
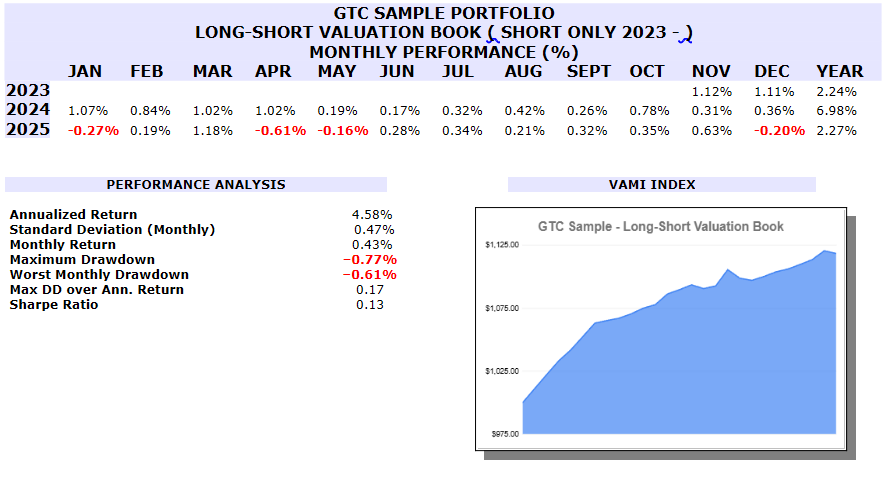
That is probably one of the single best short-only programs we’ve seen out there. We’re willing to be corrected if someone can point to something that is currently running better than the above. Regardless … to repeat … we have the Equity Fixed Income Hybrid Core running LONG-CORE HEDGED, albeit conservatively. We have a fantastic SHORT ONLY PROGRAM. If you add those two things together what do you have?
You got it. Smoothed out returns in a portfolio wherein two different sections are purposefully built to literally work against what the other is doing.
And we add in the above short-term trading account to smooth out the entire return series.
And in 2026, when the performance is there? We’re going to tweek both the 10-Year Delta-Skew Arbitrage Program, and the Quad Program.
All to maintain, at least in this environment? That linear return series.
Until next time, stay safe and trade well …

Geopolitics are playing an increasingly important role in markets for metals, which rallied sharply at the beginning of this year. In this special issue of Briefings, our analysts explain the key drivers for precious metals like gold, as well as for base metals that are used in infrastructure and defense, such as copper and nickel.
▪ Investors appear to be turning to “hard assets” in the face of growing uncertainty, and some metals like gold and copper could be particularly well positioned.
▪ Higher prices—and more volatility—could be ahead for the gold market.
▪ Why nickel soared: Indonesia, which controls more than 60% of the global nickel mining supply, spurred a rally by signalling supply constraints.
▪ Briefings Brainteaser: How much silver is held in London’s vaults?
What’s Driving Metals Markets?
Metals prices rallied last year, and most have had a strong start in 2026, too.
As geopolitical uncertainty increases, there are signs of growing investor demand for physical assets, according to Daan Struyven, co-head of global commodities research.
“Hard assets are tangible, physical items that have intrinsic value, including commodities, real estate, infrastructure, and equipment, and tend to hold value over time, especially during inflation or economic uncertainty,” Struyven writes in a research report.
That said, metals may gain more from the shift to hard assets than energy commodities.
In part, this is because metals markets are relatively small, particularly in comparison with the bonds and equities that dominate investor portfolios. Open interest in the global copper market is around 135 times smaller than the amount of outstanding privately owned US Treasuries.
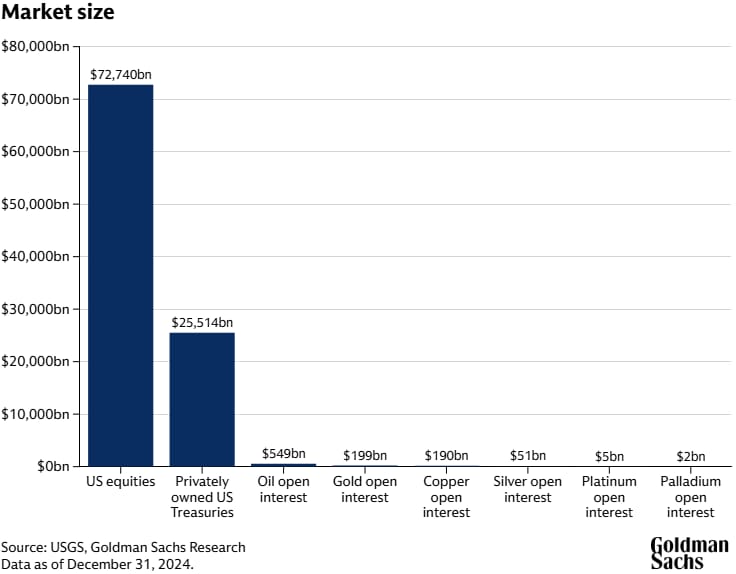
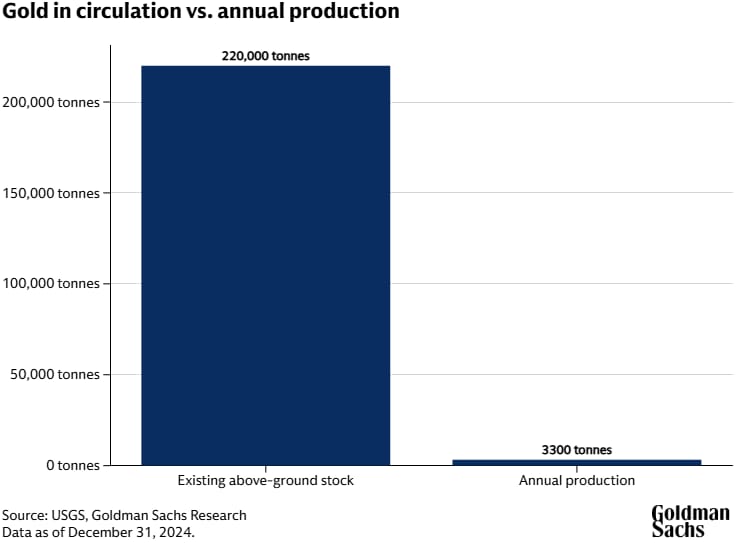
And while higher energy prices tend to incentivize shale oil and gas producers to increase their output, the supply of precious metals and copper is constrained. Gold mine production is stable and largely unresponsive to price. In addition, nearly all the gold that’s ever been mined still exists, and this above-ground stock dwarfs annual mine production. For copper, it takes around 17 years from mine discovery for production to begin.
Finally, metals are easy to store, making them less vulnerable to storage capacity limits than energy and agriculture commodities.
“Our analysis suggests that the investor rotation in hard assets can keep several metals prices high for longer, including above what physical fundamentals justify, which we think is the case right now for copper,” Struyven writes.
Market Recap:
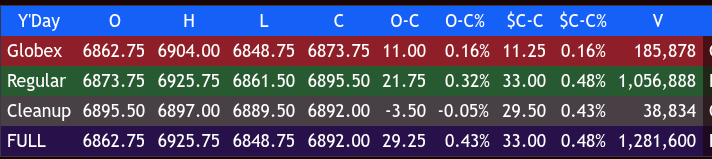
The ES traded up to 6904.00 on Globex and opened Wednesday’s regular session at 6873.75. After the open, the ES sold off down to 6861.25, rallied up to 6919.00 at 10:15, pulled back to 6906.75, rallied up to 6923.75, and pulled back to 6914.25 at 11:20. It then rallied up to a lower high at 6921.75 at 11:30, sold off down to 6907.50 at 12:00, and traded back up to 6923.25, two ticks off the high.
The ES made a 6912.75 double bottom at 12:40, rallied up to a new high at 6925.75 at 1:00, and then sold off down to 6872.25 at 3:15. It rallied up to 6898.75 at 3:49 and traded 6895.50 as the 3:50 imbalance showed $1 billion to buy. The ES traded up to 6905.50 at 3:55, started going offered, and traded 6895.50 on the 4:00 cash close.
After 4:00, the ES traded down to 6889.50 at 4:20 and settled at 6892.00, up 33.00 points or +0.48%. The NQ settled at 24,930.00, up 191 points or +0.76%, the YM settled at 49,722, up 110 points or +0.22%, and the RTY settled at 2,622.90, up 9.30 points or +0.33% on the day.
In the end, it was exactly what my lean called for — buy the weakness. In terms of the ES and NQ’s overall tone, it was all buy programs until around 1:15 when the sell program kicked in. In terms of the ES’s overall trade, volume was low at 1.284 million contracts traded.
After falling four days in a row and firming up tone on Tuesday, the better tone continued into Wednesday’s trade but hit a snag after the January Fed minutes showed some Fed officials had little appetite for interest rate cuts at their January meeting, with most seeking further inflation progress. The DXY closed higher, up 4 in a row for a total gain of 0.93%, and oil (CLH) gained +4.59%. Gold rallied $103.60 or +2.12% as US-Iran tensions soared, and bitcoin futures (BTH26) made a low at 66,145, down 2.27%, marking its lowest point since the 96,500 level seen on November 14, 2025.
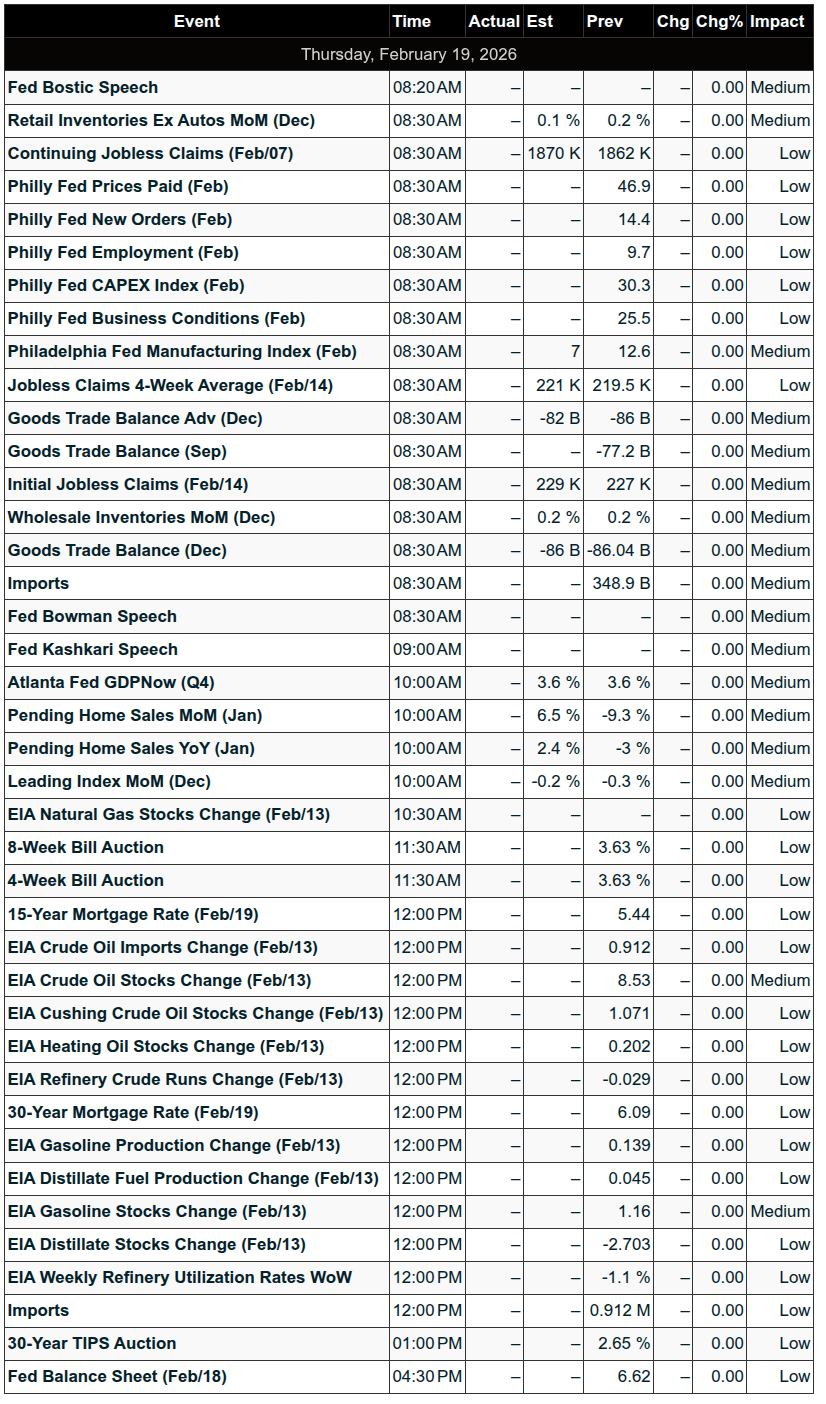
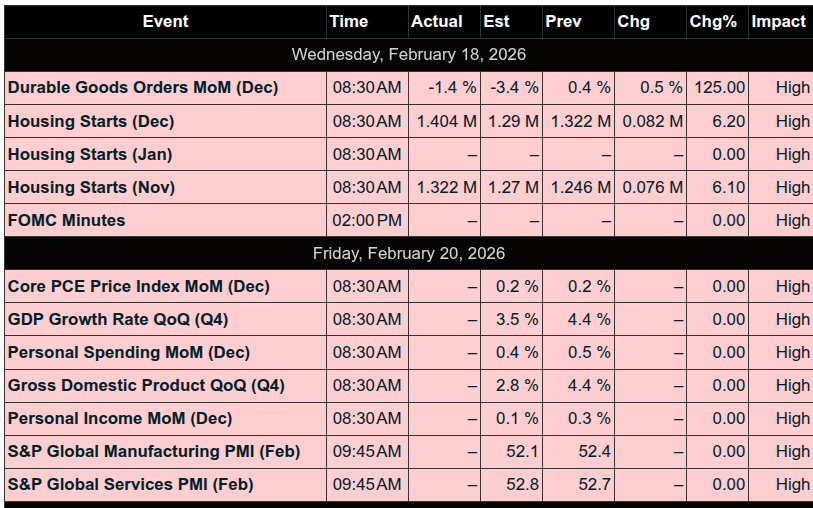
Today: Walmart (WMT) is scheduled to report earnings before the open. At 8:30, Initial Jobless Claims, U.S. Trade Deficit, Philadelphia Fed Manufacturing Survey, Advanced U.S. Trade Balance in Goods, Advanced Retail Inventories, and Advanced Wholesale Inventories will be released, followed by Minneapolis Fed President Neel Kashkari speaking at 9:00 am and the Leading Economic Index at 10:00 am.
MiM
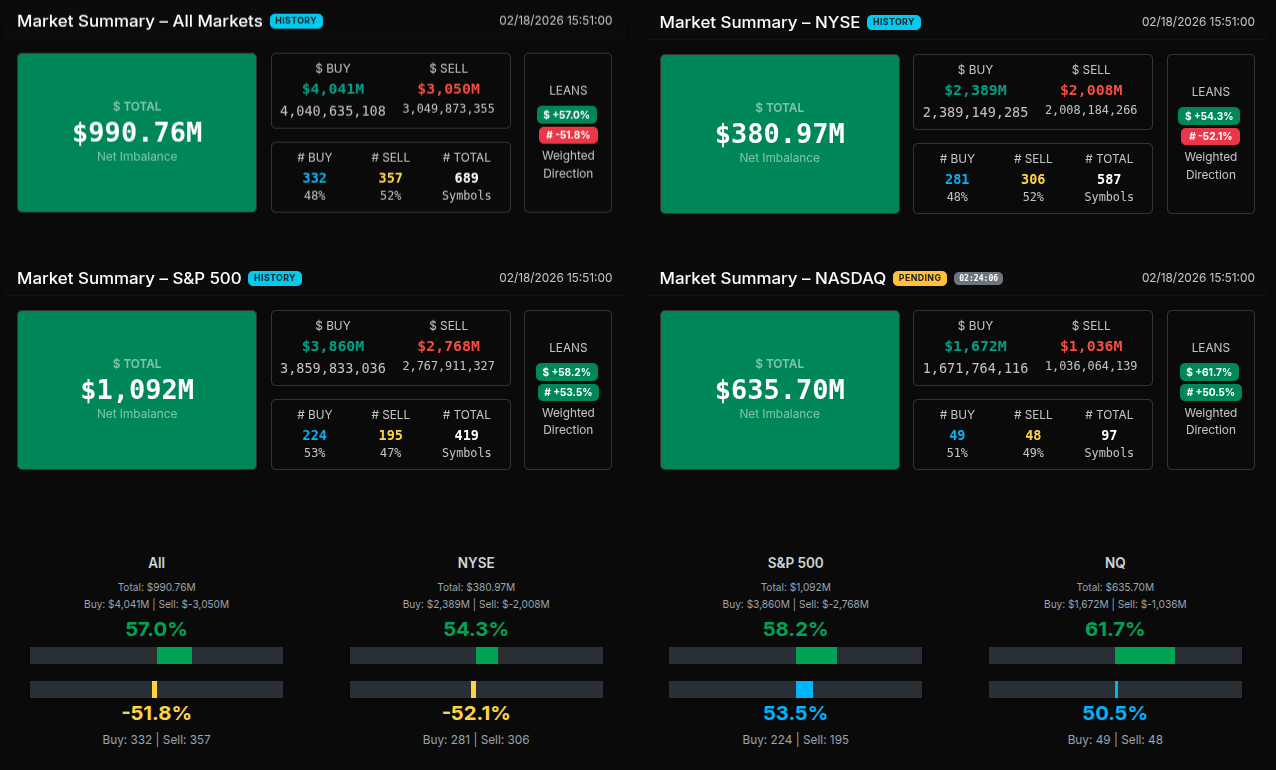
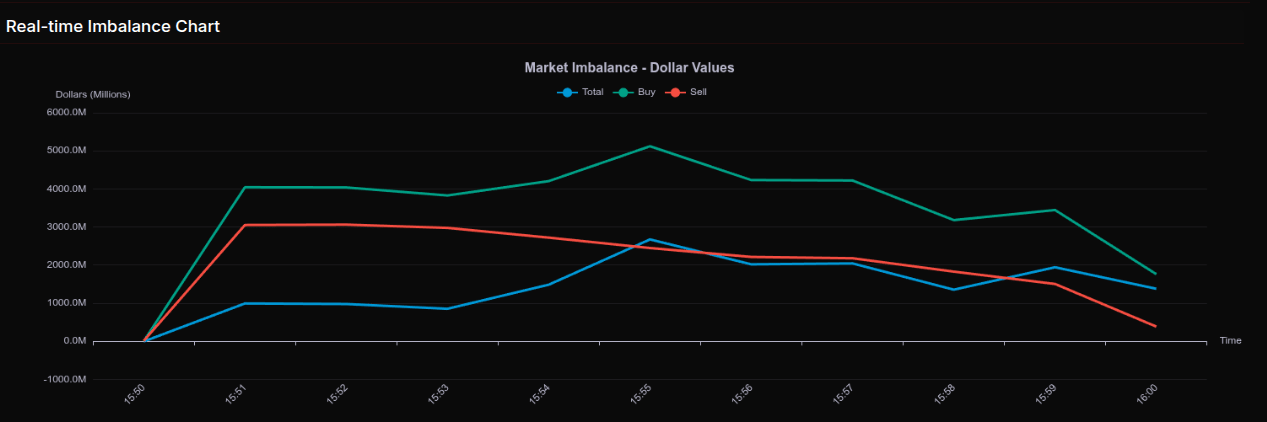
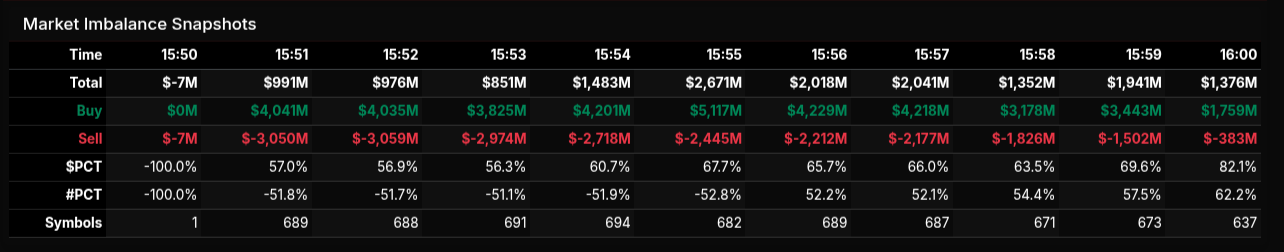
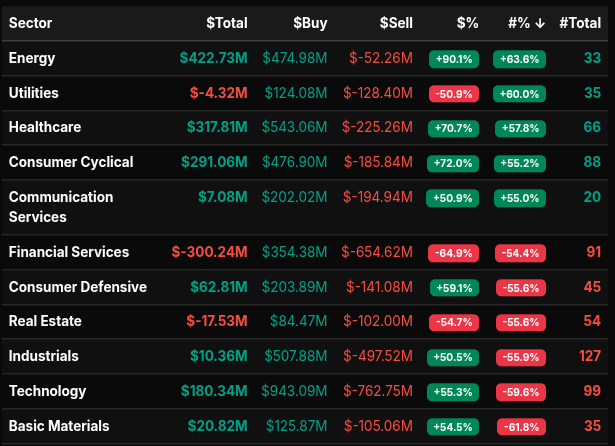
The February 18th close saw a decisive shift into buy programs, with the MOC opening modestly and then accelerating into a broad institutional bid. At 15:50, the imbalance was essentially flat at -$7M, but by 15:51 flipped sharply to +$991M. From there, buy pressure steadily built, peaking at +$2.67B around 15:55 before settling at +$1.37B into the 16:00 print. Buy dollars consistently expanded while sell pressure tapered, producing a strong late-session ramp with $PCT finishing at 82.1%, clearly signaling aggressive demand rather than simple rotation.
Sector flows confirmed this was not random. Energy led with +$422.7M and a +90.1% lean, marking clear wholesale accumulation. Healthcare (+$317.8M, +70.7%) and Consumer Cyclical (+$291.1M, +72.0%) also showed strong directional buying. Technology added +$180.3M with a +55.3% lean, more rotational but still supportive. Industrials (+50.5%) and Communication Services (+50.9%) reflected balanced accumulation rather than extreme conviction.
On the sell side, Financial Services stood out at -$300.2M with a -64.9% lean, approaching wholesale distribution. Utilities (-50.9%) and Real Estate (-54.7%) also saw defensive rotation out. Basic Materials printed +54.5% but with negative participation breadth (-61.8%), highlighting internal crosscurrents.
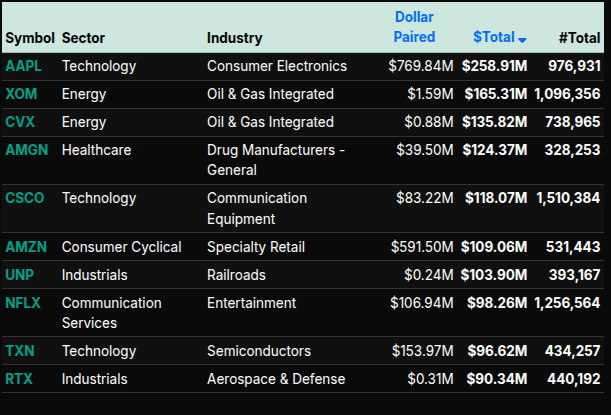
Single name activity underscored the theme. Strong buys included AAPL (+$258.9M), XOM (+$165.3M), CVX (+$135.8M), AMGN (+$124.4M), and CSCO (+$118.1M). Semiconductors were active on both sides with NVDA (+$145.9M) and LRCX (+$126.3M) drawing demand. Financial heavyweights leaned offered, including V (+$165.6M paired but sector negative), JPM (+$95.7M), BAC (+$56.6M), and GS (+$52.6M), reflecting the broader financial sector pressure.
Index summaries reinforced the strength: S&P 500 closed with +$1.09B imbalance and a +58.2% lean, Nasdaq +$635.7M at +61.7%. This was a coordinated, broad-based buy-side MOC with selective financial rotation, signaling institutional demand into the closing auction rather than passive rebalancing.

Technical Edge
Fair Values for February 19, 2026
-
S&P: 15.21
-
NQ: 64.31
-
Dow: 62.47
Daily Breadth Data 📊
For Wednesday, February 18, 2026
• NYSE Breadth: 65% Upside Volume
• Nasdaq Breadth: 66% Upside Volume
• Total Breadth: 66% Upside Volume
• NYSE Advance/Decline: 57% Advance
• Nasdaq Advance/Decline: 58% Advance
• Total Advance/Decline: 58% Advance
• NYSE New Highs/New Lows: 167 / 32
• Nasdaq New Highs/New Lows: 180 / 153
• NYSE TRIN: 0.71
• Nasdaq TRIN: 0.73
Weekly Breadth Data 📈
For the Week Ending Friday, February 13, 2026
• NYSE Breadth: 51% Upside Volume
• Nasdaq Breadth: 53% Upside Volume
• Total Breadth: 52% Upside Volume
• NYSE Advance/Decline: 55% Advance
• Nasdaq Advance/Decline: 42% Advance
• Total Advance/Decline: 46% Advance
• NYSE New Highs/New Lows: 653 / 174
• Nasdaq New Highs/New Lows: 675 / 590
• NYSE TRIN: 1.21
• Nasdaq TRIN: 0.63

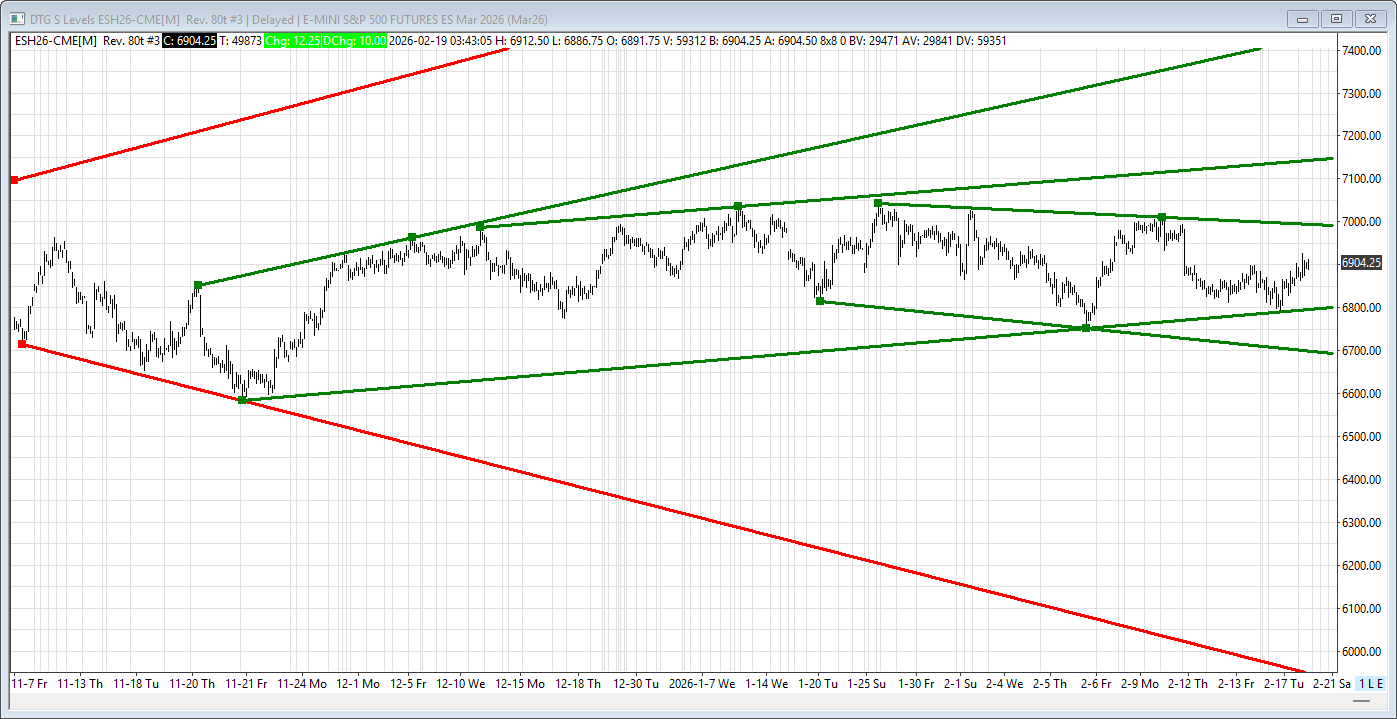
BTS Levels:
ESH2026
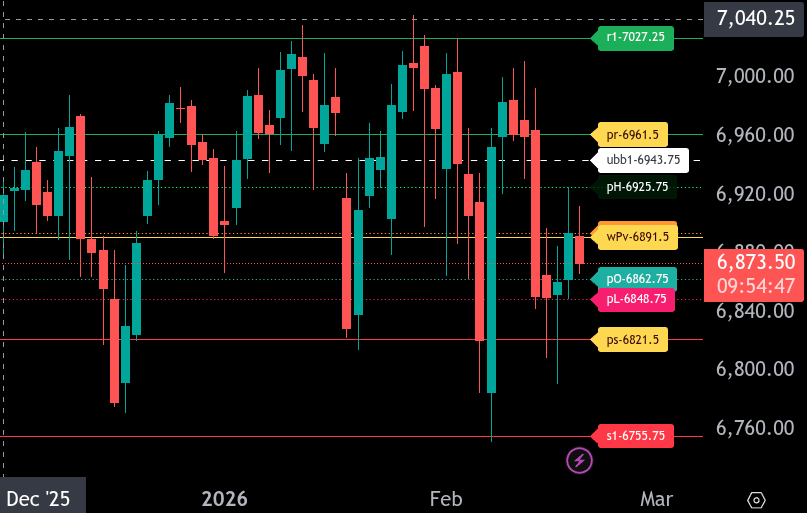
The bull/bear line for the ES is at 6891.50. This is the key level that must be reclaimed for bullish momentum to resume. Acceptance above this level shifts short-term sentiment back to the upside, while continued trade below keeps sellers in control.
ES is currently trading around 6872.25, holding below the bull/bear line and showing early weakness in the Globex session. As long as price remains under 6891.50, rallies into this area are likely to find sellers. Initial resistance comes in at 6891.50, followed by 6925.75 and 6943.75. A sustained break above 6943.75 opens the door to 6961.50, our upper intraday range target. If momentum builds above 6961.50, the next major upside objective sits at 7027.25.
On the downside, first support is 6862.75, followed by 6848.75. A break below 6848.75 exposes 6821.50, which is our lower intraday range target. If 6821.50 fails to hold, expect an extension toward 6755.75. That level represents a key downside reference and would signal expanded volatility if tested.
Overall, the market remains bearish below 6891.50. Bulls need acceptance back above this level to regain control and target 6961.50. Until that happens, rallies are suspect and downside probes toward 6821.50 remain in play.
NQH2026
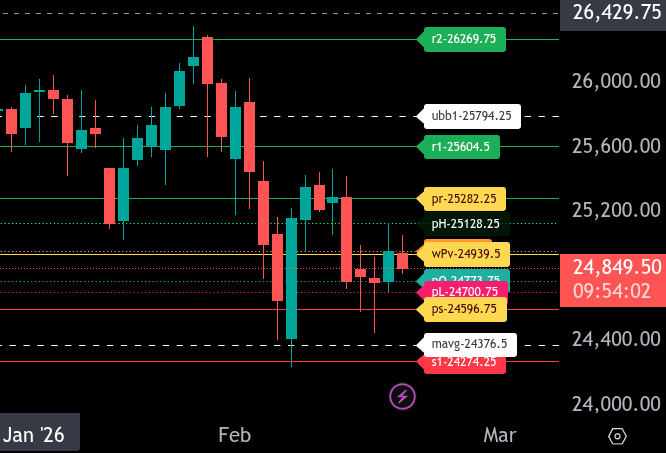
The bull/bear line for NQ is at 24,939.50. This is the key pivot for today’s session. Holding below this level keeps sellers in control, while acceptance back above it shifts momentum back to the bulls.
NQ is currently trading around 24,853.50 in the overnight session, positioning price below the bull/bear line. As long as price remains under 24,939.50, rallies into that level are likely to find resistance. A failure to reclaim it opens the door to a rotation down toward 24,773.75, followed by 24,700.75. Below that, our lower range target for today sits at 24,596.75. A sustained break under 24,596.75 exposes 24,274.25 as a deeper downside objective.
On the upside, bulls need a clean reclaim and hold above 24,939.50 to regain control. If acceptance builds above this pivot, look for a push toward 25,282.25, which is the upper intraday range target. Intermediate resistance comes in near 25,128.25. A strong move through 25,282.25 would signal expansion and could open the path toward 25,604.50.
Overall, the tone remains bearish below 24,939.50. Trade location carefully around this pivot. Acceptance above favors pullback buying toward 25,282.25, while continued rejection below favors selling rallies targeting 24,596.75.
Economic Calendar Today
This Week’s High Importance
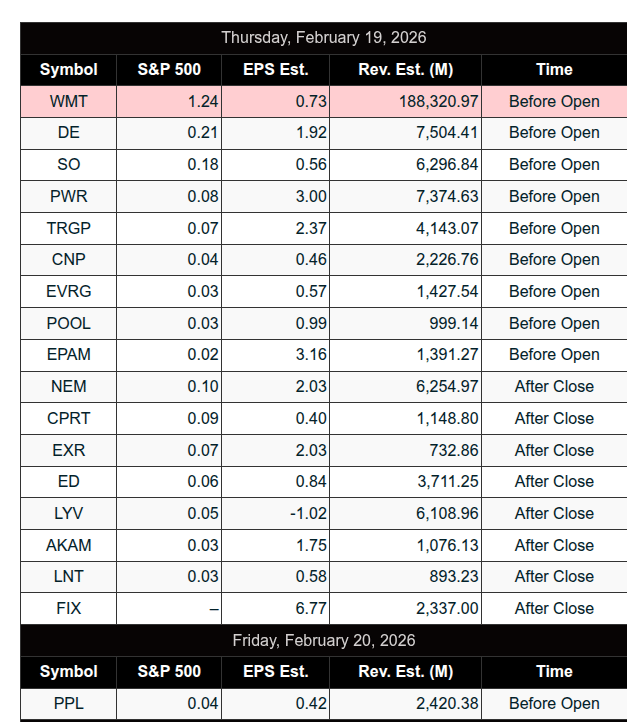
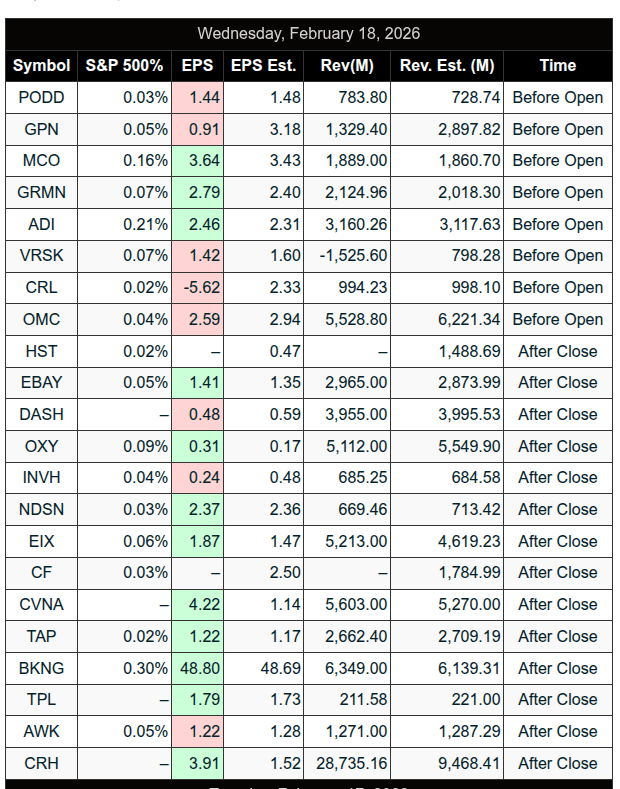
Earnings:
Recent
Trading Room News:
PTG Room Summary – Wednesday, February 18, 2026
David laid out the plan early, reinforcing PTG’s core principle—same process every day: consistent, clean setups, disciplined execution.
Pre-Market Plan: Structured and Scenario-Based
With Cycle Day 2 in play, the roadmap was clear:
-
Bull Case: Acceptance above 6855 ±5
Targets: 6875 → 6885 → 6895 -
Bear Case: Acceptance below 6855 ±5
Targets: 6835 → 6825 → 6815
David also prepped the room for:
-
VIX Expiration at 9:30 ET
-
Potential for large, unusual swings at the cash open
-
Elevated volatility conditions
-
Crude Oil contract rollover (April contract)
The tone was calm and prepared—anticipating volatility rather than reacting emotionally to it.
Morning Session: Bull Targets Fulfilled Early
The Bull Case played out quickly, with the 6895 target fulfilled early in the session.
With upside objectives hit fast, David shifted expectations:
“Upside targets fulfilled… anticipating early MATD rhythms.”
That flexibility—adjusting once targets are achieved—is a hallmark of experienced trade management.
Member Wins
-
Quick short scalp executed and closed profitably in under a minute.
-
Open Range strategies performed exceptionally well.
By mid-morning, the Open Range TRIFECTA was in motion.
Open Range TRIFECTA – Winning Day
By 1:47 PM:
“All Open Range plays are now closed… TRIFECTA Winning Day.”
This was a strong execution day. The morning structure delivered. Trades were taken according to plan, and the room capitalized before conditions shifted.
A textbook example of:
-
Trade the plan.
-
Take what the market gives.
-
Lock in gains.
-
Don’t overstay.
Midday Shift: Gamma & Hedge Awareness
Discussions included:
-
Key gamma levels on SPX/NDX
-
6900 SPX identified as a Big Hedge Wall
-
OPEX dynamics and dealer positioning
The room stayed aware of structural influences, not just price action.
This macro awareness helped frame the afternoon.
Afternoon: Controlled Demolition & Bear Shift
Around 1:30 PM, a key shift occurred.
Internals deteriorated after upside targets were fulfilled. The market transitioned into what David described as a:
“Controlled demolition.”
Instead of fighting it, he emphasized the core lesson of the day:
“ALWAYS STAY ALIGNED with Dominant Direction.”
Premiums and A4 setups continued to perform on the downside, showing that opportunity remained—but only for those aligned with the shift.
This was a strong teaching moment:
-
Morning = structured bullish fulfillment.
-
Afternoon = controlled bearish rotation.
-
Successful traders adapted.
Mental Game & Probability Thinking
A powerful exchange captured an important psychological edge:
“If one follows their rules, it gives less ammo to one’s inner critic.”
And:
“Fundamentally we are trading our personal beliefs about our ability to manage uncertainty.”
David reinforced probability thinking and shared PTG University material. The underlying message:
Execution reduces emotional noise. Discipline builds mental calmness.
Close: Balance & Imbalance
-
Midpoint VWAP identified as a natural Cycle Day 2 settling zone.
-
$1B MOC buy imbalance into the close.
-
Market effectively neutralized both extremes.
The day ended balanced after a wide range of opportunity on both sides.
Key Takeaways from February 18
-
Preparation Wins. The levels were clear pre-market. Targets were fulfilled cleanly.
-
Take Profits When Objectives Hit. Don’t overstay once structure completes.
-
Expect Volatility Around Events (VIX Exp, OPEX).
-
Recognize and Respect Shift Times. 1:30 PM marked the directional turn.
-
Stay Aligned With Dominant Direction. Fighting the tape is optional. Losses are not.
-
Discipline Quiet the Inner Critic. Following rules strengthens emotional stability.
Overall Assessment
A highly productive day:
-
Bull targets achieved early.
-
Open Range TRIFECTA closed green.
-
Afternoon offered additional aligned opportunities.
-
Strong emphasis on psychology, adaptability, and structure.
Cycle Day 2 delivered range, volatility, and teachable transitions—and the room handled it with structure and discipline.
DTG Room Preview – Thursday, February 19, 2026
Macro Focus
-
Weekly Unemployment Claims headline a loaded 8:30am ET data dump
-
Additional releases: Philly Fed, Trade Balance, Wholesale Inventories
-
10:00am ET: Pending Home Sales, CB Leading Index
-
12:00pm ET: Crude Oil Inventories
-
Multiple Fed speakers throughout the morning (Bostic, Bowman, Kashkari, Goolsbee)
Fed Minutes Highlights
-
Officials split on additional rate cuts
-
Preference to hold rates steady until inflation is clearly back on track
-
Inflation progress toward 2% may be slower and uneven
-
Majority see downside employment risks as moderating
-
Some flagged potential rate hikes if inflation remains sticky
-
AI-related elevated equity valuations noted as a vulnerability
Political / Headline Risk
-
Tariffs back in focus; Supreme Court decision expected Friday
-
Administration pushed back on NY Fed report citing tariff costs to U.S. consumers/businesses
-
Potential policy uncertainty tied to Fed leadership and rate path
Corporate News
-
OpenAI nearing funding round that could exceed $100B
-
Reported strategic investors: AMZN, SoftBank, NVDA, MSFT
-
Allocation finalizations expected by month-end
-
Earnings
-
Premarket: BABA, WMT, DE, SO, TECK, W, TRGP, and others
-
After the Bell: NEM, TXRH, LYV, AKAM, CPRT, FNF
-
Friday AM: AU, PPL
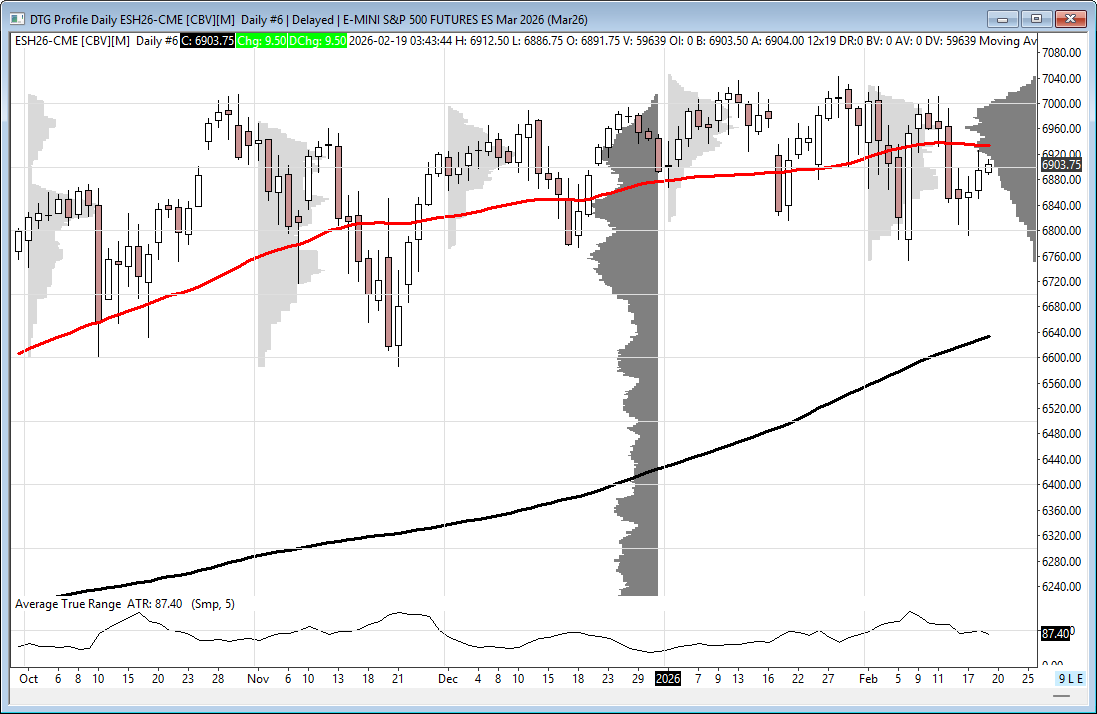
ES Technical Overview
-
5-day average daily range: ~98 points (volatility still elevated)
-
Wednesday bounce off 50-day MA (6933.75)
-
Currently acting as near-term resistance
-
Could flip to support if reclaimed
-
-
ES remains in a 3-month consolidation / coil under ATHs
-
Positioned near midpoint of:
-
Short-term downtrend channel
-
Intermediate-term uptrend channel
-
-
No meaningful overnight large trader (“whale”) bias
Key ES Levels
-
Resistance: 6994/6991, 7145/7150
-
Support: 6800/6803, 6695/6690
Market remains rangebound but compressed — watch for expansion as data and Fed commentary hit.
Affiliate Disclosure: This newsletter may contain affiliate links, which means we may earn a commission if you click through and make a purchase. This comes at no additional cost to you and helps us continue providing valuable content. We only recommend products or services we genuinely believe in. Thank you for your support!
Disclaimer: Charts and analysis are for discussion and education purposes only. I am not a financial advisor, do not give financial advice and am not recommending the buying or selling of any security.
Remember: Not all setups will trigger. Not all setups will be profitable. Not all setups should be taken. These are simply the setups that I have put together for years on my own and what I watch as part of my own “game plan” coming into each day. Good luck!
This post goes out as an email to our subscribers every day and is posted for free here around 2 PM ET. To get your real-time copy, sign up for the free or premium version here: Opening Print Subscribe.
Comments are closed