Holiday-Shortened Week Should Bring Lower Volume
Follow @MrTopStep on Twitter and please share if you find our work valuable!
Every week, MrTopStep invites traders to an “Own the Close” contest where the closest guesstimate where the SPX will settle on Friday’s 4:00 cash close.
The winners get a free week’s access to the MrTopStep Chat and trading tools. Enter your guess now!
Our View
The shortened Memorial Day holiday trading week has a mix of seven Fed speakers and ten economic reports. Despite the Fed backing off lowering rates, the markets have powered higher with the S&P on track for its best May since the 2009 credit crisis.
The Nasdaq made a new all-time contract high on Friday and both the NQ and the ES closed higher for their 5th straight week while the YM snapped a five-week winning streak.
The selloff has not changed my opinion very much. After a let down on Thursday, the ES recouped nearly 50% of the decline. According to the Stock Trader’s Almanac the day after Memorial day has the Dow up 23 of the last 28 occasions, but down 7 of the last 9. The week after Memorial Day has the Dow down 16 of the last 28, but Thursday looks like a strong up day.
Late on Friday, Goldman Sachs’ economics team pushed back its call for the first Fed cut from July to September, but said the “timing of the first cut remains a difficult question.” I still say it’s a long shot that there are any rate cuts in 2024.
Our Lean
The day after the holiday should see lower volumes. With this in mind, my lean is for buying the pullbacks. Should the ES get above the 5331 50% retracement, I think it’s possible that the ES could trade up into the 5340s.
Nvidia was up more than 2% in the premarket, putting the tech giant on track to build on its post-earnings rally from last week. The stock surged 15% to record highs last week after reporting blockbuster quarterly results. Let’s see if that can continue to power the NQ higher.
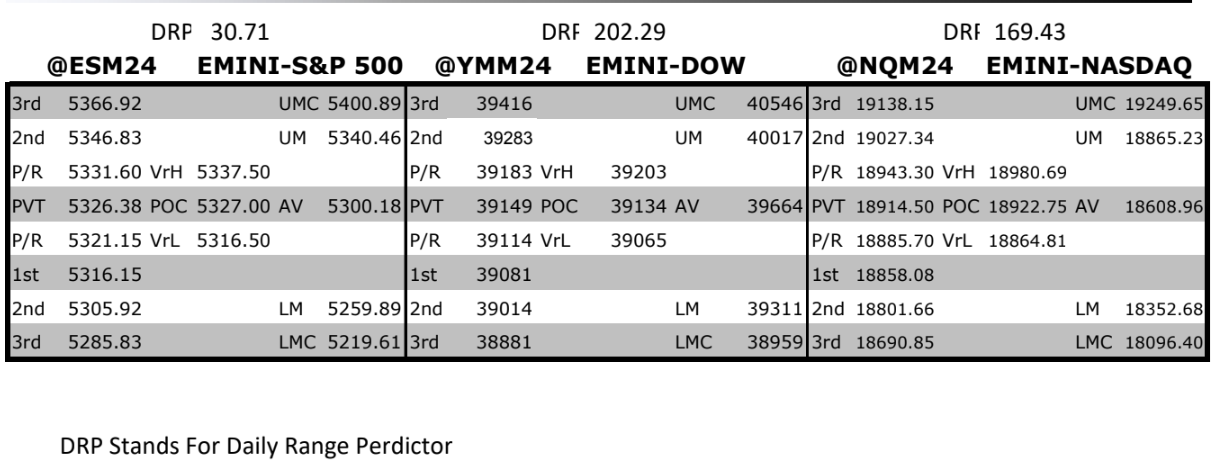
MrTopStep Levels:
MiM and Daily Recap

ES recap
The ES traded up to 5305.75 on Globex and opened Friday’s regular session at 5305.50. After the open, the ES traded up to 5307, pulled back to 5294.75 at 9:50, then shot up to a new session high of 5315.50 at 10:20. The ES pulled back to 5304.50 at 10:40, then rallied up to another new high at 5329.25 at 11:10, pulled back to 5316.25 at 11:50, rallied to a lower high of 5326.75 at 12:20 and pulled back to a higher low of 5317 at 1:00.
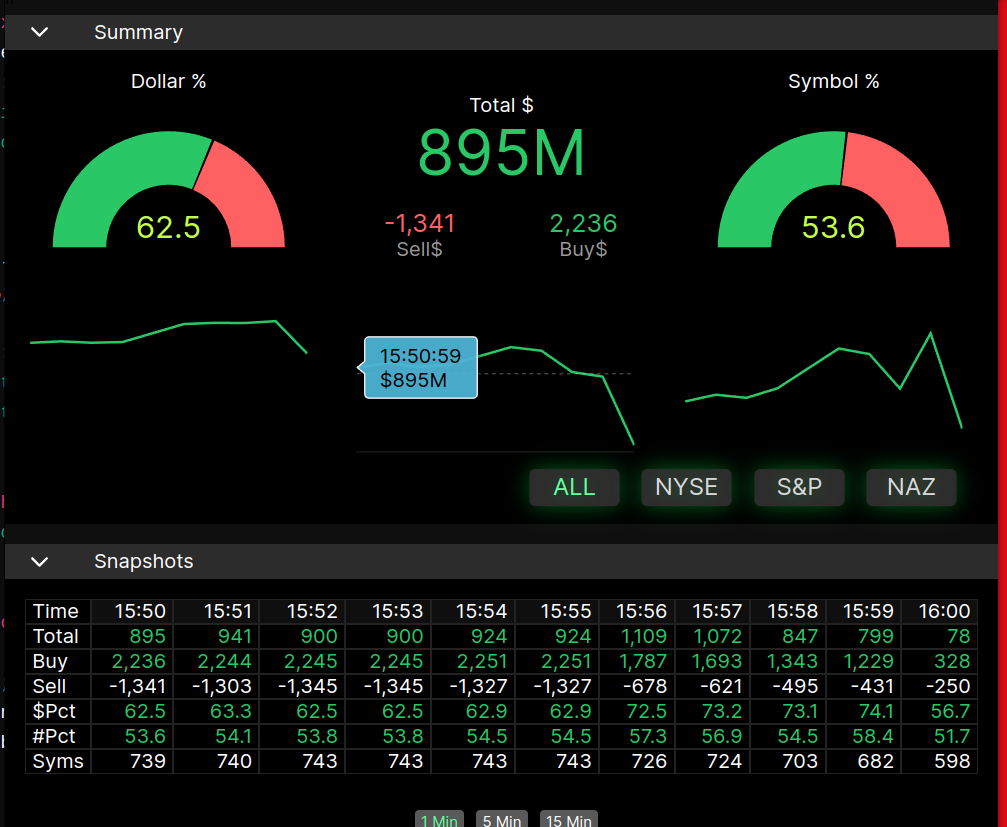
After the low, the ES rallied up to 5327.75 at 2:00 — 1.50 points below the session high — pulled back 9.50 points to 5318.50 at 2:30, had a small bounce to 5322.75 at 2:40, then rolled over and fell 13.50 points to the afternoon low of 5309.25 at 3:00. For the next half hour, the ES back-and-filled between 5314 and 5317 until popping to 5322 at 3:30 and dropped to 5314.50 just before the 3:50 MIM reading revealed $895 million to buy. The ES popped to 5322.50, traded 5321.75 at 4:00 and settled at 5320.75 at the 5:00 futures close, up 35.50 points or +0.67%, while the NQ settled at 18.770.75, up 174.50 points or +0.93%.
In the end, it was exactly like I thought it would be: drift higher and go back to the 50% retracement. In terms of the ES’s overall tone, it was firm. In terms of the ES’s overall trade, volume was decent at 1.2 million contracts traded.
Technical Edge
-
NYSE Breadth: 72% Upside Volume
-
Nasdaq Breadth: 64% Upside Volume
-
Advance/Decline: 72% Advance
-
VIX: ~12.50
Guest Post — Niels from Tradrr
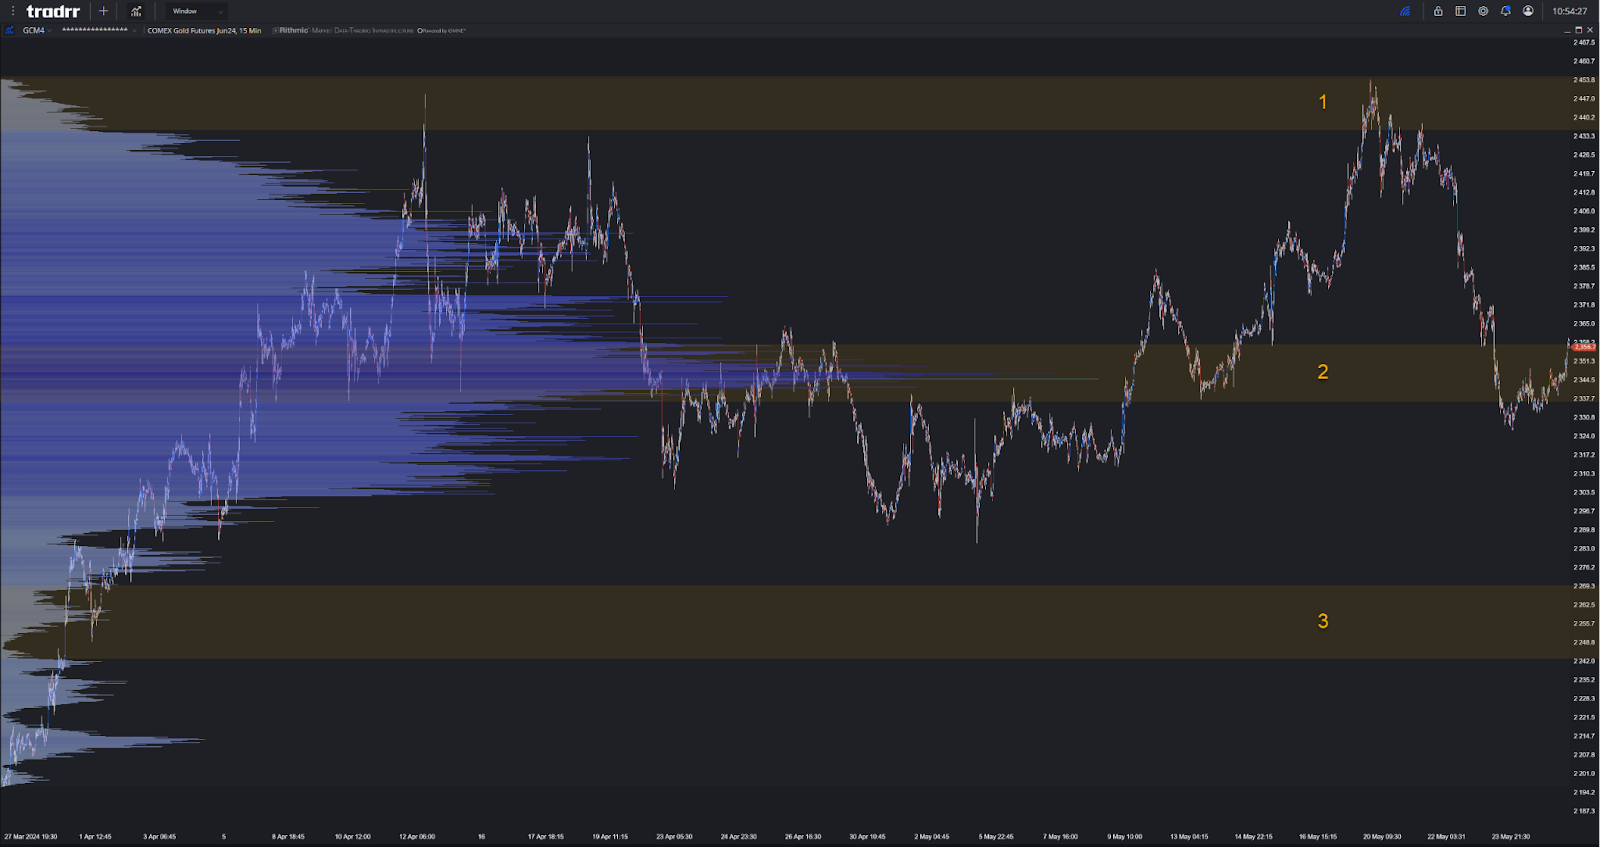
Fairly quiet week nearing month end and with many areas in the US opening up their pools rings in the advent of summer. Leaning into the technical for this week without much fundamentals for the week could maintain this balance.
-
Capped the move upwards with regard to the P profile shape placing the short term into a balance
-
Considering Balance rules Gold could be traded by either considering the POC as a pivot though ideally as a target as you begin to deviate past a certain threshold.
-
The 2nd major LVN from the edges of the bulk build of the profile places this zone as a key indicator of maintaining this P profile to build buyers to break out higher and a break of said zone could drive us lower to build out a double distribution lower on the coattails of trapped buyers.
For more info from Tradrr, please visit this link.
Economic Calendar
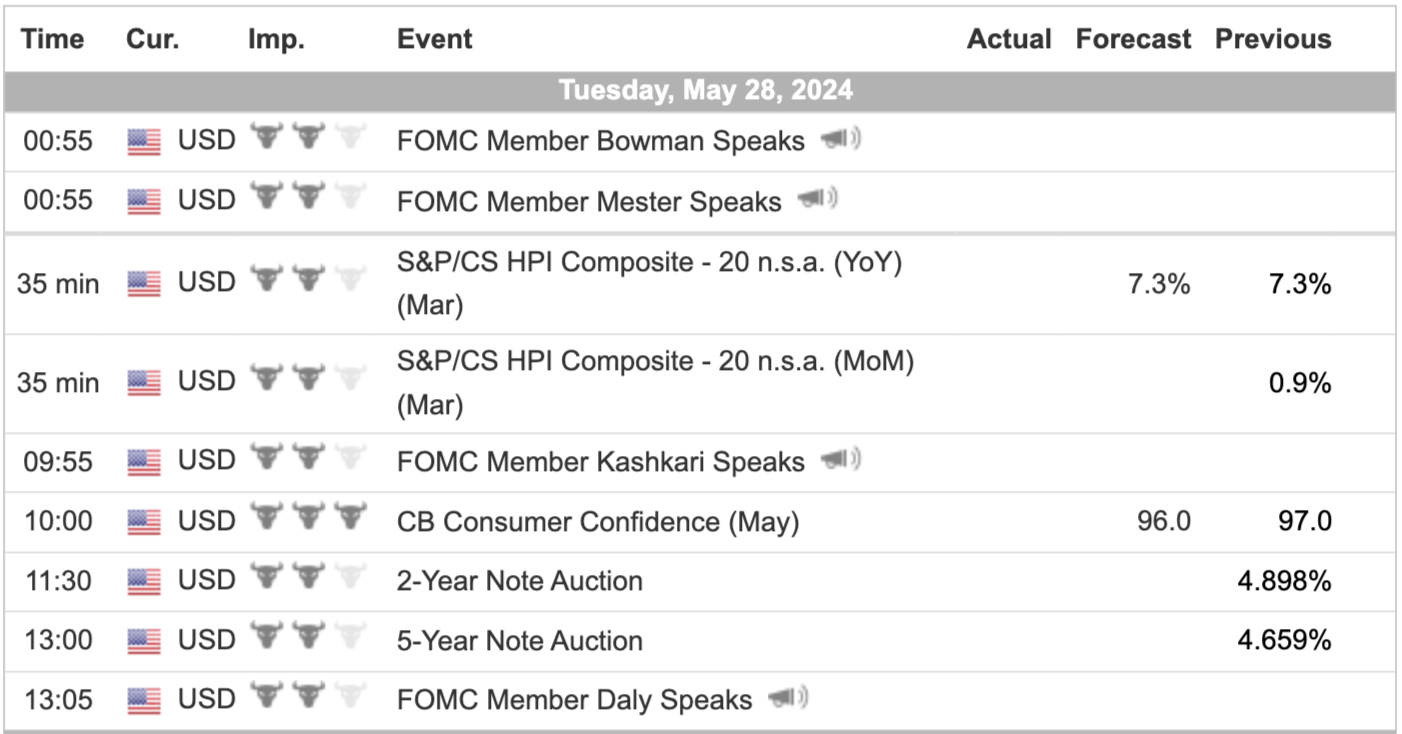
For a more complete Economic Calendar see: https://mrtopstep.com/economic-calendar/
Comments are closed