This post goes out as an email to our subscribers every day and is posted for free here around 2 PM ET. To get your real-time copy, sign up for the free or premium version here: Opening Print Subscribe.
Hormuz on the Brink, Crude on a Tear — Sell the Rips, Respect the Risk
Follow @MrTopStep on Twitter and please share if you find our work valuable!
Our View
By the time the markets opened last night, the world would get a better handle on the price of spot gold and oil prices, but this was where gold was trading yesterday:

India’s spot gold prices have surged significantly following the recent escalation involving U.S. and Israeli strikes on Iran (including the reported killing of Iran’s Supreme Leader Ayatollah Ali Khamenei), which triggered strong safe-haven demand for gold amid heightened geopolitical tensions in the Middle East.
As of March 1, domestic gold prices in India reflect sharp gains driven by international spot gold rising above $5,200–$5,300 per ounce (with some reports noting peaks near $5,299/oz or higher in recent trading).
Key Current Prices (as reported on March 1, 2026):
24-karat gold (per 10 grams): Around ₹1,62,000 to ₹1,73,000, with variations by city and source. Examples include ~₹1,73,080 (with +₹4,370 daily gain in some updates), ~₹1,62,180 in Mumbai, ~₹1,64,000+ in earlier surges, and reports of spikes up to ₹1,75,000 in Delhi amid the conflict.
22-karat gold (per 10 grams): Typically ~₹1,48,000 to ₹1,58,000 (e.g., ₹1,58,650 with gains).
Per gram examples: 24K at ~₹17,308 in some listings, reflecting the rally.
These are spot/physical market rates, closely tracking MCX futures (e.g., April gold futures around ₹1,62,000–₹1,62,100 per 10 grams, up ~1.5% recently).
The surge stems from investors flocking to gold as a safe-haven asset after the attacks, with analysts noting potential for further upside (some forecasting targets like ₹2 lakh per 10 grams if tensions worsen, alongside international gold possibly hitting $5,500+). Silver has also rallied sharply (e.g., near ₹2,95,000–₹3,00,000 per kg in spots).
Prices can vary slightly by city (e.g., higher in Delhi due to local premiums) and are influenced by global factors like USD/INR (~₹91), import duties, and market sentiment. Indian markets (including MCX) were closed over the weekend but are expected to open higher on Monday amid the ongoing risk-off mood.
For the most precise real-time quotes, check official sources like MCX, local jewelers, or platforms like Goodreturns/Moneycontrol, as rates fluctuate rapidly in this volatile environment.

Spot oil prices have surged sharply following the U.S. and Israeli strikes on Iran (including reports of the killing of Supreme Leader Ayatollah Ali Khamenei), escalating geopolitical tensions in the Middle East and raising fears of supply disruptions, particularly through the Strait of Hormuz.
As of March 1 (around midday EST, with markets reacting in real time; futures trading opened Sunday evening), crude benchmarks reflect strong risk premiums amid the ongoing conflict.
Key Current Prices (latest available closes and indicative moves):
Brent Crude (international benchmark):
Friday close (pre-escalation peak): Around $72.80–$72.87 per barrel (up ~2.9% or +$2.03 from prior, hitting 7–8 month highs near $73).
Over-the-counter/early indications post-attacks: Jumping ~10% to around $80 per barrel in some reports, with analysts expecting further upside when full trading resumes.
Spot/near-term futures: Trading in the $72.49–$73.21 range in recent updates, but poised for $5–$20+ gains if no de-escalation (e.g., targets up to $95–$110 in prolonged disruption scenarios).
WTI Crude (U.S. benchmark):
Friday close: Around $67.02–$67.29 per barrel (up ~2.8–3.19% or +$1.81–$2.08).
Indications: Similar risk-driven surge expected, potentially adding $10–$20 if Strait issues persist.
The rally stems from safe-haven flows and supply fears. Iran (a major OPEC producer) faces disruptions, and threats to close or block the Strait of Hormuz (transit for 20% of global oil) have led tankers to divert or anchor, with some attacks reported. OPEC+ responded by agreeing to modestly increase output (206,000 bpd in April) from members like Saudi Arabia and the UAE to offset potential losses, but this may not fully counter short-term shocks.
Analyst Forecasts and Scenarios:
Limited or no major disruption: Prices could stabilize or add $5–$10 on fear alone.
Prolonged Hormuz issues: Brent could spike to $80–$100+ per barrel (Barclays, RBC, and others cite $100+ risks; some warn of 1970s-style shocks).
Broader war: Even higher, with global economic impacts (higher gas prices, inflation pressures).
U.S. gasoline prices (already ~$3 per gallon average) could rise to $3.10–$3.25+ soon, with bigger jumps in vulnerable areas if crude sustains gains.
Prices are highly volatile and can shift rapidly — check live sources like CME Group, TradingEconomics, OilPrice.com, Reuters, or Yahoo Finance for real-time ticks (Asian and European markets open first, U.S. follows). The situation remains fluid, with potential for quick reversals if de-escalation occurs, but current sentiment is strongly bullish on oil due to the risk-off environment.
My guess is both continue higher, but like I said last week, this is a very fluid situation and could easily spin out of control.
Our View
Obviously, the U.S./Israel-Iran war is front and center now. Trump says it’s going to take a few weeks, but I doubt Iran will stop, and there is a big chance that the war leads to a wider response. Depending on what you read or hear on the news, Iran says it was getting closer to a deal, but I don’t think they were ever going to give up their enrichment or ballistic missile programs.
I am also convinced that by now, Russia or North Korea have already given Iran the technology to produce nuclear weapons. My concern is that I do not think Iran is going to back down, and even if there is a regime change, what will it look like, and who will be in charge?
One of the things I have always thought was crazy is that Iran is the world’s largest Shia-majority nation, with Shia Muslims making up roughly 90% to 95% of the population. With a population of 93.2 million, the Shia make up 84 to 88.5 million people, and the Sunni population is 4.6 million to 9.3 million on the high end, and the IRGC is almost entirely Shia.
Regional Religious Demographics (2026 Estimates)
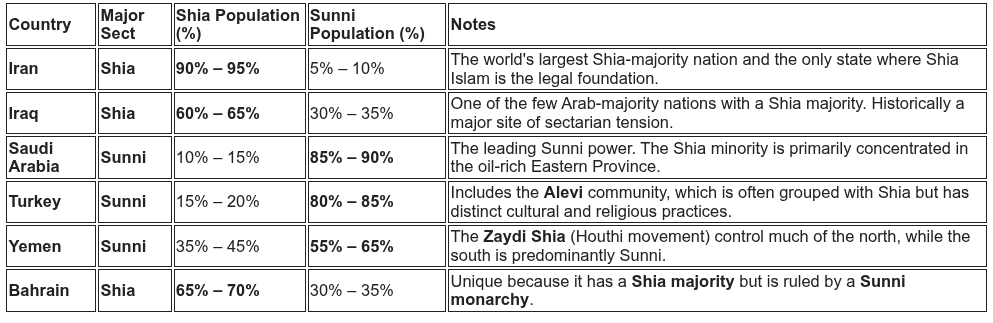
Globally, Sunnis make up about 85–90% of all Muslims. The concentration of Shia Muslims in the Middle East—particularly in Iran and Iraq—is what gives those two countries such significant influence in regional religious politics.
Our Lean
It’s Sunday at 11:15 am. I am not going to change the OP or the lean. I think there are two major concerns: 1) the war spreading to other countries in the Middle East, and 2) terror attacks in the U.S.
The PitBull was only off by a few days on when the war would break out, and I think the key to this was Marco Rubio, who has a dual role in U.S. foreign policy as both the U.S. Secretary of State and the Acting National Security Advisor. He said he would be in Israel on Monday or Tuesday, and this caught the Iranians off guard, thinking that the negotiations were still intact.
The CME raised margins on gold and silver on February 6, but they have not raised the oil margin. If volatility continues due to the ongoing U.S.-Iran standoff, the CME could issue a new Advisory Notice before the open or on the close on Monday.
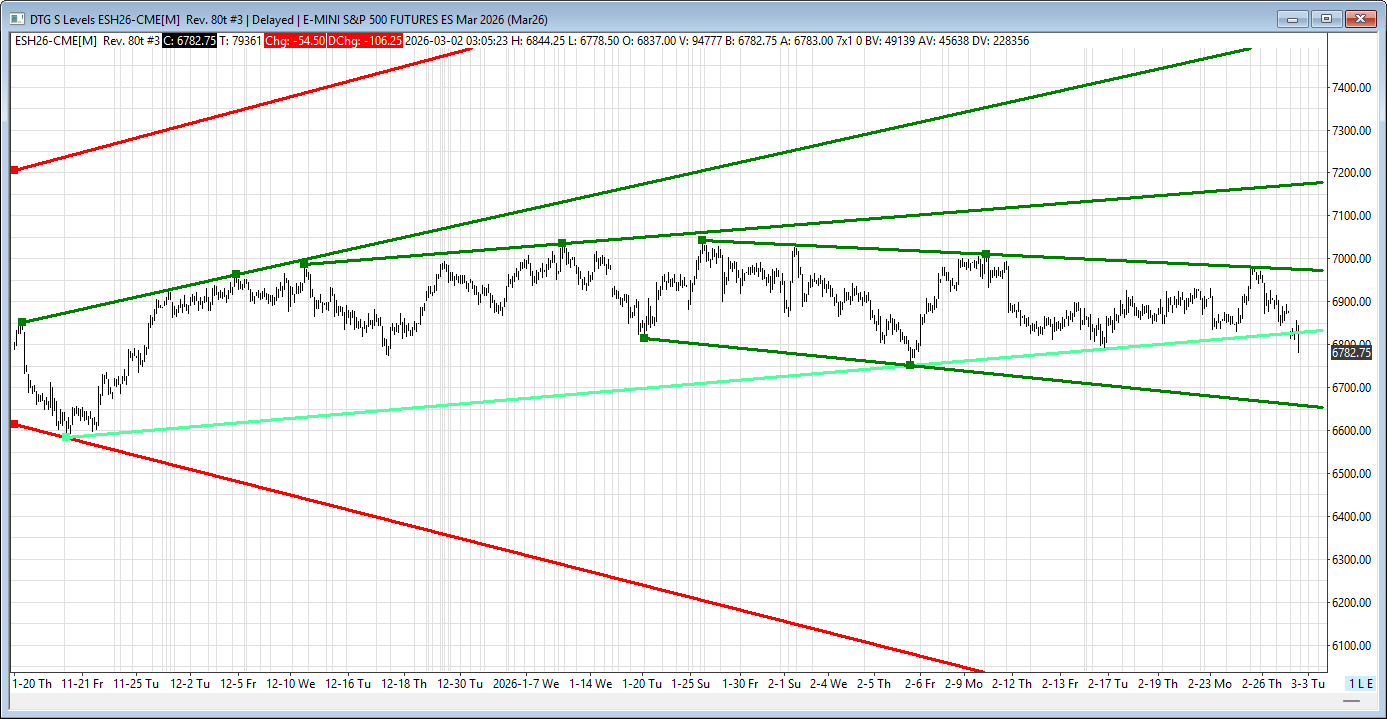
Our lean: My guess is we open down, but I can’t rule out a bounce. There are a lot of sell stops under 6790 and big resistance at the 7900–7930 level. I think you can sell the dead cat bounces.
Market Recap
It’s been one thing after another, and if it’s not war with Iran spooking the markets or NVDA dropping over 10%, it was the Producer Price Index. The producer-price index increased by 0.5% last month, after rising by 0.4% in December, dampening speculation that the Fed would cut interest rates in the near term. Economists expected a 0.3% increase. Over the last 12 months through January, wholesale prices were up 2.9%, adding to credit fears.
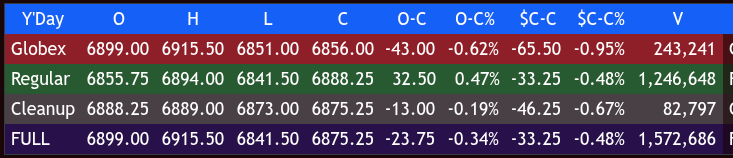
The ES, which closed on a down tick Thursday, resumed its downward price action after a headline that Iran was not going to give up nuclear ambitions, pushing the ES all the way down to 6851.00, and it traded 6855.64 on Friday’s regular session open.
After the open, the ES traded 6853.25, rallied to 6867.75, sold off down to 6841.50 at 9:40, and rallied up to 6880.00 at 10:10. It then sold off down to a higher low at 6860.75, rallied up to 6885.75 at 10:24, pulled back to 6867.25, and rallied up to a new high at 6888.25 at 11:35.
The ES pulled back to a higher low at 6870.25 at 11:45, rallied back to the high at 6888.25 at 12:05, and sold off down to 6858.00 at 12:20. It rallied up to 6876.75 at 12:35, pulled back to 6859.75 at 12:45, and rallied up to 6872.25. The ES then sold off down to 6855.75 at 1:25, rallied back up to 6875.25 at 2:05, sold off to 6855.00, and rallied up to 6886.50 at 3:20.
It traded back down to 6870.75 at 3:35 and traded 6880.00 as the 3:50 cash imbalance showed $4.7 billion to buy. The ES traded up to a new high at 6894.00 at 3:55 and traded 6888.25 on the 4:00 cash close.
After 4:00, the ES sold off down to 6873.00 and settled at 6889.00, down 31 points or -0.45%. The NQ settled at 25.004.75, down 76.25 points or -0.30%. The YM settled at 49.000, down 531 points or -1.07%, and the RTY settled at 2634.70, down 45.90 points or -1.71% on the day.
In the end, the ES and NQ were range-bound in very choppy trade and rallied late (like they usually do after being down and on an expiration Friday) as a $4.3 billion buy imbalance showed up on the 3:50 imbalance. In terms of the ES’s overall tone, it was fairly standard for what we have been seeing — range-bound. In terms of the ES’s overall trade, volume was 1.576 million contracts, in line with Thursday’s volume.
Geopolitical risks remain a negative for stocks. Crude oil (CLJ26) rallied more than +2% to a 7-month high on Friday after President Trump sounded downbeat about diplomatic talks with Iran, saying, “They cannot have nuclear weapons, and we’re not thrilled with the way they’re negotiating.” Axios reported that U.S. negotiators, Kushner and Witkoff, left Geneva disappointed by what they heard from Iranian officials in the U.S.-Iranian nuclear talks. Iran’s state media reported that Iran won’t allow enriched uranium to leave the country.
I am not surprised in any way that the U.S. and Israel attacked Iran.
Economic Calendar
MONDAY, MARCH 2
9:45 am – S&P Final U.S. Manufacturing PMI
10:00 am – ISM Manufacturing
TBA – Auto Sales
TUESDAY, MARCH 3
9:55 am – NY Fed President John Williams remarks
10:10 am – KC Fed President Jeff Schmid speaks
11:45 am – Minneapolis Fed President Neel Kashkari interview
WEDNESDAY, MARCH 4
8:15 am – ADP Employment
9:45 am – S&P Final U.S. Services PMI
10:00 am – ISM Services
2:00 pm – Fed Beige Book
THURSDAY, MARCH 5
8:30 am – Initial Jobless Claims
8:30 am – U.S. Productivity
8:30 am – Import Price Index
8:30 am – Import Price Index ex-Fuel
1:15 pm – Fed Vice Chair for Supervision Michelle Bowman speaks
7:00 pm – Chicago Fed President Austan Goolsbee speaks
FRIDAY, MARCH 6
8:30 am – U.S. Employment Report
8:30 am – Unemployment Rate
8:30 am – Hourly Wages
8:30 am – Hourly Wages YoY
10:15 am – San Francisco Fed President Mary Daly speaks
1:30 pm – Cleveland Fed President Beth Hammack speak

Guest Posts
MiM
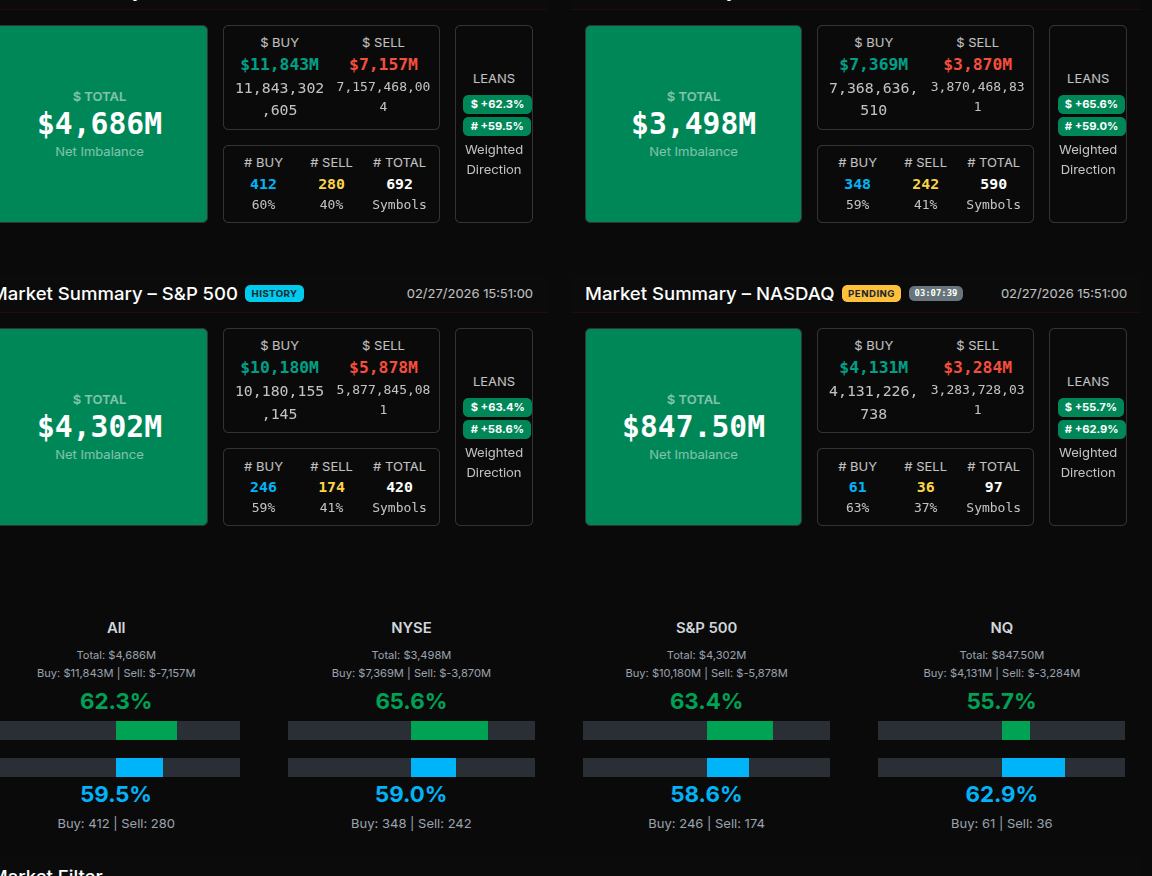
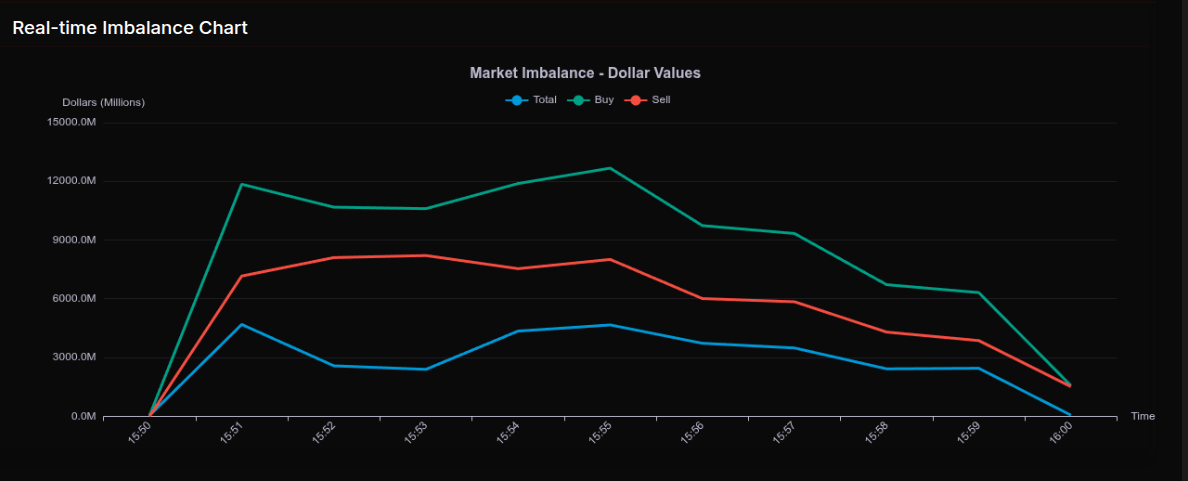
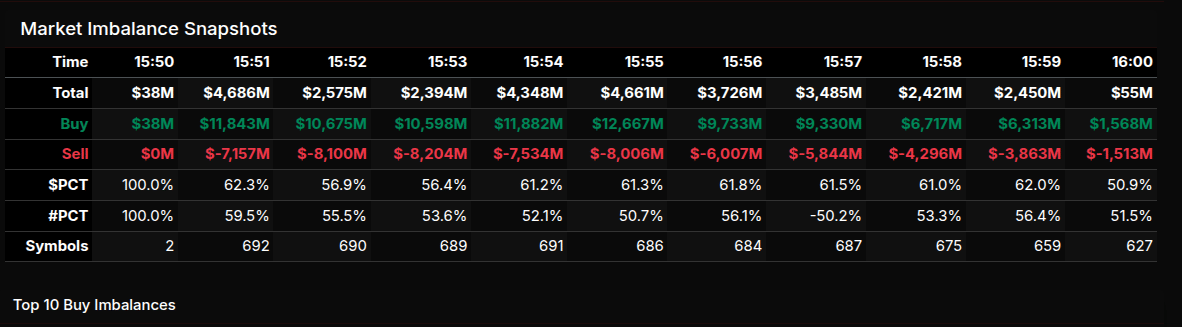
The February 27th MOC session opened with an immediate expansion in buy pressure. At 15:50, the book was essentially flat at $38M, but by 15:51, total imbalance exploded to $4.686B, driven by $11.843B in buy orders versus $7.157B for sale. The early lean registered +62.3%, firmly directional but still rotational rather than wholesale. The imbalance peaked in momentum around 15:55, with buy programs touching $12.667B while sells held near $8.006B, keeping the percentage structure consistently in the low 60s. Into the 15:58–16:00 window, both sides compressed sharply, closing with a modest $55M net and a more neutral 50.9% split, reflecting late offsetting flows.
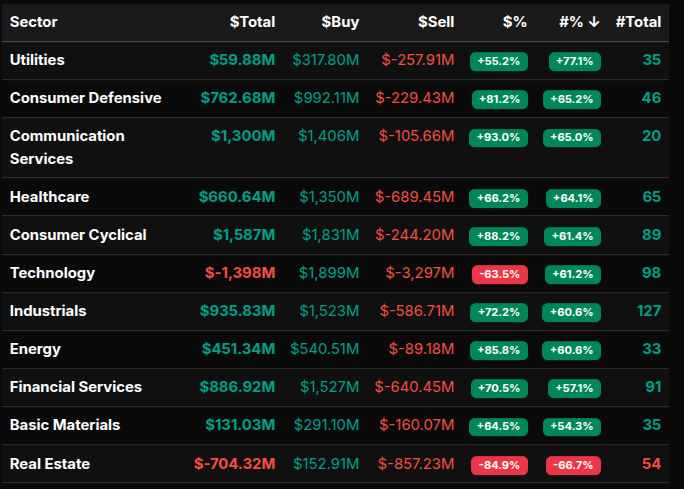
Sector rotation was aggressive. Communication Services led with a +93.0% buy lean, Consumer Cyclical printed +88.2%, Energy +85.8%, and Consumer Defensive +81.2%. These readings signal strong institutional accumulation, though not quite the >66% wholesale threshold in dollar-weighted terms across every name. Financials (+70.5%), Industrials (+72.2%), and Healthcare (+66.2%) reinforced the broad risk-on tone. Technology was the notable outlier at -63.5%, showing heavy supply, while Real Estate stood out with a -84.9% lean and -66.7% by symbol count — a clear wholesale sell imbalance and the most extreme sector reading of the session.
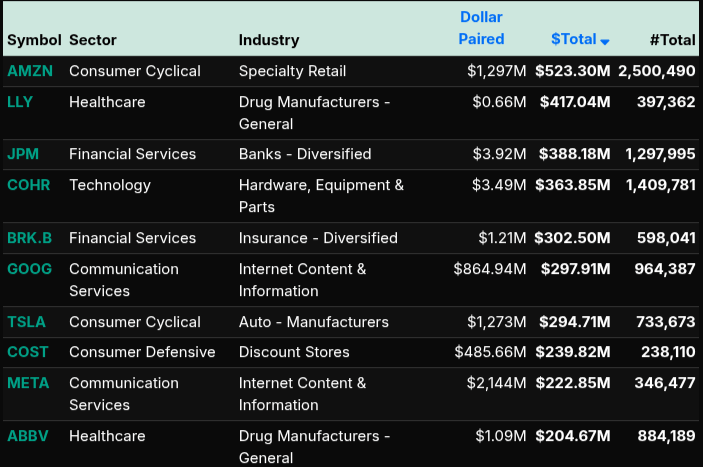
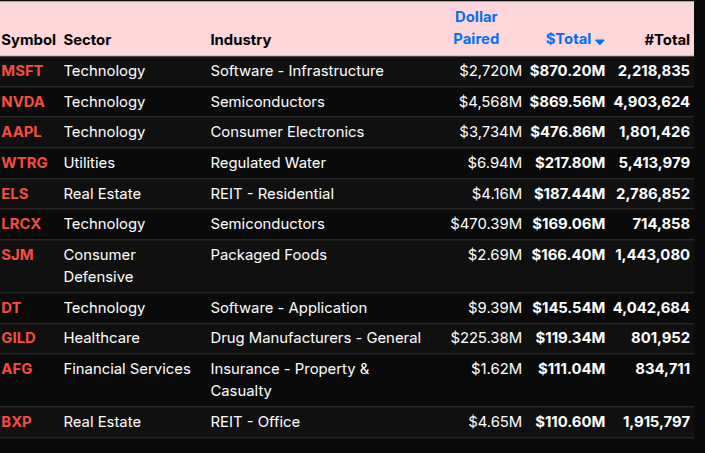
On the tape, large buy imbalances were concentrated in AMZN ($523M), LLY ($417M), JPM ($388M), COHR ($363M), and BRK.B ($302M). GOOG, TSLA, COST, META, and ABBV also showed meaningful demand. On the sell side, Technology heavyweights dominated: NVDA ($869M), MSFT ($870M), and AAPL ($476M) all carried sizable paired-off pressure. Real Estate names such as ELS and BXP added to sector weakness.
Overall, the close reflected broad index support (S&P +63.4% lean) with selective tech distribution and pronounced liquidation in Real Estate — a structurally bullish but rotational MOC.
Technical Edge
Fair Values for March 2, 2026
-
SP: 8.39
-
NQ: 35.96
-
Dow: 45.91
Daily Breadth Data 📊
For Friday, February 27, 2026
• NYSE Breadth: 45% Upside Volume
• Nasdaq Breadth: 40% Upside Volume
• Total Breadth: 42% Upside Volume
• NYSE Advance/Decline: 40% Advance
• Nasdaq Advance/Decline: 34% Advance
• Total Advance/Decline: 36% Advance
• NYSE New Highs/New Lows: 201 / 66
• Nasdaq New Highs/New Lows: 217 / 157
• NYSE TRIN: 0.84
• Nasdaq TRIN: 0.77
Weekly Breadth Data 📈
For Week Ending February 27, 2026
• NYSE Breadth: 52% Upside Volume
• Nasdaq Breadth: 55% Upside Volume
• Total Breadth: 54% Upside Volume
• NYSE Advance/Decline: 43% Advance
• Nasdaq Advance/Decline: 46% Advance
• Total Advance/Decline: 45% Advance
• NYSE New Highs/New Lows: 446 / 178
• Nasdaq New Highs/New Lows: 576 / 554
• NYSE TRIN: 0.70
• Nasdaq TRIN: 0.68

Today’s BTS Levels:
ES H
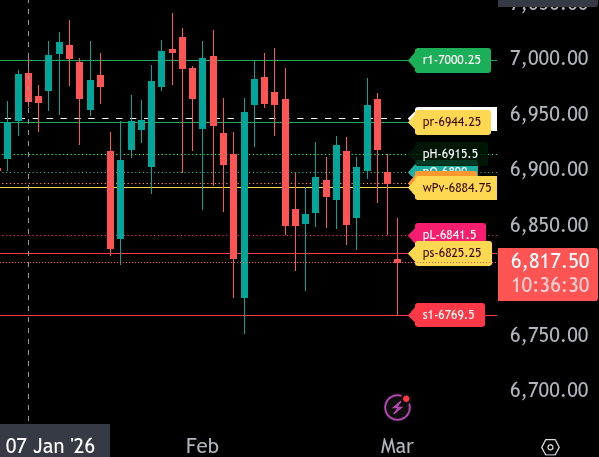
The bull/bear line for the ES is at 6884.75. This is the key pivot that defines sentiment for today. Acceptance above this level shifts momentum back to the bulls, while continued trade below it keeps pressure on the downside.
ES is currently trading around 6817.75 in the Globex session, holding well below the bull/bear line. This keeps the market in a weak posture to start the day. As long as price remains under 6884.75, rallies into resistance should be viewed as selling opportunities.
The lower intraday range target comes in at 6825.25. We are currently testing below that zone, so failure to reclaim 6825.25 opens the door for a continuation move toward 6769.50. A clean break and acceptance below 6769.50 would signal expanding downside range.
On the upside, first resistance sits at 6889.00, followed closely by 6900.00. Above that, 6915.50 is the next key resistance level. The upper intraday range target is 6944.25. If bulls can reclaim 6884.75 and hold above it, a rotation toward 6915.50 and potentially 6944.25 becomes likely. Sustained strength above 6944.25 would open the path toward 7000.25.
Overall, the tone remains bearish below 6884.75. Bulls need to reclaim and hold above this level to shift momentum. Until then, rallies are vulnerable and downside targets remain in play.
NQ H
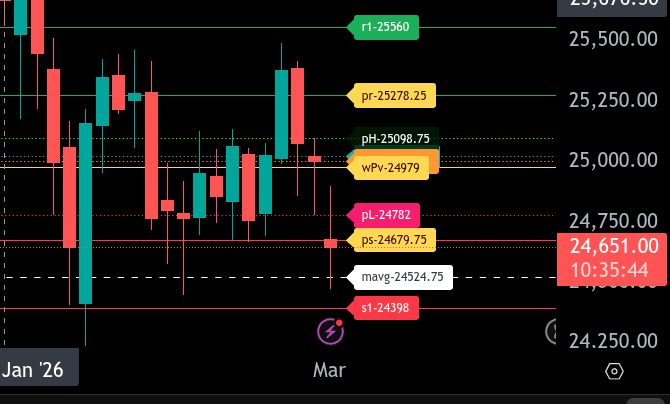
The bull/bear line for NQ is at 24979.00. This is the key level that will determine directional control for today. As long as price remains below 24979.00, sellers maintain short-term control and rallies into resistance are likely to be sold.
NQ is currently trading around 24654.00 in the Globex session, holding below the bull/bear line and now pressing beneath the lower range target at 24679.75. Sustained trade below 24679.75 opens the door for continued downside extension toward 24524.75 and then 24398.00. A failure to quickly reclaim 24679.75 keeps pressure on the downside.
On the upside, initial resistance sits at 24782.00, followed by 24979.00. A reclaim and hold above 24979.00 shifts momentum back to neutral-to-bullish and opens the path toward 25004.75 and 25024.25. Above those levels, the upper range target for today comes in at 25278.25. Acceptance above 25278.25 would signal strong bullish expansion.
For today, 24979.00 remains the pivot. Below it, rallies are selling opportunities targeting 24679.75 and potentially lower. Above it, pullbacks may find buyers targeting 25278.25. Watch for volatility around the 24679.75 zone early in the session, as it will likely dictate whether we see continuation or reversal.
Calendars
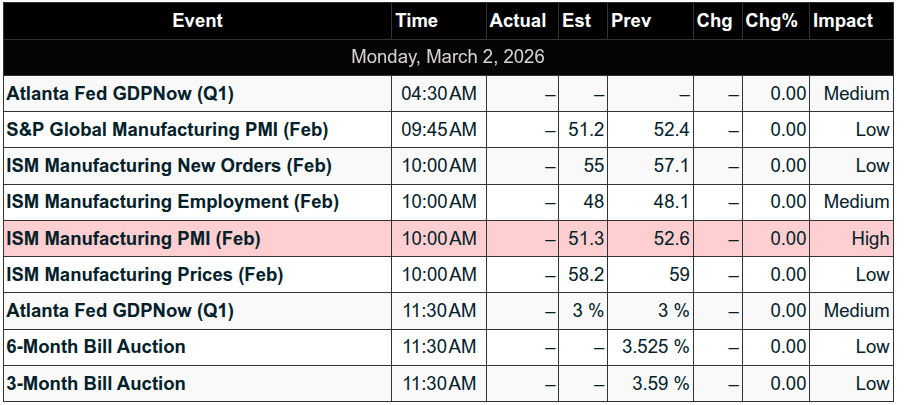
Today’s Economic Calendar
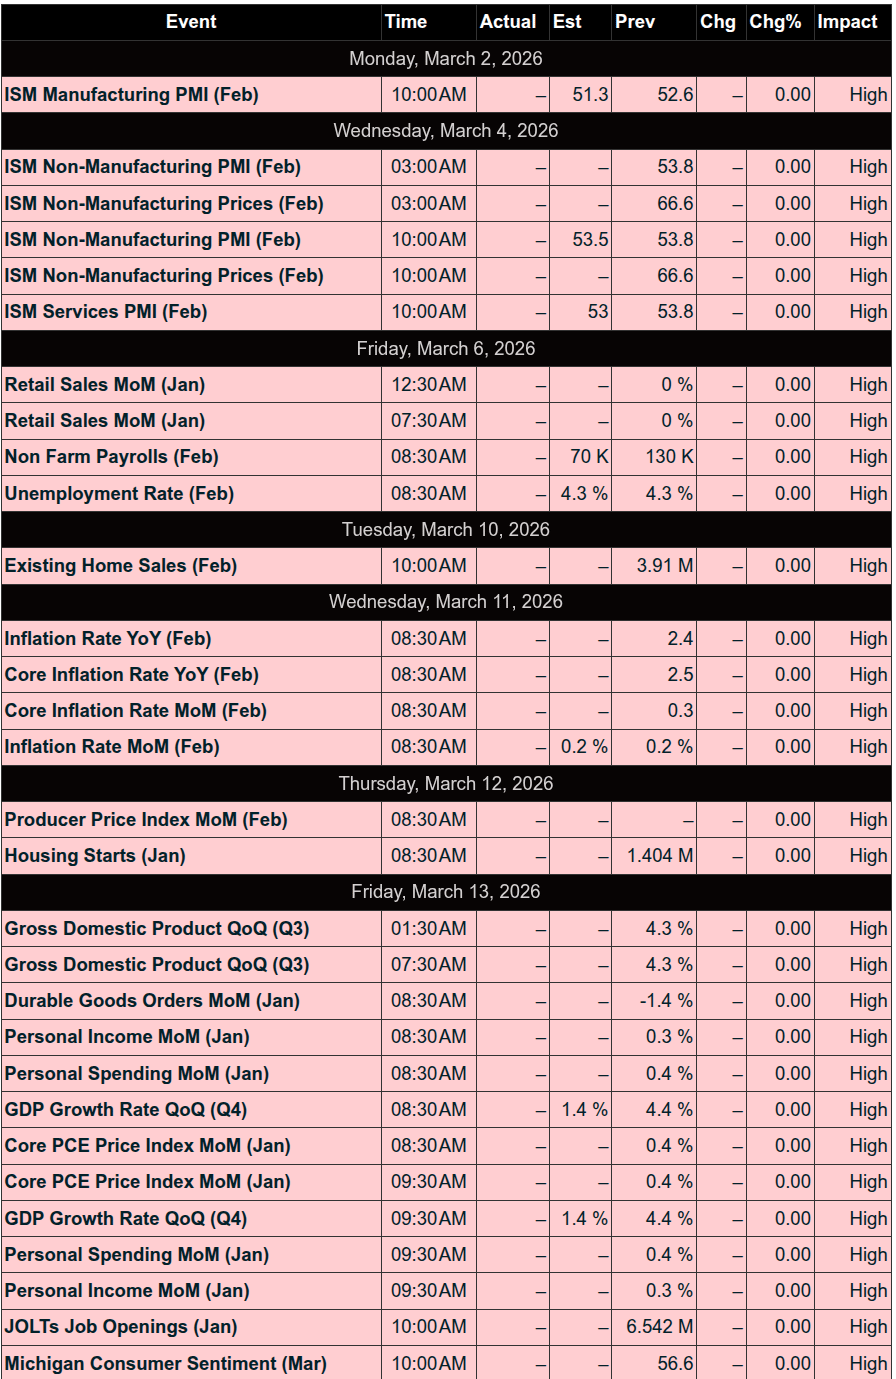
This Week’s Important Economic Events
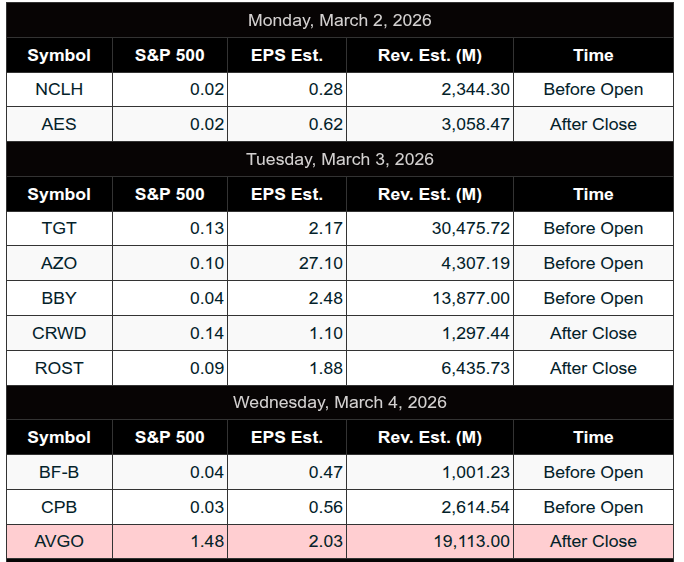
Upcoming Earnings – SP500
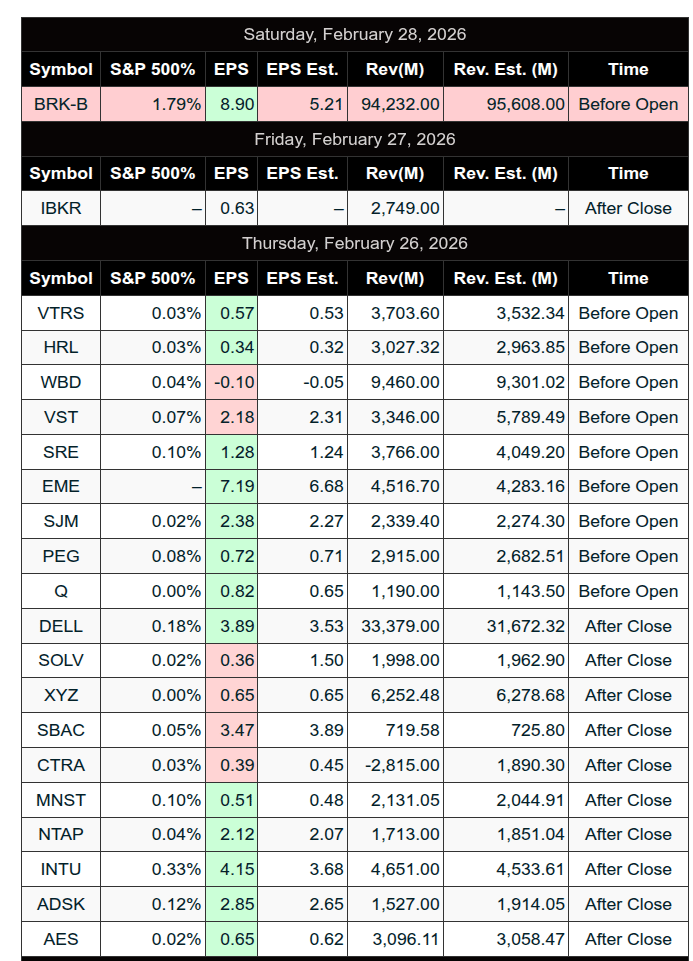
Recent Earnings
Room Summaries:
Polaris Trading Group Summary – Friday, February 27, 2026
Market Context & Plan
David identified today as Cycle Day 3 – Capital Preservation Day, which immediately framed expectations:
-
Protect gains from earlier in the cycle
-
Be selective
-
Avoid overextending
Overnight upside targets had already been fulfilled, shifting focus to whether the market would:
-
Hold above 6895 ±5 (Bull Case) for continuation toward 6905–6915
-
Or lose 6895 ±5 (Bear Case) and rotate toward 6880 → 6870 → 6860
Key references were clearly defined:
-
PVA High Edge: 6924
-
PVA Low Edge: 6882
-
Prior POC: 6919
As always, David emphasized: These are magnets and battlegrounds — manage risk there, don’t chase emotion.
Early Fulfillments & Structure
Very quickly, the lower targets were fulfilled, including the Cycle Day 3 Violation Level (6851.31). That early fulfillment reinforced the importance of:
-
Letting price come to the levels
-
Executing the plan, not reacting emotionally
-
Understanding when inventory is being reset
Once those objectives were hit, David made it clear: the major objectives were done — anything else was bonus, not necessity.
High-Quality Trades
CL Open Range Short — All Targets Fulfilled
A textbook execution. Clean setup, clean targets, full completion.
This was a strong example of:
-
Structured open-range discipline
-
No chasing
-
Defined risk, defined reward
-
Letting the trade complete its job
Members acknowledged it as a “nice trade.”
D-Level Long Opportunity & First Pullback Play
David identified a D-Level long opportunity, followed by what appeared to be a clean 1st pullback play.
This reinforced:
-
Waiting for structure
-
Using levels, not opinions
-
Trading momentum within context
There was also discussion of a potential level reclaim trade, showing members are thinking in terms of framework, not randomness.
Cycle Day 3 isn’t about hero trades. It’s about:
-
Consistency
-
Repetition
-
Capital preservation
-
Taking what the market offers
Key Takeaways
-
When key targets are fulfilled early, shift from aggressive to defensive mindset.
-
CD3 = Protect capital. Don’t force continuation.
-
Open Range trades remain a high-probability play when executed within structure.
-
Build your personal playbook — screenshots and review accelerate growth.
-
Alignment with the day type is survival.
A strong, professional Friday session.
Capital preserved. Targets hit. Lessons reinforced.
DTG Room Preview – Monday, March 2, 2026
Macro / Geopolitics
-
Primary focus: escalating U.S./Iran conflict.
-
U.S. and Israel launched strikes after Iran rejected nuclear program demands.
-
Iranian leaders have promised a strong response, raising risk of broader Middle East escalation.
-
Reports indicate Iran’s Supreme Leader was killed in a targeted strike.
-
President Trump:
-
Said bombing campaign could last 4–5 weeks.
-
Warned Iran to “lay down your arms” or face further military action.
-
Confirmed three U.S. service members have died so far.
-
-
Key questions:
-
What are the administration’s exact objectives?
-
What is the long-term plan?
-
Risk of prolonged regional entanglement remains elevated.
-
Market Reaction
-
U.S. stock futures down ~1% into the European session.
-
Oil +13% (Iran is OPEC’s 4th largest producer).
-
Gold sharply higher on flight-to-safety flows.
-
S&P 500:
-
Closed lower Friday.
-
Finished February down.
-
-
Overall tone: risk-off, headline-driven.
Corporate News
-
Amazon Web Services (AWS):
-
Service disruption at UAE data center.
-
Fire reported after unidentified objects struck facility.
-
Power shut off by fire department.
-
Unclear if incident is tied to regional conflict.
-
Amazon operates 123 data centers globally.
-
Earnings
-
Premarket: NCLH, KSPI, SATS
-
After Close: AES
-
Tuesday Morning: AZO, BBY, SEA, SHG, SNN, TGT, VIK
Economic Calendar (Today)
-
9:45am ET – S&P Global Manufacturing PMI
-
10:00am ET – ISM Manufacturing PMI
-
10:00am ET – ISM Prices
Volatility / Positioning
-
Volatility remains moderately elevated.
-
ES 5-day average range: 90.5 points (flat vs. Friday).
-
No clear “whale” bias overnight.
-
Large trader flow mixed.
-
Some buying into the selloff.
-
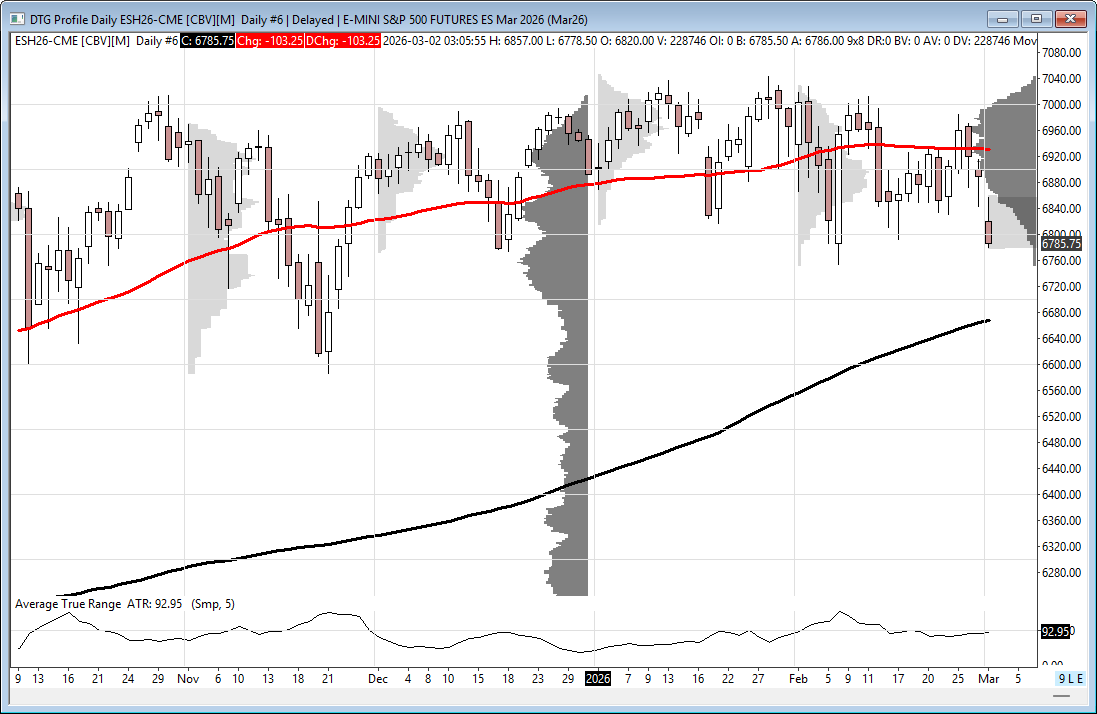
Technical Outlook – ES Futures
-
ES remains in a 4-month sideways consolidation under all-time highs.
-
Closed below 50-day MA (6931) for 2nd straight session:
-
Short-term bearish signal.
-
50-day MA now loose resistance.
-
-
Broke intermediate-term uptrend channel bottom.
-
Opens downside toward short-term downtrend channel bottom.
-
Key Levels
-
Resistance (TL Rs):
-
6826/29s (former channel support)
-
6975/70s
-
7175/80s
-
-
Support (TL Ss):
-
6652/47s
-
Markets remain highly sensitive to geopolitical headlines, with technical damage increasing short-term downside risk.
Affiliate Disclosure: This newsletter may contain affiliate links, which means we may earn a commission if you click through and make a purchase. This comes at no additional cost to you and helps us continue providing valuable content. We only recommend products or services we genuinely believe in. Thank you for your support!
Disclaimer: Charts and analysis are for discussion and education purposes only. I am not a financial advisor, do not give financial advice and am not recommending the buying or selling of any security.
Remember: Not all setups will trigger. Not all setups will be profitable. Not all setups should be taken. These are simply the setups that I have put together for years on my own and what I watch as part of my own “game plan” coming into each day. Good luck!
This post goes out as an email to our subscribers every day and is posted for free here around 2 PM ET. To get your real-time copy, sign up for the free or premium version here: Opening Print Subscribe.
Comments are closed