The S&P can run, but it can’t hide.
Our View
Everyone from the PitBull to several in my trading crew think the ES has more upside. I can’t argue with that, but I fear it will end like all the rest of the rallies: new lows.
There is a topic very few want to talk about and it’s inflation cycles vs. the S&P. In the 70s when inflation jumped and gas was being rationed, the markets had bounces, but they didn’t recover right away. In fact, I call it the lost decade. After the decade was completed, the S&P was only up about 10%.
I’m not saying that that will be the case now necessarily, but these inflation cycles can be tough to beat. Additionally, the Fed seems desperate. The odds of a 1% increase is 35%, which is actually down quite a bit after some Fed members talked the markets down last week. The likelihood now sits at a 75 bps hike. I am not even sure a 1% interest rate hike would do any good until the Fed faces the music and starts reducing its balance sheet in a meaningful way. It seems to be a vicious cycle that is just in the beginning.
To summarize, I think there are too many negatives for the markets to keep going up. It’s the middle of July, volumes are lower and dead-cat bounces are fully expected. Ride it while you can but don’t fall in love.
The week is going to be busy after a string of mixed bank earnings. Goldman Sachs (GS) and Bank of America (BAC) are set to report on Monday, with Netflix (NFLX) on Tuesday, Tesla (TSLA) on Wednesday, AT&T (T) on Thursday, and American Express (AXP) and Verizon (VZ) on Friday. On the economic front, Existing Home sales on Wednesday, Initial Jobless Claims on Thursday and Manufacturing PMI on Friday.
Our Lean
The ES is trading 3900+ on Globex now. I had resistance at 3890, followed by 3922 and 3960. Finally, a key level sits up at 4010. On the downside, minor support sits at 3850, then 3935 and 3820.
Our lean is to sell the early rallies and buy the pullbacks using tight sell stops.
Daily Recap
The ES traded down to 3780.25 on Globex and opened Friday’s regular session at 3841.25. After the open, the ES traded up to 3848 and then dropped down to the VWAP 3819.75 at 9:55. 5 minutes later it traded all the way up to 3854.50.
After the rip, the ES pulled back to 3834.75 at 10:06 and then ripped ~24 points up to 3858.25 at 10:33. After the high, the ES pulled back to the 3843.50 level and stutter-stepped its way up to 3863.50 at 11:17. The ES double-topped at 3863.50 at 11:49 and then dropped down to 3847 at 12:41. After the pullback, the ES climbed back up to 3862.25 at 1:34, pulled back down to 3852.00 and then traded in a 6 to 10 point range until the ES sold off down to 3850.75 at 3:35.
From there, it traded up to 3858.75 as the early MIM showed $780 million to sell. The ES traded 3853.50 as the 3:50 cash imbalance showed $772 million to sell, traded down to 3850.25, and then quickly ran up to 3867 at 3:59 and traded 3865.50 on the 4:00 cash close.
The ES settled at 3866.75 on the 5:00 futures close, up 73 points or +1.94% on the day.
In the end the ES put on quite a performance with all of its 20- and 40-point rips. In terms of the ES’s overall tone, it was firm but most of the buying was tied to the short premium accounts rolling up or getting out. In terms of the ES’s overall trade, volume was steady but not large at 1.44 million contracts traded.
- Daily Range: 88 points
- H: 3868.25
- L: 3780.25
Technical Edge
- NYSE Breadth: 88% Upside Volume (!)
- NASDAQ Breadth: 75% Upside Volume
- VIX: ~$24.50
Game Plan: S&P 500, Nasdaq, Semis, ARKK, AAPL
I was talking with a trading friend recently and he was asking questions about the market; Supply zones, trends, etc.
I told him that it boiled down to a really simple concept: Acceptance or rejection. I tweeted about it the day after we spoke:
That’s really what it comes down to… is price being accepted at a new level or is it being rejected?
We can see it unfolding in the S&P.
Notice how price was rejected (on the downside) at 3740 as bulls continued to defend that level. No amount of complicated technical analysis is needed to make that observation.
After struggling with 3800 to 3810 in the prior two sessions, there was price acceptance above this level on Friday.
S&P 500 — ES

Now we come into a very key area: 3900 to 3950 — will it accept or reject the ES?
The last three weeks’ worth of highs are as follows: 3900.75, 3922 and 3950. The 50-day moving average — which hasn’t been touched since April — is at 3928, while the 10-week moving average is 3942 and most recently acted as stout resistance in early June.
If the ES can clear 3950 and stay above it, it could open the door to the 3985 to 4000 area.
On the downside, keep an eye on 3865 to 3870. That encompasses Friday’s high and the Globex low. If we lose these levels, the 10-day is in play near 3850.
S&P 500 — SPY
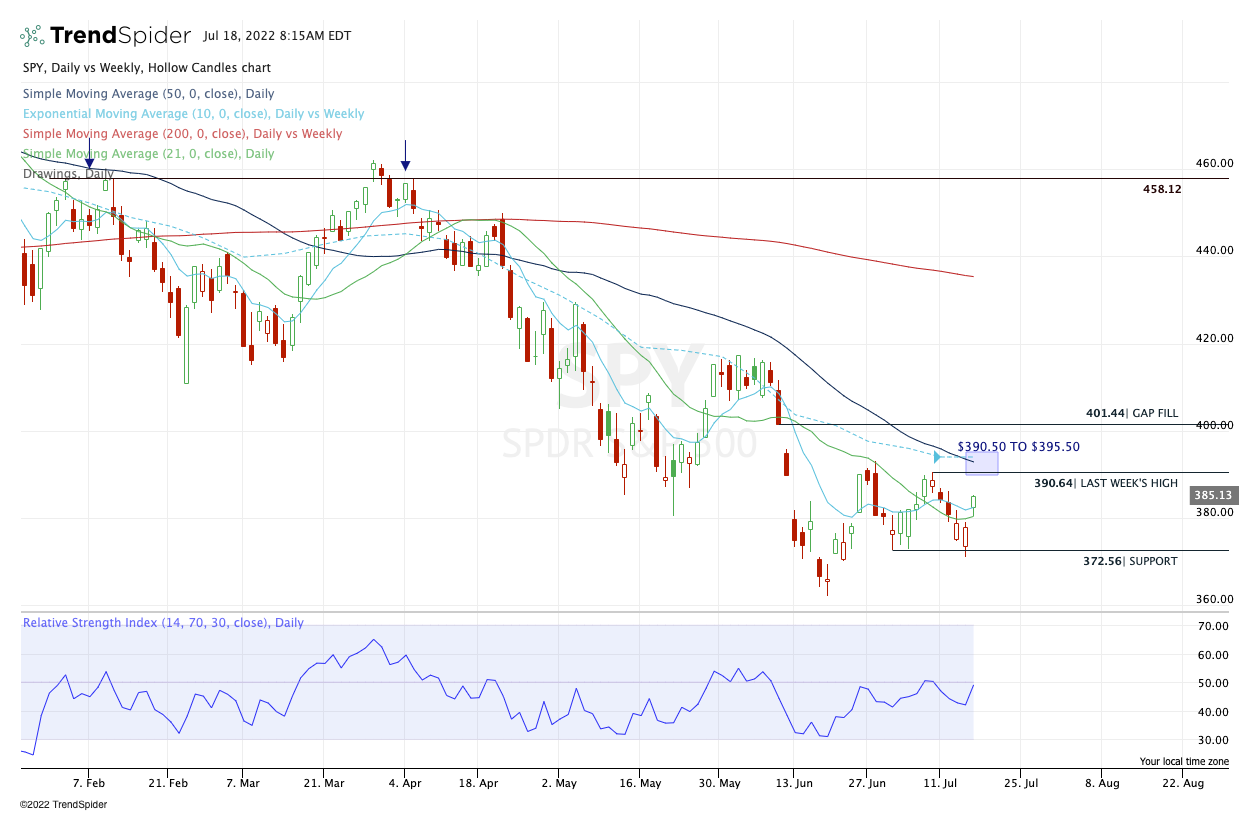
On Friday, we outlined the “simple” course for the SPY: “$380.50 to $382 is the area to clear on the upside…Above that zone and $390 to $393 is in play.”
Set to gap into the $389-ish area this morning, I am curious to see if we get price acceptance or rejection in the $390.50 to $395.50 zone.
On the downsie, I want to see the SPY stay above $380. Below puts $372 to $374 back in play.
Nasdaq — NQ

I know we’re coming into Monday hot and bulls are feeling good, but this 12,150 to 12,250 zone has been a cement wall for a month now. If it breaks it, 12,500 to 12,550 is in play.
If it’s resistance though, bulls need to see support at 12K. Back below 12K and the 11,750 to 11,825 zone is key.
Nasdaq — QQQ

$296.50 is now the 3x weekly-up level to watch. Also near that zone is the 50-day and 10-week moving averages, with the latter serving as active resistance.
Above this zone puts $303 in play, then $310+
$296.50 could be a tough area. It is reasonable for sellers to keep trying to work this area until it fails.
SMH

Semis are a key driver in tech, but keep an eye on the $220 level as SMH gaps up this morning.
This was a prior support area turned into resistance. It’s also where the 10-week moving average is.
Like the QQQ, this would be a reasonable “sell spot” — at least upon the initial test. And it comes at a reasonable R/R zone, because if it breaks out, shorts know right away that they are wrong.
ARKK

Above is a weekly chart of the infamous ARKK. $46 has been stiff resistance, but ARKK is riding uptrend support and has a double bottom near $35.
Keep an eye on $46. Over it could open the door to $48, then $52.
$46 may continue acting as resistance, but that’s a lot of grinding against this level now.
AAPL

Set to gap up over Friday’s high, be careful with Apple.
Like the others, it’s possible we see a gap-and-go to the upside, but it’s also possible that we see a “sale” off the open.
It’s also in a good R/R spot for shorts, as they’ll know quickly if they’re wrong, and as the AAPL sits on a key area on the chart (June high, Q1 low, etc.).
If Apple gaps above Friday’s high of $150.86 and quickly trades back below it, it could be a good cash-flow short against the high of day.
Go-To Watchlist — Individual Stocks
*Feel free to build your own trades off these relative strength leaders*
- Numbered are the ones I’m watching most closely.
- Bold are the trades with recent updates.
- Italics show means the trade is closed.
Trade Sheets: DLTR traded well yesterday.
- MCK — We have hit two trim zones so far on MCK. Feel free to cash the last ⅓ of the position as you see fit. $335 to $340 is a potential upside target if it continues higher. Moving stop-loss up to $315
- $335 hit on Monday, up to you on how to manage from here. I’m holding the last ⅓ against a profitable stop-loss.
- DG — Maybe this is the wrong move, but with DLTR also in our pocket, I am going to cash the remaining ⅓ position in DG at the open. ||| This was not the wrong move after DG’s painful reversal on Friday. Position closed!
- MRK — Target No. 3 Hit on Friday’s push, now down to ¼ of a position and looking for $100 and riding against a $92 stop (profitable vs. our basis).
- DLTR — Hit our second target of “$169.50 to $170+”
- Down to ⅓ position and looking for $175 to $177 as our final target. Riding against a stop-loss at $162.50. More conservative traders who want to guarantee a profit can ride against a $165 stop.
Relative strength leaders (List is cleaned up and shorter!) →
- DLTR
- MRK
- COST
- PEP
- ABBV
- UNH
- JNJ
- XLE
- VRTX
- DG
- IBM
- MCK
Economic Calendar

As we all know, there’s no crystal ball when it comes to trading stocks, options, or futures. But the Market Imbalance Meter may be as close as it comes. Knowing how the “Big Money” is placing its bets can give our trading room a big wave to ride — or a warning sign to stay out of the water. Come check it out now, risk-free for 30 days.
Comments are closed