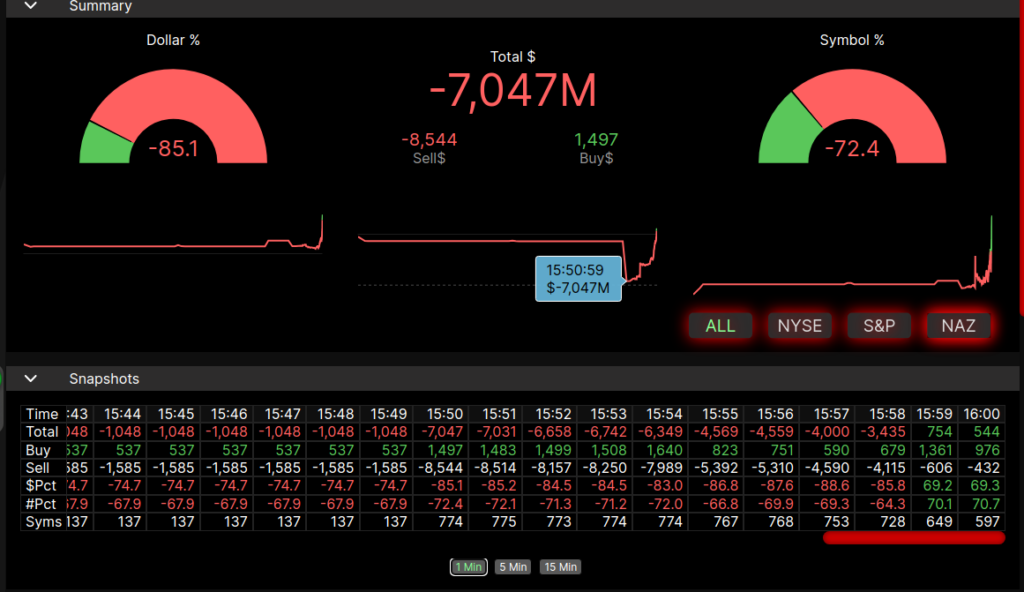
The Market on Close (MOC) represents both the opening and closing auctions on the Nasdaq and the NYSE.
There is an easy-to-read meter on both sides displaying what we call the top number, which is the Total Dollar (Total$) imbalance. This number represents the difference between the total value of all shares on the sell side.
Top Line Number:
The MOC top-line number displays both the sell side and the buy side for all the imbalances we track. The total $ represents the difference between the two and is the number publicly called out as the imbalance.

Symbol Meter:

The symbol meter displays the percentage of symbols stacked on the sell vs. the buy side. The more aligned the symbols are, the more the market is being pushed in a particular direction.
Dollar Meter:
The dollar meter instantly shows you how much of all the dollars in the imbalance calculation are on the sell side.

Snapshots:
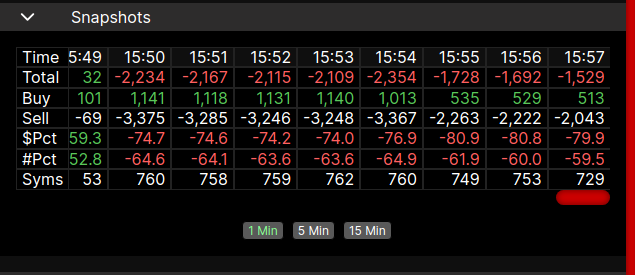
Snapshots are data captured during the live progression of the MiM data allowing a user to watch the progression of the closing or opening process.
Top/Bottom 10 Symbols

Reviewing the top and bottom 10 symbols for dollar imbalance helps to better understand what is being sold and bought at the close.
Sectors:
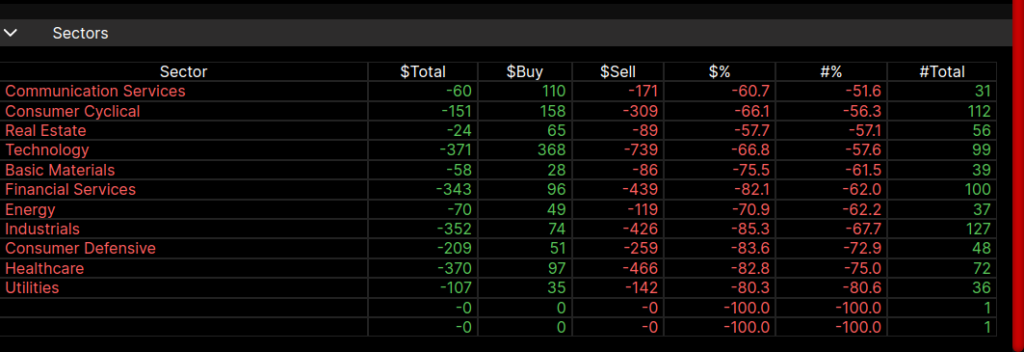
Sector information is crucial for identifying rotations within the market, as it provides insights into which sectors are experiencing increased buying activity and which ones are not. By analyzing sector data, traders and investors can discern trends in market sentiment and understand where capital flows are directed. This understanding allows them to make more informed decisions about portfolio allocation and trading strategies. Additionally, sector analysis can reveal shifts in market leadership and help anticipate broader market movements. Therefore, incorporating sector information into market analysis provides a comprehensive view of market dynamics and enhances decision-making processes.
Comments are closed