This post goes out as an email to our subscribers every day and is posted for free here around 2 PM ET. To get your real-time copy, sign up for the free or premium version here: Opening Print Subscribe.
I’m Still Leaning Long and Working the Drops
Follow @MrTopStep on Twitter and please share if you find our work valuable!
Our View
I laid out most of the trouble spots for the ES and NQ yesterday, but a sharp rotation out of the “Magnificent Seven” tech stocks has intensified the pressure. Nvidia was down 3.57%, Super Micro Computer dropped 7%, and Palantir fell 6.5%.
It’s not just the Mag 7 that’s getting hit. Despite the strong rally since early April, several big names remain down significantly on the year:
-
Tesla (TSLA) has been the worst performer among big tech, down roughly 38% YTD, hammered by slowing EV demand, intense competition from China, and margin pressure exacerbated by tariff concerns.
-
Nvidia (NVDA) is next, off 11.8–14.5% for the year, still feeling the aftershock of its historic $593 billion single-day market-cap wipeout in January (triggered by fears over China’s DeepSeek AI model) and renewed selling in November.
-
Apple (AAPL), Alphabet (GOOGL), Amazon (AMZN), and Microsoft (MSFT) are each down 7–15% amid a broader Magnificent 7 correction driven by tariff-related supply chain fears, sluggish iPhone upgrades, advertising and antitrust headwinds, slowing AWS growth, and growing skepticism about the payoff from massive AI capex.
-
Outside the core seven, AMD, Oracle, and Super Micro Computer have recently shed 8.8–23%.
Look, I could be totally wrong, but I think there is a possibility that the last two weeks of November are up. At some point, the markets will exhaust themselves, and they will go back up. The PitBull said he has seen this before: a weak November, then a hard rally in the first week of December into the end of the year.
Our Lean
The markets are spooked by the deluge of data that they have to play catch-up on. As of November 17, the probability of a 25 basis point (0.25%) rate cut at the Federal Reserve’s December 10 FOMC meeting stands at 41–44%, according to the CME FedWatch Tool—but I saw something that said it dropped to 33%.
The other thing is, on Thursday, they release the September jobs number and NVDA reports after the close. I doubt volatility will fall much this week. I’ve been money on my longs and I’m long again, I’m missing some good short sales, but I’m sticking to my game plan.
Our lean: If the ES gaps higher today, it’s my guess you can sell the open or the early rallies and buy the drops. If the ES takes out yesterday’s lows, I may reassess.
Guest Post: Tom Incorvia – Blue Tree Strategies
Over the past month, price action in the SPY has remained broadly balanced, reflecting a market that is inherently indecisive. Upward moves have consistently encountered supply, while pullbacks have been supported by steady demand. This equilibrium highlights the ongoing tension between the tailwind of a potential easing interest-rate cycle and the headwind of elevated equity valuations.
Such an environment can be challenging for less experienced market participants. However, seasoned traders recognize the significance of identifying zones of excess supply and demand. Understanding the market’s underlying “personality”—the behavioral tendencies expressed through price reactions at key levels—provides valuable insight into directional intent and, ultimately, improves trade selection.
Patience remains critical. Allowing price to revisit and react to prior areas of buying or selling pressure enables quicker recognition of invalidated theses and more effective risk management. For experienced traders, disciplined trade management—not prediction—continues to be central to achieving consistent profitability.
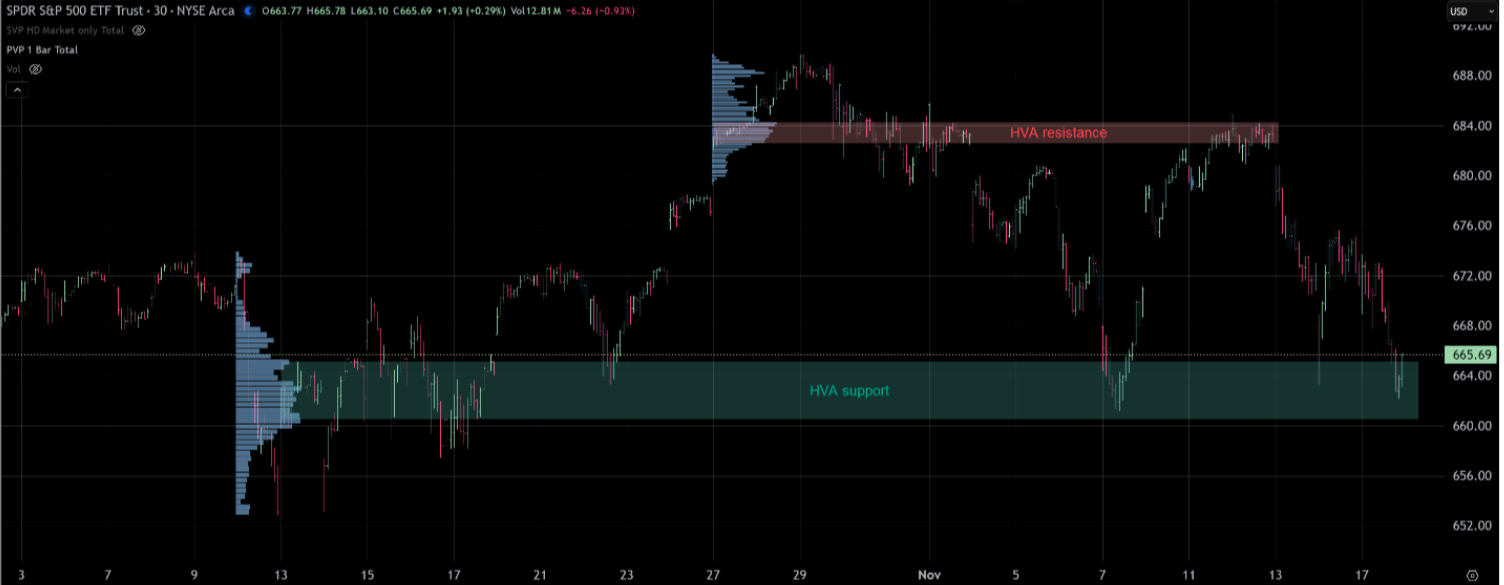
The recent behavior of the SPY illustrates how supply and demand dynamics govern price action in a balanced market. The High-Volume Area (HVA) established in October has repeatedly acted as a support zone, providing a reliable base during periods of weakness. Conversely, an HVA of supply near the 684 level has served as a notable resistance area. This supply zone, highlighted in red, has consistently rejected upward price tests and exerted downward pressure when challenged.
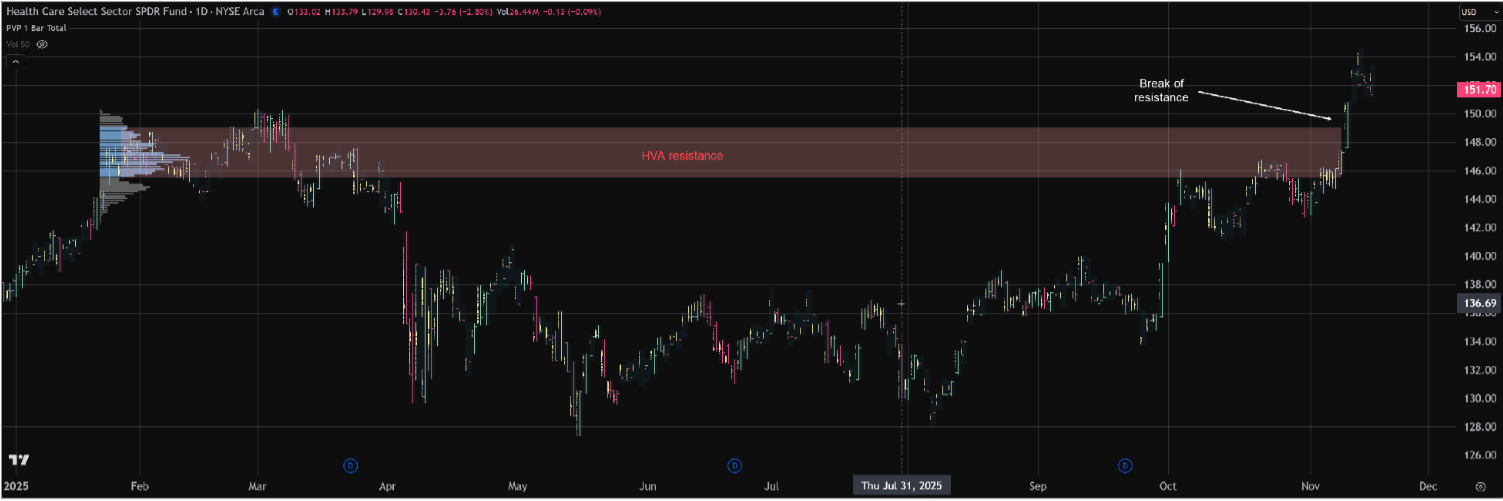
The Health Care sector (XLV) provides an example of price action that is decisively unbalanced. A balanced zone formed during February and March ultimately transitioned into an area of excess supply. This supply region was tested twice in October and again earlier this month, each time capping upward momentum.
Last week, however, price finally broke through this supply zone, and trading has consolidated sideways over the past several sessions. This type of post-break consolidation is typical, as markets often pause before re-establishing the prevailing bullish trend. Any indication of strengthening demand could signal the potential for another swing high in the near term.
Tom Incorvia began his career in financial services in 1987 and has amassed over three decades of experience navigating the complexities of the markets. His career spans both the buy-side and sell-side of the trading desks, having served as Vice President of Equity Trading and later as General Partner of a hedge fund. This dual perspective has provided him with a unique and well-rounded understanding of market behavior.
You can purchase Tom’s Course on Volume Profile here.
Market Recap

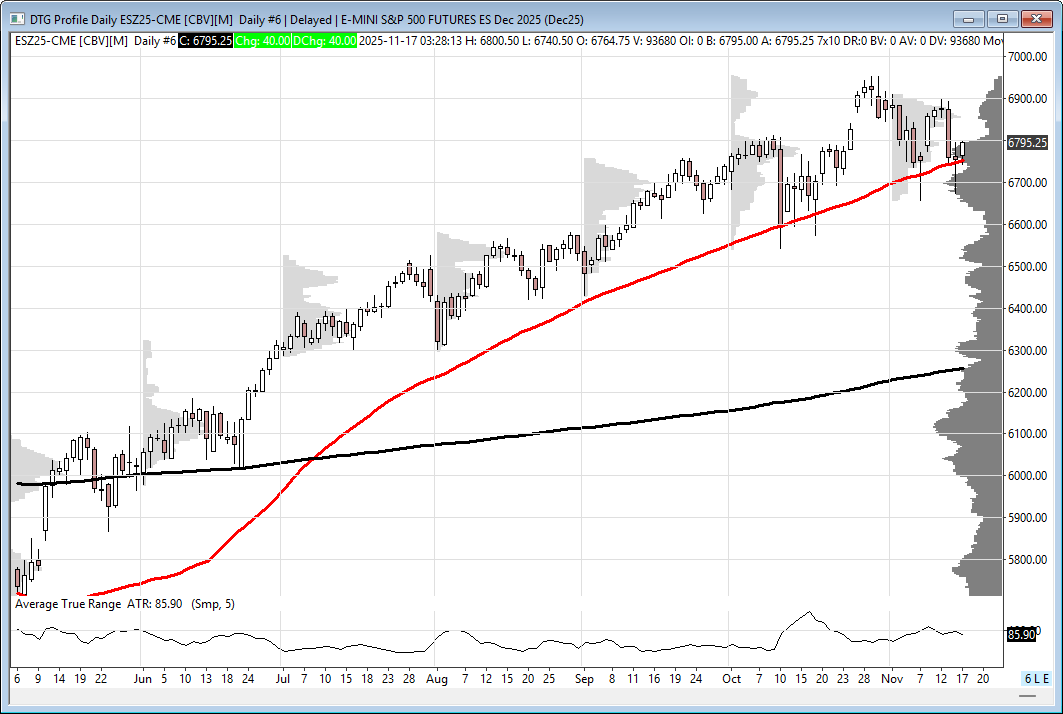
In yesterday’s OP, I listed several of what I call stock market uncertainties, but that was before the ES rallied all the way up to 6801.50 on Globex, sold off, opened at 6734.25, then sold off to 6714.75 at 11:20 a.m. It then rallied up to 6767.75 at 12:00. I could list all the rips and dips, but you can see for yourself—just looking at the Globex high and the early day session low—it was clear things were going to get volatile.
After trading up to the high, the ES made a series of lower highs and traded down to the 6717.50 area at 1:39, then fell all the way down to 6658.00 at 3:00. After that low, the ES rallied up to 6677.00 at 3:15, traded up to 6679.50 at 3:30, traded down to 6687.50 at 3:58, and traded 6686.00 as the 3:50 cash imbalance showed $1.3 and went out to $3.2 billion to buy. It traded up to 6793.25, sold off down to 6680.50 at 3:54, popped to 6794.75, and traded 6693.75 on the 4:00 cash close.
After 4:00, the ES traded up to 6701.00 and settled at 6692.00, down -63.25 points or -0.94%. The NQ settled at 24,879.00, down 215 points or -0.85% on the day.
In the end, it’s like I said in the MTS chat: all the failed rallies have taken their toll on the ES and NQ. In terms of the ES’s tone, it’s totally captive to whatever the NQ is doing. In terms of the ES’s overall trade, volume was lower at 1.825 million contracts traded.
The ES came off a five-day winning streak and has now been down three days in a row for a loss of 183.75 points or -2.65%. The last time we saw four down sessions in a row was from 8/15/25 to 8/21/25, and the last five-day decline was from 12/26/24 to 01/02/25. The ES has been a different animal compared to the NQ. The last three-day decline was from 09/23/25 to 09/25/25, and the last five-day decline was also from 08/15/25 to 08/21/25. There was another five-day decline a few days earlier, but the last four-day decline came on 05/20/25 to 05/23/25. What does this tell us? The ES doesn’t see many four- or five-day declines, and I do not see any six-day declines in 2025.
The NQ has closed lower five sessions in a row for a total loss of 839.50 points or -.3.8%. The last comparable decline was the six-session selloff from 08/14/25 to 08/21/25. Before that, the last five-day decline was all the way back from 03/26/25 to 03/31/25. I’ve seen several three- and four-day declines this year, but not many.
I think the moral of the story is that when you start to see the NQ down five or six days in a row—it just doesn’t happen very often.
MiM
Market-on-Close Recap – Monday, November 17, 2025
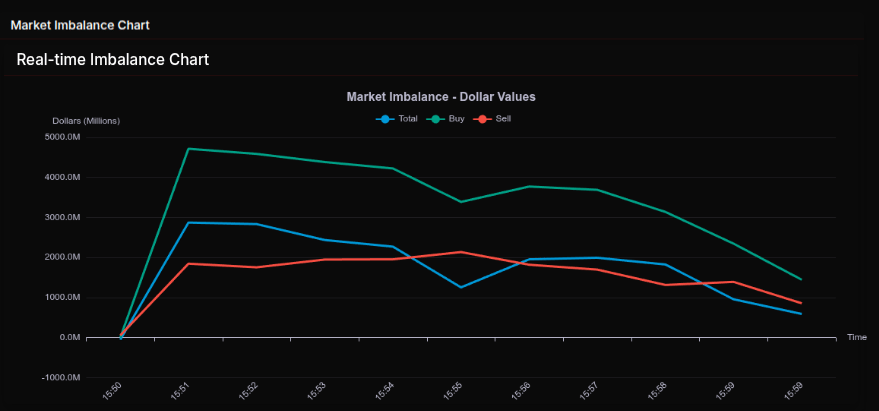
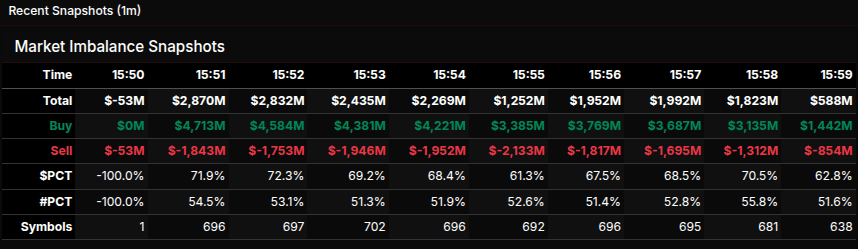
The market-on-close flow opened with a sharp tilt toward buy imbalances, immediately showing over $4.7B in buy interest versus just $53M in sells at 15:50. That produced a +71.9% lean — a wholesale-level imbalance above the 66% threshold — and set the tone for a strong buy-side auction. ES was trading near 6,686–6,690 at the time and began lifting as buy programs hit.
Into 15:51–15:53, the imbalance stayed heavy on the buy side ($2.8B–$2.4B), holding a 53–55% symbol count advantage. Prices followed: ES pushed from 6,686 at 15:50 to 6,694+ by 15:59, with multiple +3 to +8 point pushes aligning with the strongest buy spikes.
The peak of the auction came early. The real-time imbalance chart shows buy values hitting nearly $4.8B around 15:51 before tapering. After 15:54, buy interest bled off steadily: $4.2B → $3.3B → $2.1B → $1.4B by 15:59. Total imbalance dropped from $2.87B to just $588M in those last minutes. This created a fading-imbalance pattern — early surge, late drain — but without flipping negative.
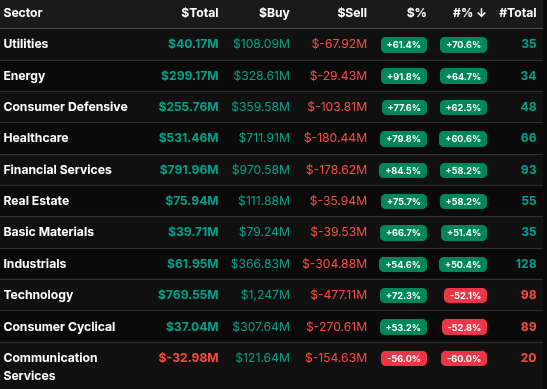
Sector flows reflect broad accumulation. Energy posted the strongest skew at +91.8% buy, followed by Consumer Defensive (+77.6%), Healthcare (+79.8%), and Financials (+84.5%). All of these were well above the 66% “wholesale buy” threshold. Technology also leaned +72.3% despite heavy dollar-value sells in a few mega-caps.
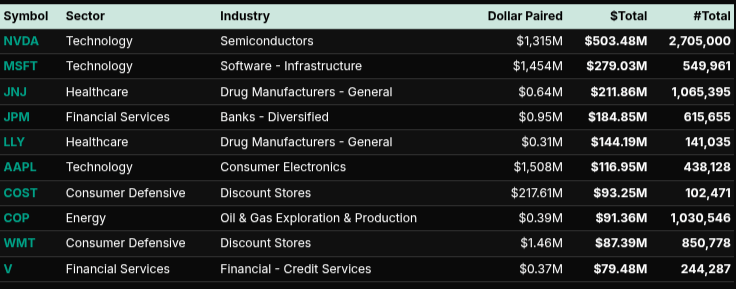
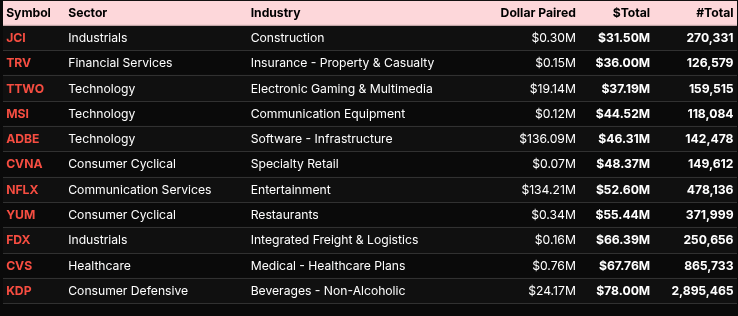
Symbol-level flow shows that the buy programs concentrated in large, liquid names: NVDA ($503M buy), MSFT ($279M), JNJ ($212M), JPM ($184M), LLY ($144M), and AAPL ($117M). All were heavily bid. On the sell side, the largest outflows were modest relative to the buy tape, led by ADBE (~$46M), JCI (~$31M), and KDP (~$78M).
As the buy imbalance narrowed into the bell, ES stabilized near 6,697 and closed unchanged. The takeaway: the MOC was dominated by early aggressive buy programs across nearly every sector, with technology, financials, healthcare, and energy all showing wholesale-level accumulation, though the intensity faded into the close.

Technical Edge
Fair Values for November 18, 2025:
-
SP: 19.79
-
NQ: 82.46
-
Dow: 79.48
Daily Market Recap 📊
For Monday, November 17, 2025
-
NYSE Breadth: 17% Upside Volume
-
Nasdaq Breadth: 38% Upside Volume
-
Total Breadth: 36% Upside Volume
-
NYSE Advance/Decline: 17% Advance
-
Nasdaq Advance/Decline: 25% Advance
-
Total Advance/Decline: 22% Advance
-
NYSE New Highs/New Lows: 41 / 156
-
Nasdaq New Highs/New Lows: 83 / 395
-
NYSE TRIN: 0.94
-
Nasdaq TRIN: 0.54
Weekly Breadth Data 📈
For Week Ending Friday, November 14, 2025
-
NYSE Breadth: 48% Upside Volume
-
Nasdaq Breadth: 49% Upside Volume
-
Total Breadth: 49% Upside Volume
-
NYSE Advance/Decline: 45% Advance
-
Nasdaq Advance/Decline: 41% Advance
-
Total Advance/Decline: 43% Advance
-
NYSE New Highs/New Lows: 286 / 170
-
Nasdaq New Highs/New Lows: 401 / 522
-
NYSE TRIN: 0.85
-
Nasdaq TRIN: 0.71
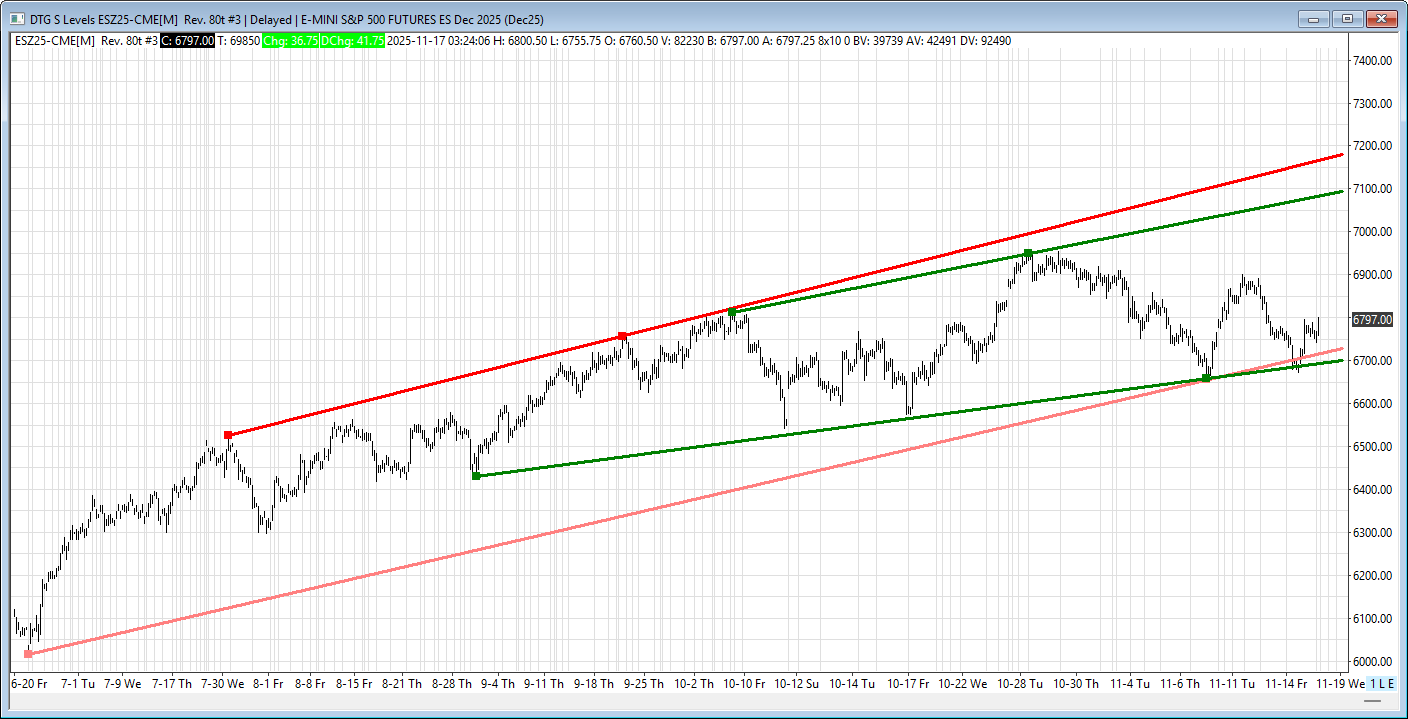
ES & NQ Levels (Premium only)

ES – Z Levels
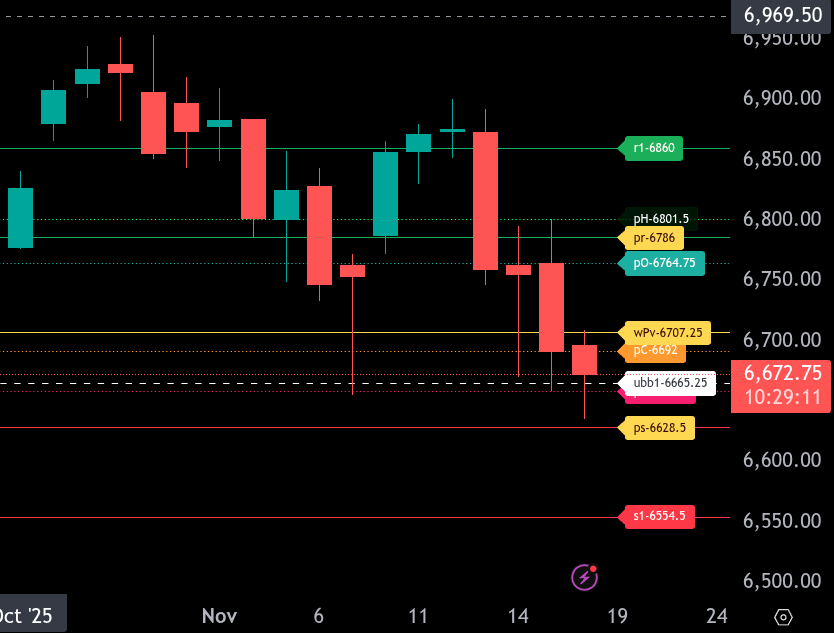
The bull/bear line for the ES is at 6707.25. Price is trading below this level near 6673.50, keeping the tone weak unless ES can reclaim 6707.25.
Upside, the first resistance is 6764.75, followed by 6786.00, which is the upper range target for today. If ES pushes through these levels, 6801.50 and 6860.00 sit above as additional resistance.
Downside, immediate support is 6658.50. Below that, the next support is 6628.50, which is today’s lower range target. A break under this area opens risk toward 6554.50.
Overall, bias stays bearish under 6707.25 with sellers in control unless ES can sustain a move back above the bull/bear line.
NQ – Z – Levels
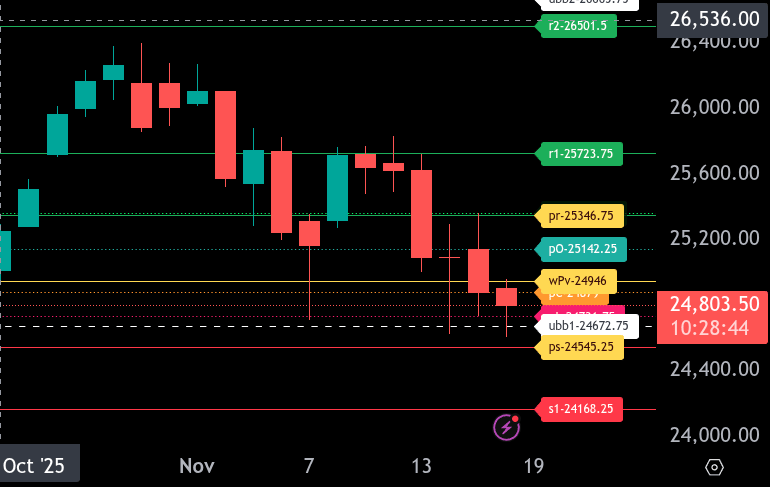
The bull/bear line for the NQ is at 24,946. Price is currently trading below this area, keeping momentum bearish unless reclaimed.
Upper range target sits near 25,346.75. A move back above 24,946, followed by sustained trade above 25,142.25, would open the door toward this upside target. Resistance before that comes in around 25,341.25.
Lower range target is 24,545.25. If sellers press below 24,879 and then through 24,731.75, momentum should extend toward 24,672.75 and ultimately 24,545.25. A break of that level exposes deeper downside.
Overall, NQ remains weak while below 24,946. A reclaim shifts the tone, but until then, sellers maintain control toward lower supports.
Calendars
Economic Calendar
Today
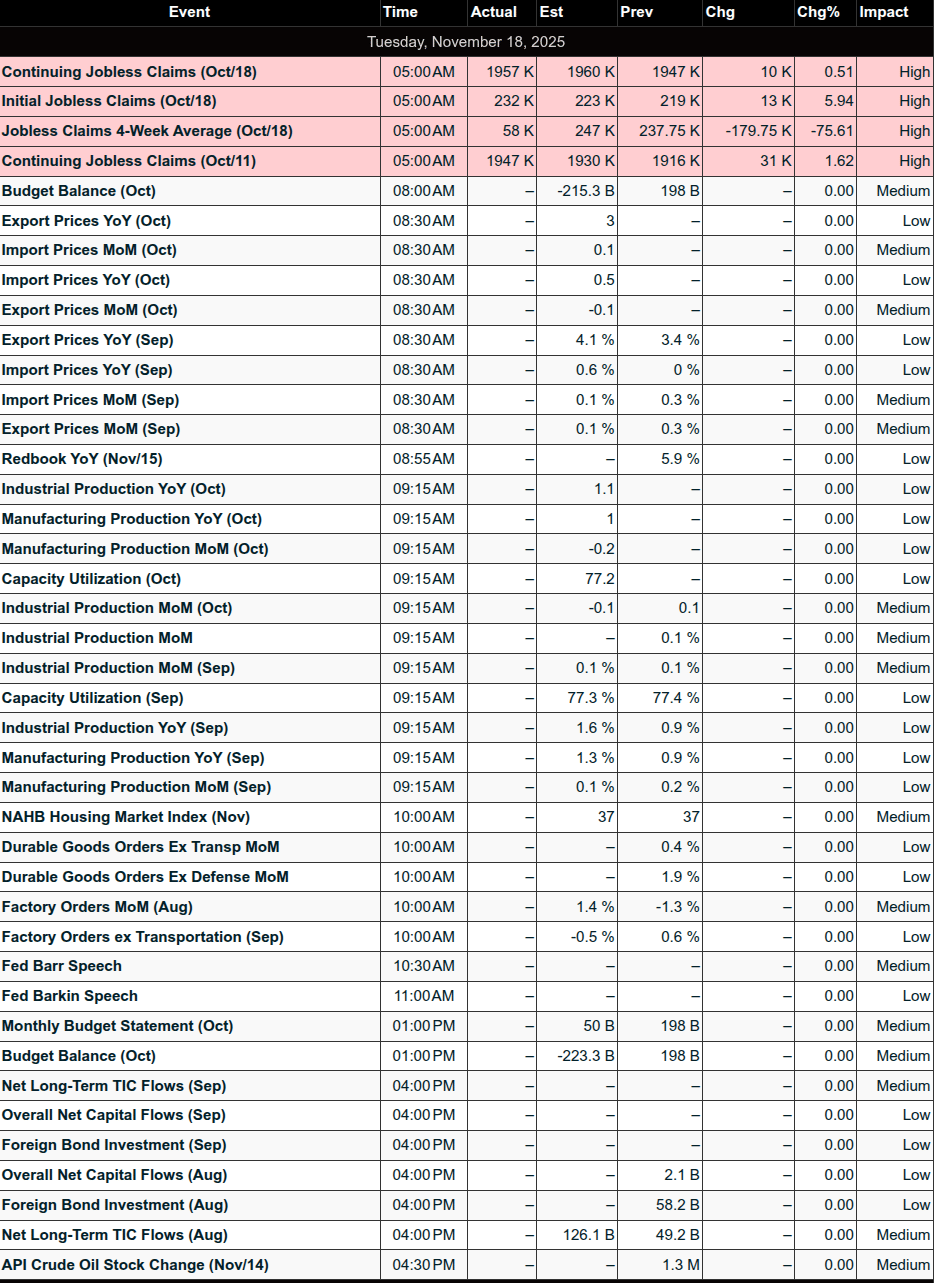
Important Upcoming
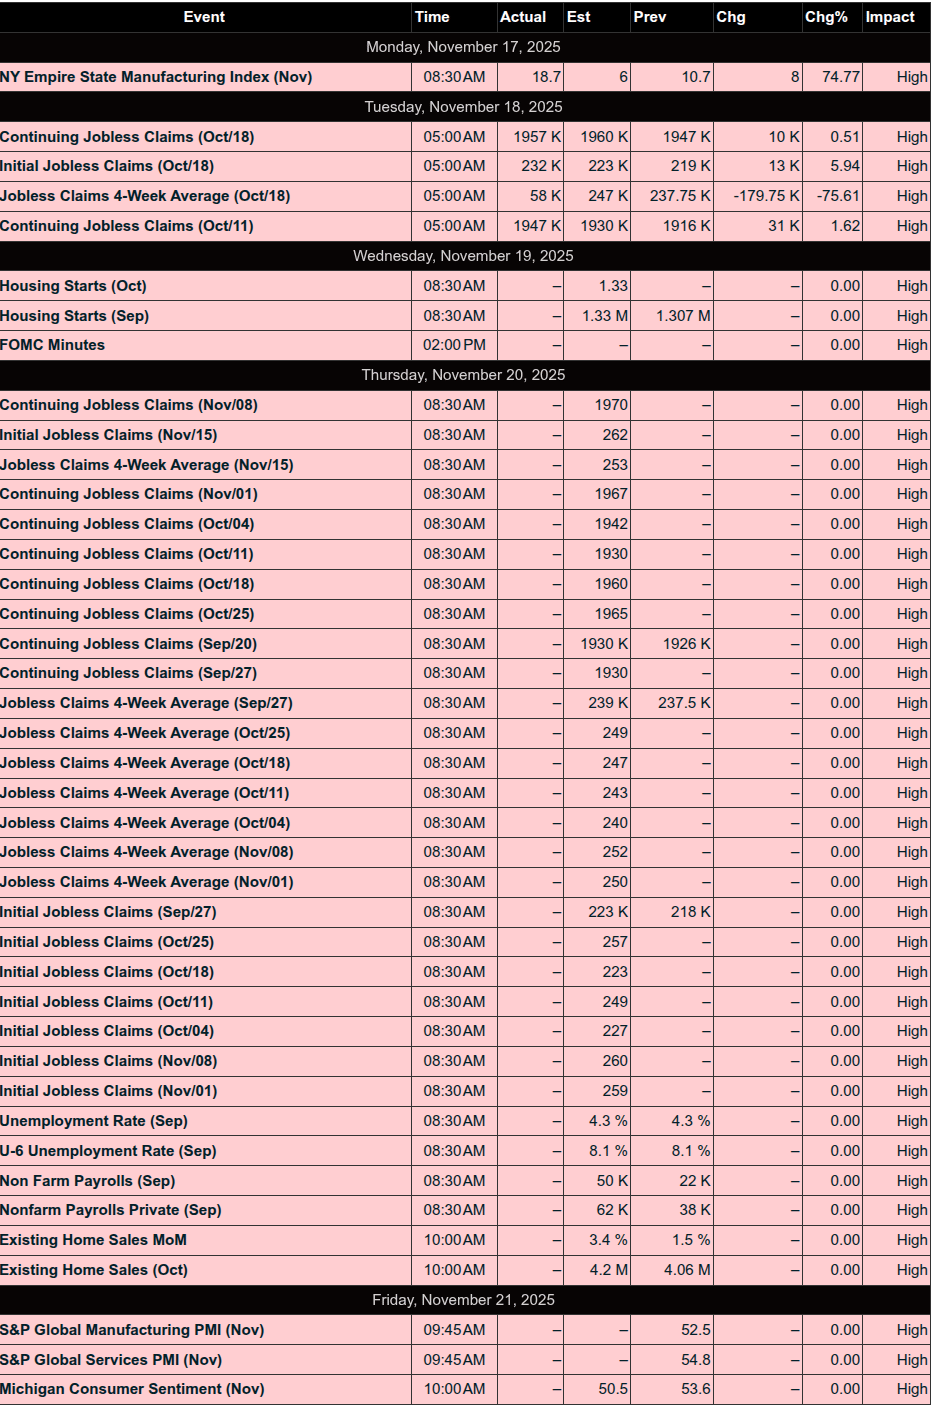
Earnings


Trading Room Summaries
Polaris Trading Group Summary – Monday, November 17, 2025
Monday’s session featured a highly active and two-sided market, largely contained within a broad symmetrical wedge. The day began with a dense trade plan, offering multiple buy/sell levels and pattern setups. Ultimately, it turned into a battle between bulls and bears, with some strong early trades to the upside, followed by a selloff that broke key support, culminating in late-day volatility.
Positive Trade Highlights:
-
Early Wins for Manny:
-
Resistance Sell 6777–6781 (Pre-Market): Manny opened the day with a short from resistance that played out nicely, catching the reversal as planned.
-
Support Buy 6740: Another sharp entry from Manny as price tagged the level and reversed higher. He called it “+38,” a strong result and great read early in the session.
-
Support Buy 6717–6721 (LB&F): Manny identified and filled a Look Below and Fail setup. His entry around 71s yielded a strong reversal and another nice win of “+30.”
-
-
PTGDavid’s Commentary Provided Strong Guidance:
-
David guided traders to shift bias to “long on dips” after an aggressive buy of the opening gap, mirroring Friday’s pattern.
-
He reminded the room of the importance of flexibility—a key lesson for navigating a two-way day like today.
-
-
Additional Positive Notes:
-
Slatitude39 noted that the PTG Daily Range Calculator hit its 6714.75 target to the tick—a testament to the precision of PTG’s planning tools.
-
Late-Day Power Hour Pump: While bears largely controlled the day, David flagged the late rally and MOC (Market on Close) data shift from flat to Buy $2.874B, hinting at potential positioning into Tuesday.
-
Key Lessons & Takeaways:
-
Flexibility was Crucial: With shifting dynamics throughout the session, David repeatedly stressed the need to stay agile—early longs worked, but later, sellers took control.
-
Symmetrical Triangle Structure: As Manny noted in his premarket, the day was range-bound with frequent reversals—perfect for executing well-defined tactical setups like LB&F and resistance fades.
-
Respect the “Line in the Sand” (6750): Once that level was broken, bears took control, driving price down toward 6653.75, exceeding the average Cycle Day 1 decline.
-
Power of Tape + Delta Cues: Entries were consistently validated with delta flips and order flow signals, reinforcing PTG’s tape-reading edge.
Bearish Momentum Late Day:
-
As the session wore on, bulls “slipped on the soap,” losing key support levels. The break of 6725 was decisive, and sellers continued pressing lower.
-
David’s Quote: “Bulls gave up the 6725 ghost” summed up the transition to bearish control well.
-
Price tested the prior low and moved toward D-level 6653.75, confirming the bearish tone.
Summary:
Yesterday was a classic example of a two-way market that rewarded precision, patience, and adaptability. Several planned zones hit perfectly (support at 6740, resistance at 6780, and the PTG range target of 6714.75). Traders who followed the setups, watched delta, and stayed flexible found success—especially early in the day.
Discovery Trading Group Room Preview – Tuesday, November 18, 2025
-
Equities & Tech:
-
U.S. futures extended Monday’s decline, probing below recent lows.
-
Nvidia (NVDA) down 2% ahead of Q3 earnings (due tomorrow).
-
Market reassessing AI rally amid valuation concerns, rising tech debt, and weakening breadth.
-
Alphabet CEO Pichai: AI investment wave contains “elements of irrationality.”
-
-
Federal Reserve & Rates:
-
Odds of a December rate cut drop to 40% (from 90% weeks ago).
-
Fed’s Waller supports a cut due to job market risks.
-
Fed’s Jefferson urges caution, citing inflation as the greater threat.
-
Fed meeting minutes due Wednesday; jobs report follows Thursday.
-
-
Crypto Market:
-
Bitcoin plunged below $90,000 overnight; fear intensifies.
-
Surge in short-term puts at $85K and $80K levels.
-
ETF buyers now underwater; corporate holders pressured to sell.
-
Strategy Inc. (Michael Saylor) buys the dip with an $835M BTC purchase.
-
-
Earnings:
-
Premarket: BHP, Medtronic (MDT), PDD, Home Depot (HD), AS, ESLT, FUTU.
-
After Hours: SQM.
-
Wednesday Premarket: Lowe’s (LOW), Target (TGT), TJX Companies (TJX).
-
-
Economic Calendar:
-
Factory Orders & NAHB Housing Index possibly at 10:00 AM ET.
-
Richmond Fed’s Barkin speaks at 11:00 AM ET.
-
-
Volatility & Technicals:
-
ES 5-day average daily range up to 102.5 points – volatility classified as high.
-
Whale bias short into U.S. session open on heavy overnight volume.
-
Key Levels:
-
Support: 6695/98 (channel bottom), 6748.25 (50-day MA), 6823/28.
-
Resistance: 6705/10, 6868/63, 7108/13, 7200/05.
-
-
Recent tests of key support held, offering short-term bullish signals.
-
Affiliate Disclosure: This newsletter may contain affiliate links, which means we may earn a commission if you click through and make a purchase. This comes at no additional cost to you and helps us continue providing valuable content. We only recommend products or services we genuinely believe in. Thank you for your support!
Disclaimer: Charts and analysis are for discussion and education purposes only. I am not a financial advisor, do not give financial advice and am not recommending the buying or selling of any security.
Remember: Not all setups will trigger. Not all setups will be profitable. Not all setups should be taken. These are simply the setups that I have put together for years on my own and what I watch as part of my own “game plan” coming into each day. Good luck!
This post goes out as an email to our subscribers every day and is posted for free here around 2 PM ET. To get your real-time copy, sign up for the free or premium version here: Opening Print Subscribe.
Comments are closed