Inflation Didn’t Disappoint the Bulls
Now what?
Follow @MrTopStep on Twitter and please share if you find our work valuable!
Our View
I knew this was going to be a wild day and it didn’t disappoint.
As you know, I mentioned that the fix was in following Tuesday’s better-than-expected 10-yr Treasury note auction and here is a headline to prove it: *POWELL: WE WERE BRIEFED ON INITIAL CPI READING THIS MORNING. I argued that Powell was out of bullets and he was.
Net net, it’s exactly like I said — FIXED.
For years the PitBull asked me why can’t we ever get any front-run information and I tell him the same thing everytime: “We don’t have the better theater seats, we sit in the bleachers.”
In reality my S&P desk heard all sorts of hot stories and about getting long or short and guess what? None of them worked over 35 years and we are still waiting!!!
Our Lean
Today we have two 8:30 numbers with Initial Jobless Claims and PPI. There’s also no Fed speak.
I still think we go higher, but when talking to the PitBull he mentioned his Thursday/ Friday low before the June Triple Witching — meaning buy weakness, especially if the futures go out weak late in the day. I on the other hand think if the ES gaps higher today I am going to sell the open or the first rally above the gap open.
This is not a direction change, it’s a day trade that if it works I will cover and start looking for places to get long again. I also want to point out on May 31st the ES traded down to 5205.50 and yesterday traded up to 5454.25. That is 249.25 points in 9 sessions. The NQs numbers are even crazier.
Our Lean: When I look at the weekly chart I see support from 5422.00 down to 5416.00, at 5404, and below that is the support down to 5392 to 5388. I doubt we see that big of a pullback, but that’s how I’m going to approach it. If the futures go ripping higher, I am not chasing into the ES’s nth new record high, which it’s done more than two dozen times already this year. Instead I am looking for a knock down to buy.
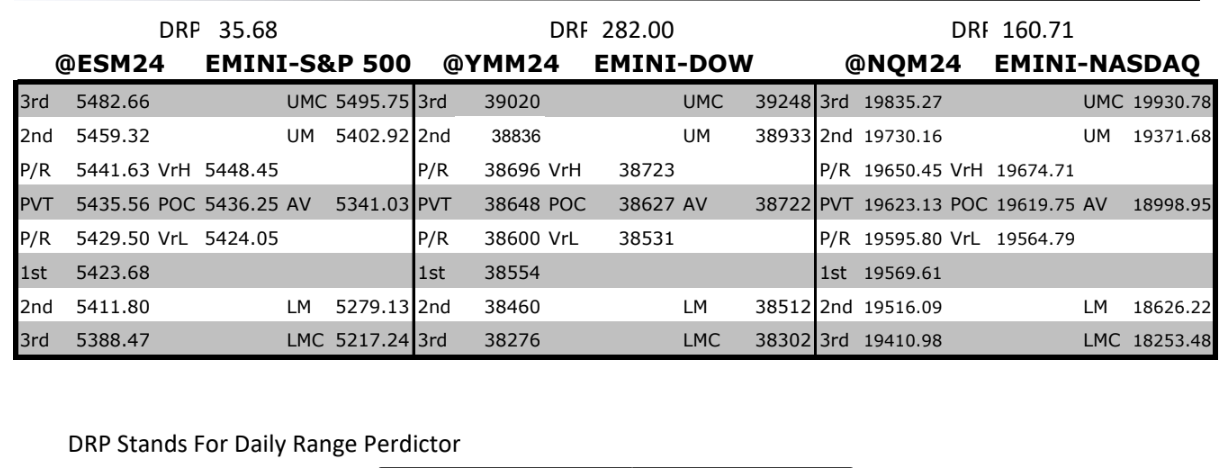
MrTopStep Levels:
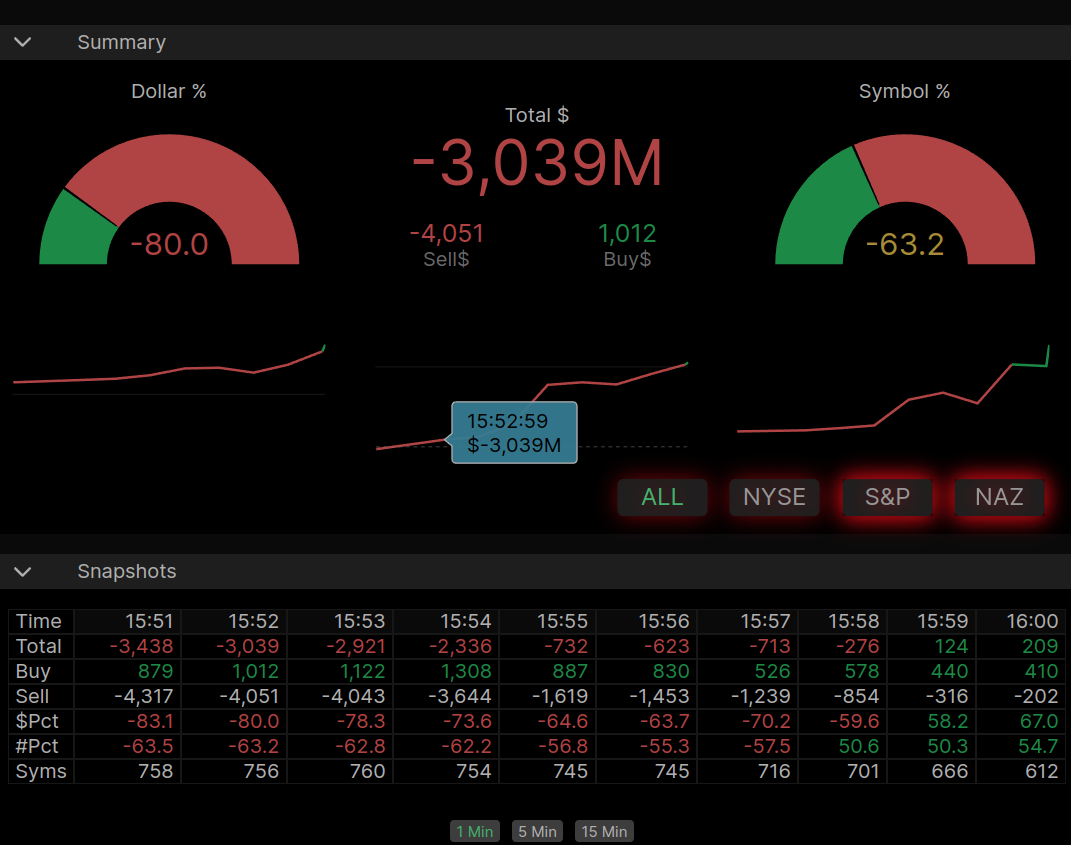
MiM and Daily Recap
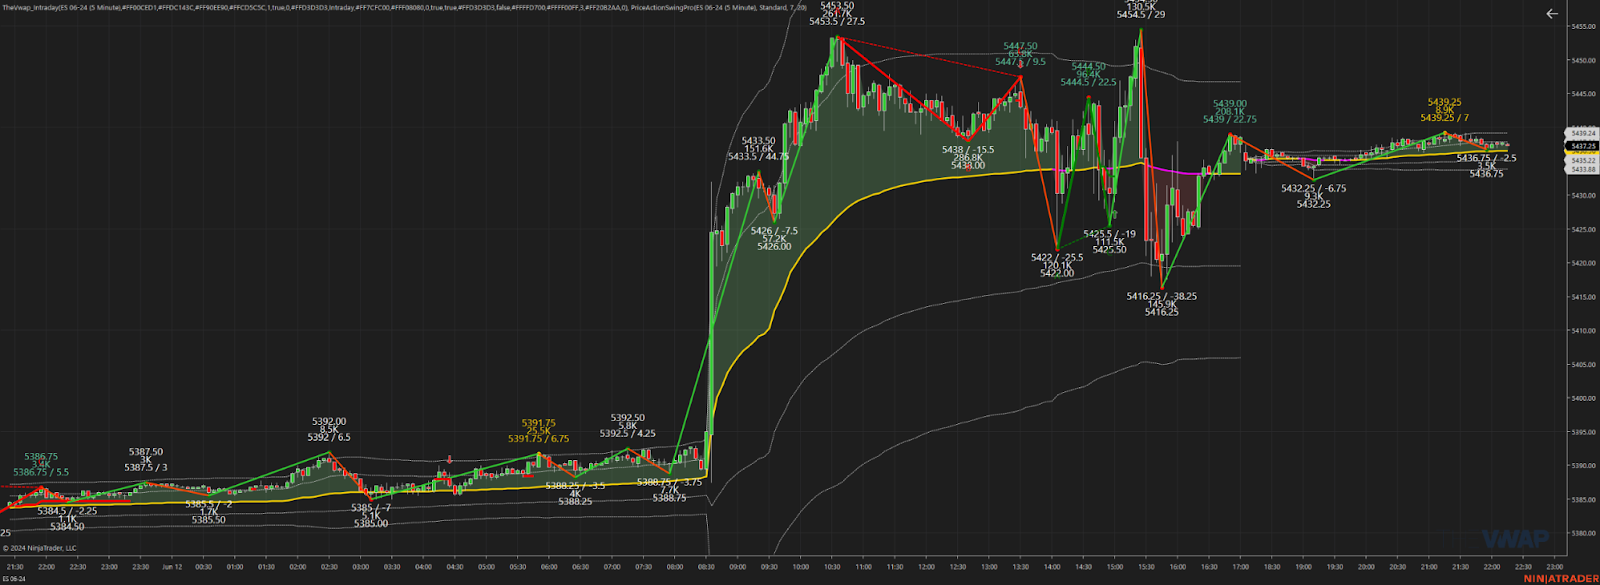
ES Recap
The ES traded down to 5380.00 on Globex, stayed in a very narrow range and then traded 5388.75 just before the May CPI number was released, which showed that consumer prices rose 3.3% YoY, missing expectations of 3.4%. The ES ripped up to 5432, a 52.25 point rally in a matter of minutes, then opened Wednesday’s regular session at 5430.
After the open, the ES pulled back to 5426.00 and then made a series of higher highs all the way up to 5453.50 at 10:30. After the high, the ES made a lower high at 5450.50 and then sold off down to 5441.75 at 10:55. Then the ES bounced back to 5447.00, sold off down to a lower low at 5439.50 at 11:15, rallied back up to 5248.00 at 11:20 and then sold off down to a lower low at 5439.00. After the low, the ES rallied back up to 5445.00 after 12:00 and then sold off down to the early low at 5438.00. That set up another push up to a lower high at 5447.50 at 1:25, pulled back a bit and then sold off down to 5422.00 at 2:00 after the Fed headlines started to hit the tape. After the drop, the ES rallied back up to 5432.50 at 2:30 as Fed Chair Powell headlines hit the tape:
-
Fed’s Powell: So far this year we have not got greater confidence on inflation in order to cut.
-
Powell: We will need to see more good data to bolster confidence on inflation.
-
Fed’s Powell: If the economy remains solid and inflation persists, we’re prepared to maintain the rate where it is as long as appropriate. The opposite is also true in terms of rate cuts.
The ES rallied back up to 5444.50 and then sold back down to 5425.50 at 2:50, rallied up to 5454.50 and then sold off down to 5416.25 at 3:45, and rallied back up to 5430. The ES traded 5428.50 as the 3:50 cash imbalance showed $3.4 billion to sell, traded back up to 5338.00 at 3:58 and traded 5426.75 on the 4:00 cash close.
After 4:00, Broadcom beat earnings and announced a stock split, helping the ES rally back up to 5439.00 and settle at 5438.50, up 54.50 points or +1.01%. The NQ settled at 19610.25 up 368 points or +1.91%, gold (GCQ$) settled at 2,340.70, up 14.10 points or +0.61%, silver crossed over $30.00 and crude oil (CLN4) settled at 78.32, up 0.42 or +0.54%. In the bond markets, the 10-yr note futures (ZNU4) settled at 110’050, up 0’195 points or +0.56% and the yield on the 10-year note fell to 4.294% from 4.403%. In other words, everything was moving.
In the end, it was a very good day for the stock market — at one point the Russell was up 3%. In terms of the ES’s overall tone, it was firm. In terms of the ES’s overall trade, volume was high with 1.792 million contracts traded.
On the trading floor every time the S&P would make a milestone new high the pit and the desk clerks would cheer and throw trading cards in the air. While I am 100% sure everyone is cheering about their retirement accounts, this has a whole different feel to it and no one is cheering. There has been a lot of talk about the big commercial loans — millions of square feet. Everything we see is changing and changing fast. I am not smart enough to know how it all works today, but I remember the Fed’s quantitative easing during the 2008 credit crisis. Every time the stock market would start to get weak the PPT would turn up the printing presses. I’m sure many of you already know this, but I asked ChatGPT how much the Federal reserve spent during the 2008 Credit Crisis and this was ‘its’ answer:
“During the 2008 financial crisis, the Federal Reserve implemented several rounds of quantitative easing (QE) programs to stimulate the economy and stabilize financial markets. The total amount spent on QE by the Federal Reserve during the crisis was around $4.5 trillion. This included purchases of Treasury securities and mortgage-backed securities. These measures were aimed at lowering long-term interest rates and increasing the money supply to spur lending and economic activity.”
So I ask chatGPT what the Fed spends now and this is what it said:
“The US government has spent $4.49 trillion in fiscal year 2024 to ensure the well-being of the people of the United States.”
Huh? What does “to ensure the wellbeing of the people of the United States” mean?
We’ve spent the same amount of money in fiscal year 2024 as we did during the entire credit crisis. All this funny money is just blowing up the stock market, but most of the money is concentrated between 7 to 20 names. But it’s the funny money that supports the stock market every time it pulls back. It sounded like a hell of a lot of money back then, but it’s a drop in the bucket today.
The funny thing? In March of 2009 the S&P cashed down to 666 and 15 years later it’s trading 5450 — a gain of 4,784 points. In conclusion, never look a gift horse in the face.
Technical Edge
-
NYSE Breadth: 53% Upside Volume
-
Nasdaq Breadth: 70% Upside Volume
-
Advance/Decline: 70% Advance
-
VIX: ~12.25
Guest Post — Dan at GTC Traders
Hopium, Wrong on Direction and Profitable
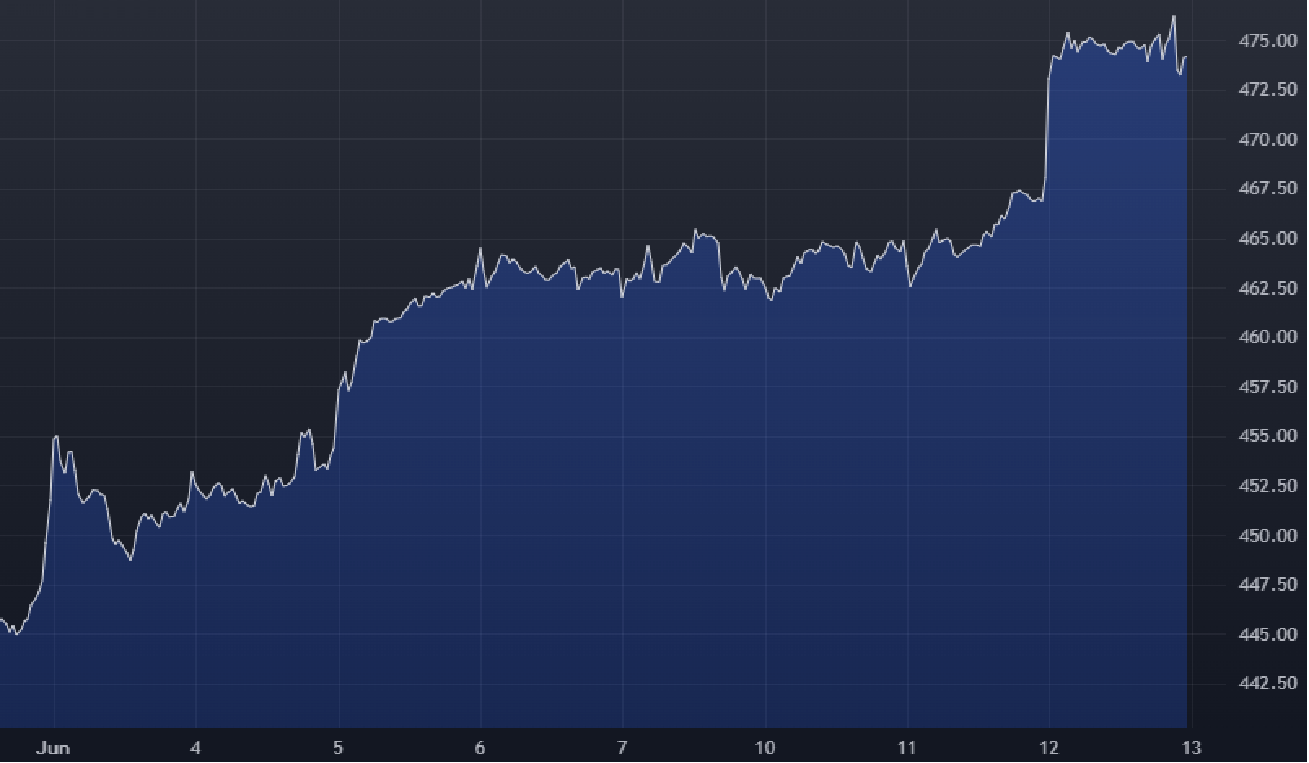
By now, everyone knows of the CPI and Inflation came in cooler than expected, which caused an immediate rocket ship of rallies in risk assets. From the Q’s, to the Spuz to Bonds. Even Junk High-Yield got in on the action today.
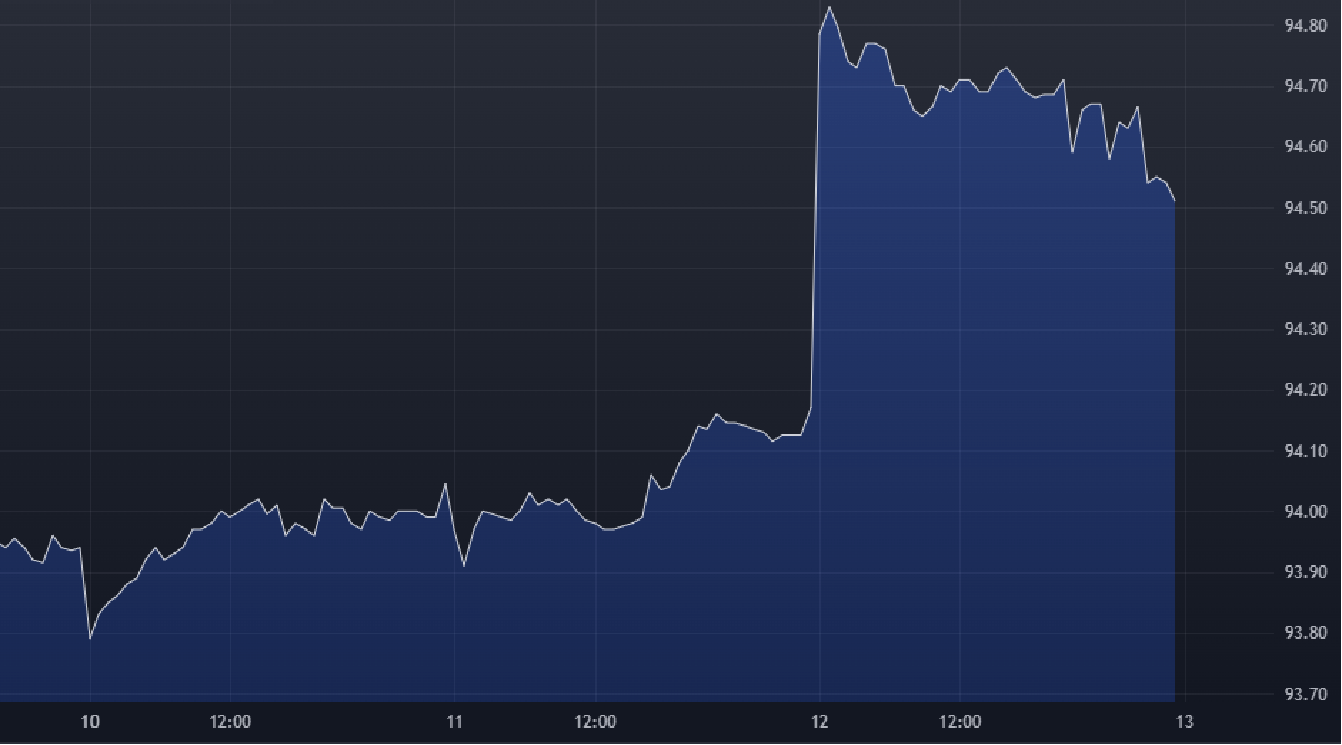
SPDR Bloomberg High Yield Bond ETF (JNK)
But, has anything actually changed?
No.
And yes.
No …. although this particular inflation print came in lower than expectations? Inflation overall, is still elevated.
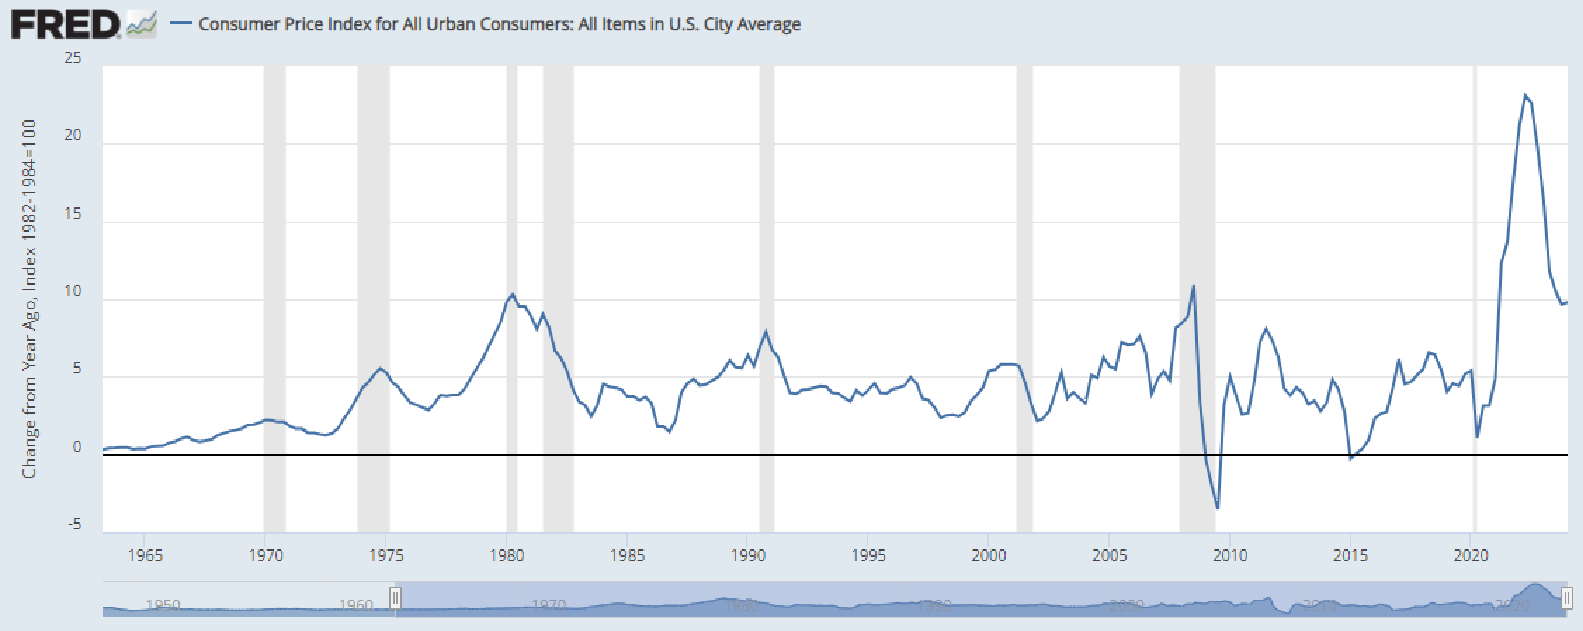
In fact, it should be noted that although basic CPI missed expectations? For the last 12 months Inflation is still printing somewhat higher. This should be especially concerning, given that we are far beyond the initial conditions of the 2020 shutdowns that began this inflationary spiral, seeming to indicate that …
A ) Financial Conditions may not be restrictive enough and thus …
B ) Inflation has indeed “gone structural” as economists like to say; which is notoriously difficult to fight.
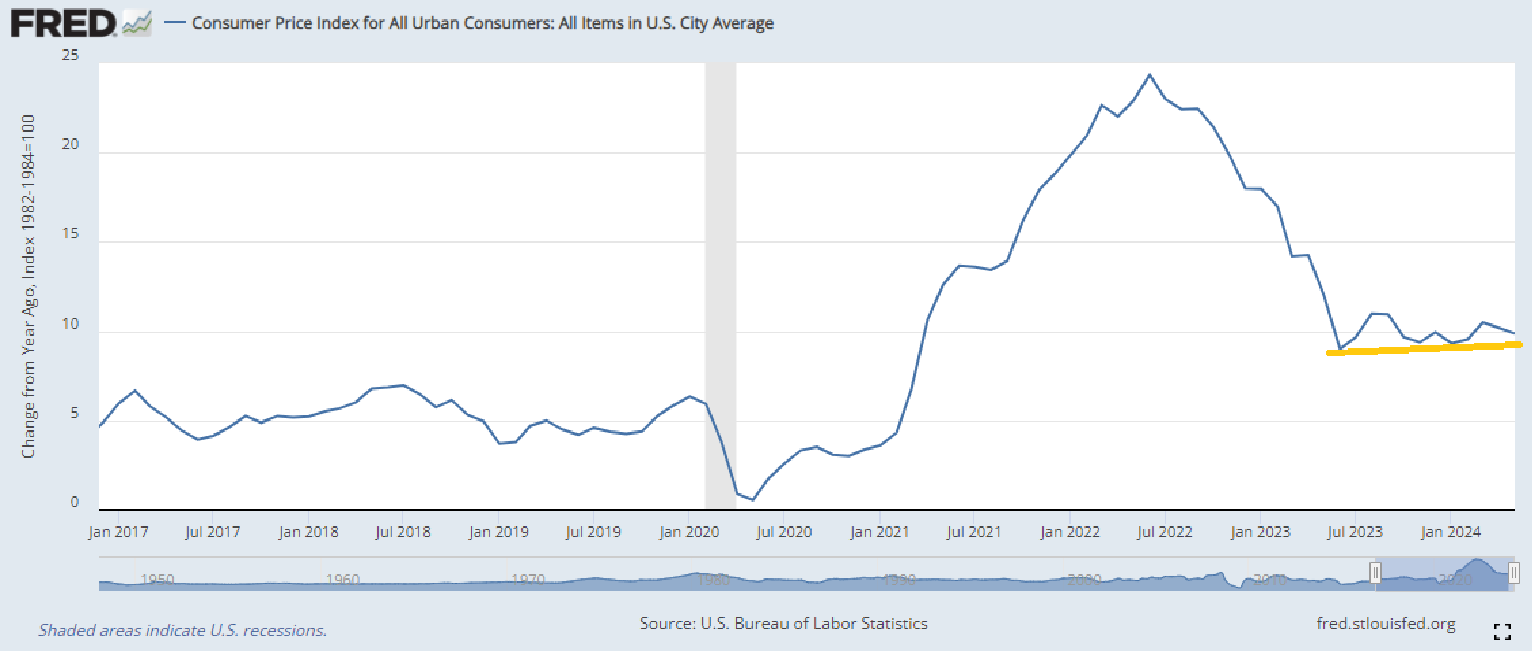
This is not a carry over from 2020. It has persisted above 3% now, since 2023.
Then why the rally in risk assets?
Hopium
The battle against Inflation is not over.
Again … then why the rally in risk assets?
Invesco QQQ Trust (QQQ)
In a word?
Hope.
Every word, every narrative, every question from the Financial Media is a narrative wrapped in the hope of a rate cut; as if this is all that is needed to solve the economic ills of the world. It’s easy to understand why they think this. 30 year old journalists were only 14 years old at the time of the Great Financial Crisis of 2008. The majority of their adult, professional life was spent in a Zero Interest Rate Policy environment (ZIRP).
Regardless, as we know, markets can remain irrational for long periods of time. On merely the hope of a rate cut and that Inflation is going to be tamed; risk markets have rallied. There is the added tailwind that a bubble has not fully formed yet but is forming in Artificial Intelligence stocks.
We feel this is propelling risk market higher and can continue to propel markets higher.
It doesn’t have to make sense. It’s what ‘is’.
Hope or ‘hopium’ is leading risk markets higher.
Wrong on Direction and Profitable
We stated last week in the Opening Print that we were uncertain as to the Macro-Economic picture; and would use techniques based in duration to pull in profit. This means we held a neutral Beta Weighted Delta ( Δβ ) in our short-term trading book. We have held this position for the last 12 days.
Mind you, the way to bet from last week, was to be positive in your deltas, or bullish.
But we are still net-profitable. For example, TLT, 100% hedged and bricked off with a TBF. We can be entitled to the TBF dividend, the TLT dividend (already captured), in addition to the TLT Call we sold. Since TBF completely hedges any downside on TLT, the downside risk is eliminated. It’s not very efficient from a use-of-capital or profit standpoint. But as we said last week, while uncertain, we were wrong on direction, and remained slightly profitable for the month, allowing us time, or duration to make a little money while we evaluated data.
We made other trades that were highly profitable, and highly defensible .
So in poker parlance? We played a ‘nit’ game, and didn’t bet heavily despite holding the nut Quads. Not exactly the way we want to make money. But while uncertain? We could make something, and gave us time to make clear headed decisions and not be subject to a lot of portfolio volatility.
Moving Forward
We continue to evaluate inflationary data as it comes in.
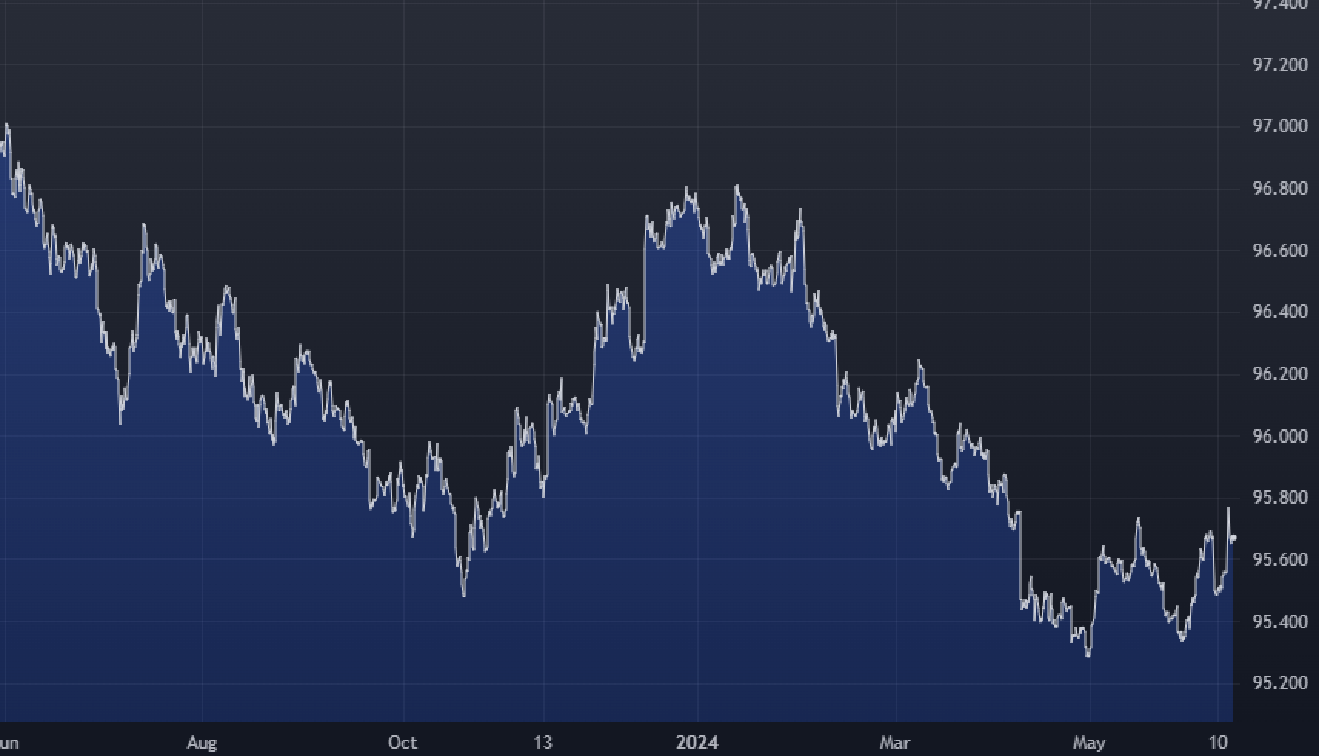
In a few moments, we will have Producer Price Index (PPI) data released. We are watching the U.S. Consumer Savings Rate, input costs (as outlined last week), Consumer Discretionary Spending, Inflation Expectations; as well as our trusted SR3U25 contract.
Three-Month SOFR Futures (June 2025) – SR3M2025
But as far as Equity Markets?
If the market wants to rally, ok … we will look to see if it’s time to switch our Beta Weighted Delta ( Δβ ) in our short-term trading book to bullish instead of neutral. But we’re not going to buy the end of a rally.
The levels we are watching on the SPX is the 5300 structure, and the 5200 structure …
S&P 500 Index (SPX)
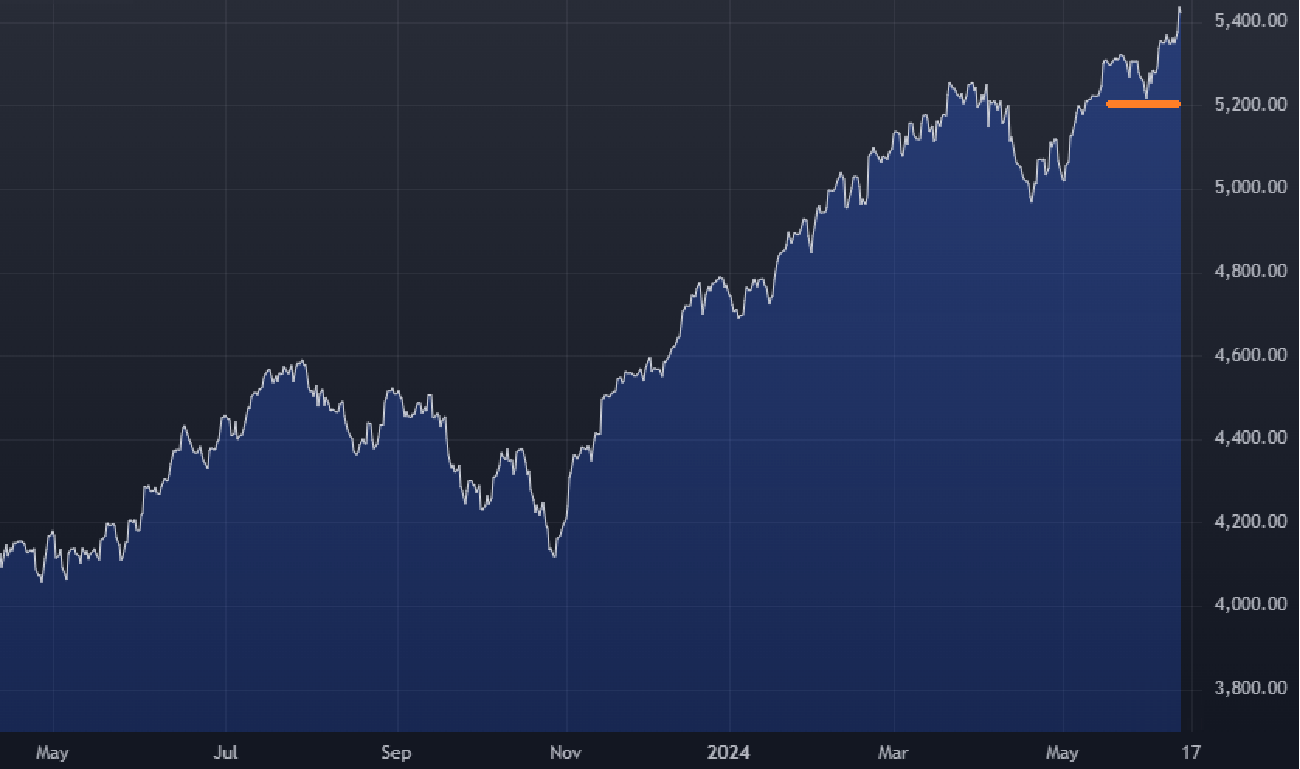
If we meet that 5200 area on the SPX, or even (if we are lucky), 5000 on any sort of mean-reversion? We may look to add more longs to our portfolio, sell cash covered puts, and adopt more of a bullish stance.
Time will tell.
Stay safe and trade well …
Economic Calendar
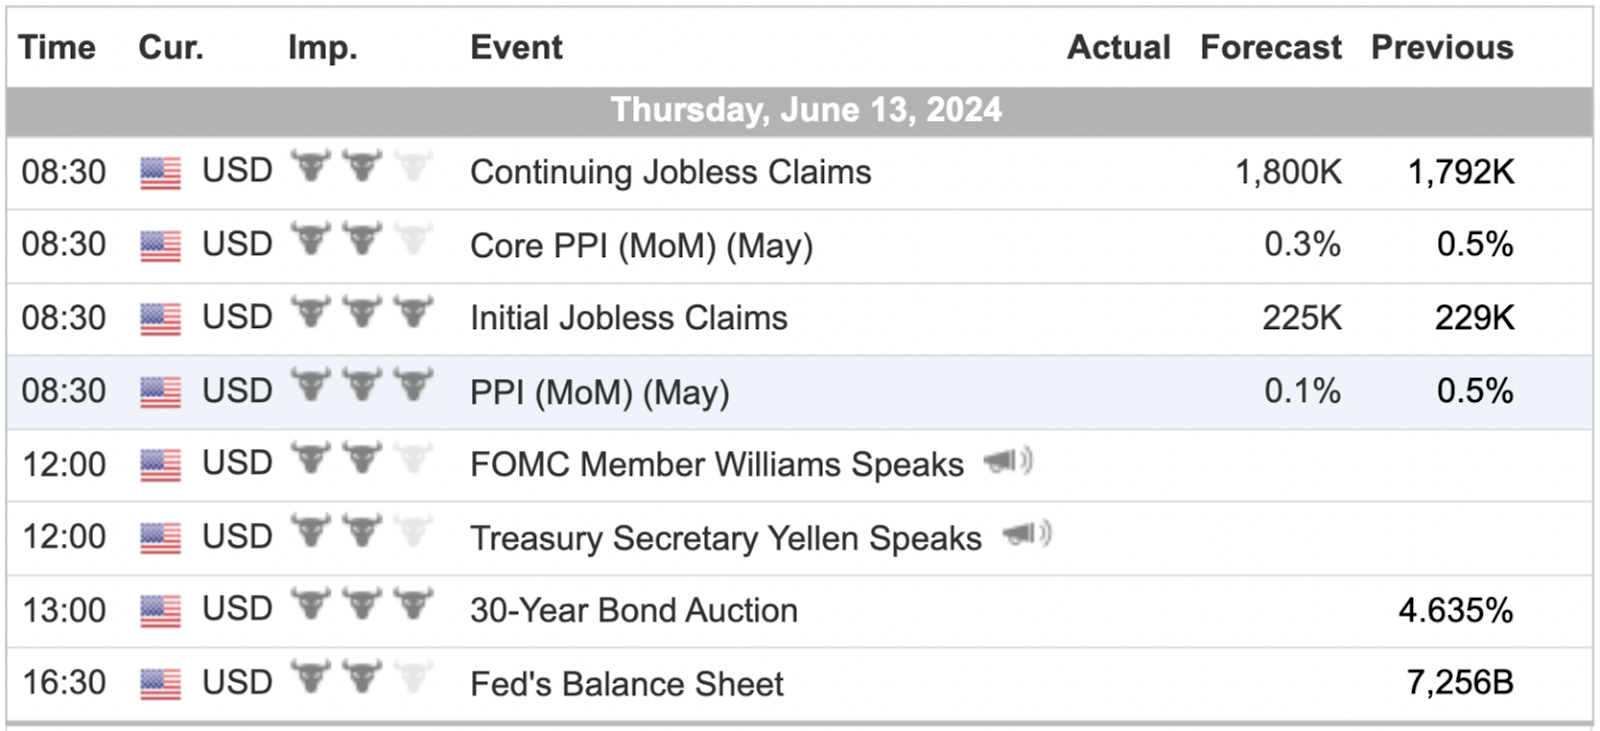
For a more complete Economic Calendar see: https://mrtopstep.com/economic-calendar/
Comments are closed