This post goes out as an email to our subscribers every day and is posted for free here around 2 PM ET. To get your real-time copy, sign up for the free or premium version here: Opening Print Subscribe.
David emphasized:
-
The market is re-establishing its “core path”
-
Traders remain jittery due to headline risk
-
Expect “fugazzi” (noisy, unreliable) headlines to continue
Follow @MrTopStep on Twitter and please share if you find our work valuable!
Our View
20% of the world’s crude oil flows through the Strait of Hormuz, but right now Iran is holding that 20% hostage.
Bond yields sank, crude oil saw its largest decline since 2020, the YM saw its largest gain since last April, the ES and NQ rose for their 6th straight day of gains, Bitcoin rose 3.33%, and the DXY (dollar index) fell -0.73%, down 5 of the last 7 sessions with 1 unchanged and 1 up.
I think we have all seen a lot of big moves, but you just can’t make this kind of shit up.
Our Lean
Our Lean
The problem with the current state of affairs is the on-again, off-again Iran agreement. There are just too many sticking points. The deal was reached 90 minutes before Trump’s deadline, Israel was never consulted, and with negotiations set to start this coming Saturday, Trump is getting cold feet.
Like I said yesterday, the whole thing is very helter-skelter.
Only 4 ships were allowed to pass through the Strait of Hormuz yesterday — the fewest in April — and Iran is saying it will limit the number of ships crossing to 12 a day. Before the conflict began, the average was over 130 ships a day.
The Game Of Chess
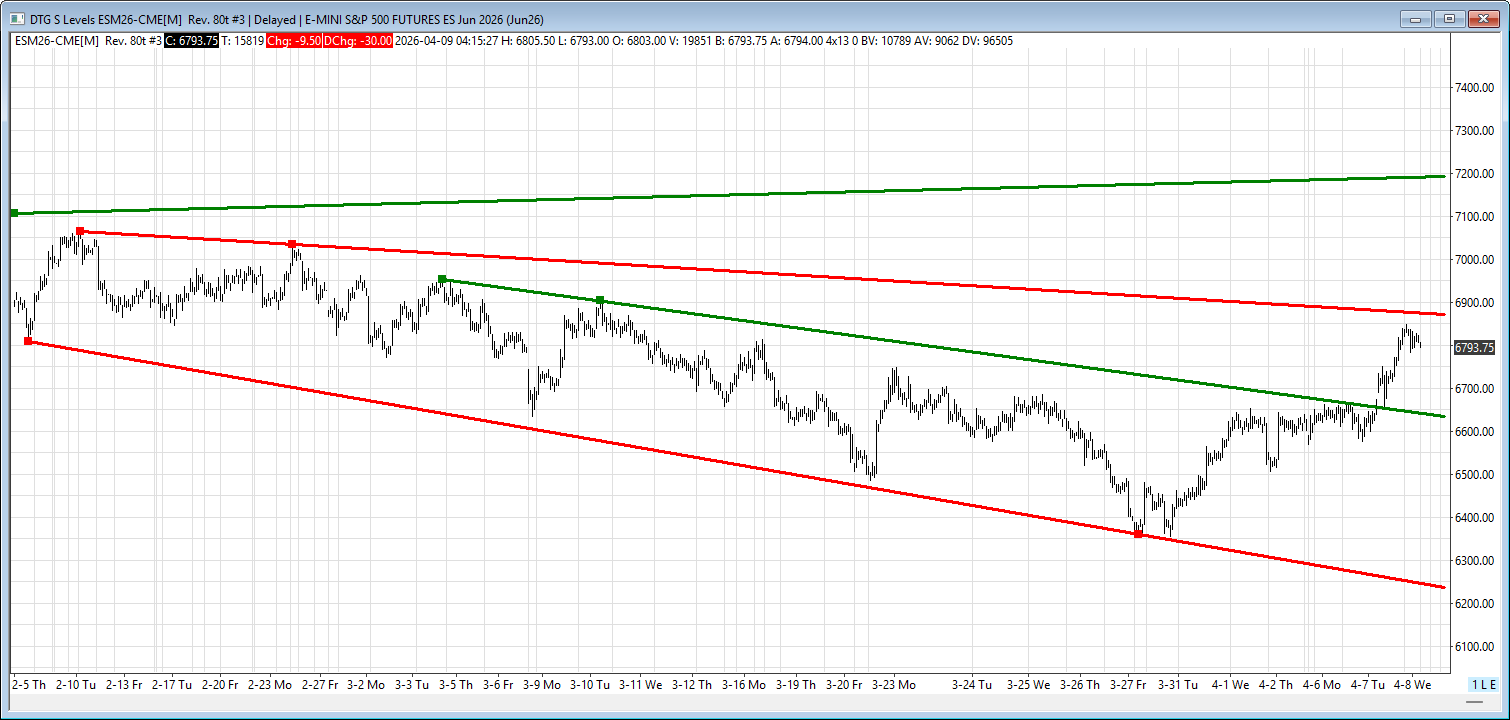
Our lean: Despite the breakdown in negotiations, I think the ES can go higher, but if oil starts going up sharply, the rallies will fail. While not in my AI levels, I think 6880 to 6930 will act as a large cluster of resistance. I think traders overestimate the ceasefire. If the ES gaps higher, I want to sell the early rallies and buy the pullbacks, and if the ES gaps down, I want to buy the early weakness.
Here’s the full ES Claude price ladder with market profile levels integrated. A few things to note:
Price Level Explanation
6990.37 3 std dev resistance Price is 3 standard deviations above the mean — statistically extreme territory. Less than 0.3% of closes occur above this band; strong mean-reversion pressure expected.
6969.42 Pivot 2nd resistance Second resistance level derived from the prior session’s high, low, and close. Traders watch this as a ceiling where sellers may step in aggressively.
6959.79 2 std dev resistance Two standard deviations above the mean (~95% of price action falls below). A common Bollinger Band upper boundary — extended but not extreme.
6919.95 1 std dev resistance One standard deviation above the mean. First meaningful overhead resistance in the standard deviation framework; price often pauses or reverses here.
6903.00 1-month high The highest price reached over the past month. Key reference for bulls — a clean break above signals a new monthly trend leg; rejection signals distribution.
6896.58 Pivot 1st resistance First resistance pivot calculated from the prior session. The most commonly watched pivot level by day traders — often acts as a magnet or reversal point.
6875.28 Target price Analyst consensus or model-derived price target. Represents fair value or an upside objective; price approaching this level may see profit-taking.
6847.25 Session high (ETH) The highest price traded during the overnight extended-hours (ETH) session. Sets the upper boundary of overnight range; breaks above attract momentum buyers.
6823.75 Previous close Yesterday’s closing price. A key reference — trading above it is broadly bullish, below it bearish. Gaps from this level often fill during the session.
6823.00 High Today’s intraday high so far. Acts as immediate resistance; a sustained break above opens the door to the next level cluster.
6813.25 ETH mid / MP mid The midpoint of the overnight ETH session range. Also the Market Profile midpoint. Price acceptance above or below here indicates directional bias for the session.
6812.89 38.2% ret 13-wk high A Fibonacci retracement level — 38.2% of the move down from the 13-week high. Shallow retracements to this level are typical in strong uptrends.
6812.50 VAH — value area high The upper boundary of the Market Profile value area — the top of the range where 70% of yesterday’s volume traded. Price above VAH suggests buyers in control; a return back inside is bearish.
6811.50 POC — point of control The price level with the highest volume traded in the prior session. The market’s “fairest price” — acts as a magnet. Price tends to rotate around POC during low-volatility periods.
6810.75 Latest price Current market price. Sitting inside the value area right on the POC, signaling a balanced, indecisive market. Directional conviction requires acceptance outside the value area.
6803.50 VAL — value area low The lower boundary of the value area (70% volume range). Price below VAL puts sellers in control. A bounce off VAL is common; a break below signals potential trend continuation lower.
6780.00 Session low (ETH) The lowest price reached in the overnight session. Sets the floor of the overnight range. A break below this level can trigger stops and accelerate selling.
6774.42 Pivot point The base pivot calculated from prior session high, low, and close. The fulcrum of the pivot framework — trading above is bullish, below is bearish bias for the session.
6767.08 Price crosses 40-day MA The 40-day moving average line itself. A major trend filter — sustained trade above is bullish, below is bearish. Watch for confirmed closes rather than intraday stabs.
6755.50 Price crosses 18-day MA stalls The 18-day MA, a short-to-medium trend gauge. A stall here means the recent move may be losing conviction before this key moving average.
6748.45 Stochastic at 80% The price level where the 14-3 day raw stochastic oscillator reads 80% — overbought territory. Signals momentum may be exhausted on the upside.
6727.55 1 std dev support One standard deviation below the mean. First meaningful downside support; price often bounces here in a healthy trend before continuing higher.
6725.13 50% ret 13-wk high/low The midpoint of the 13-week price range — a key Fibonacci 50% retracement. Often acts as strong support or resistance; a magnet for mean-reversion traders.
6701.58 Pivot 1st support First support pivot from the prior session. Day traders watch this closely as a level where buyers are expected to defend and potential long entries emerge.
6699.05 Stochastic at 70% Price where the stochastic reads 70% — approaching overbought. Less extreme than 80% but still signals caution for new long entries.
6694.48 RSI at 50% The price level corresponding to a 14-day RSI of 50 — the momentum neutral line. Above 50 RSI = bullish momentum; below = bearish. A key inflection zone.
6693.00 38.2% ret 4-wk high Fibonacci 38.2% retracement from the 4-week high. Shallow pullbacks to this level within an uptrend suggest underlying strength.
6687.71 2 std dev support Two standard deviations below the mean. A statistically significant support zone; price is stretched to the downside. Strong buying interest typically emerges here.
6657.13 3 std dev support Three standard deviations below the mean — extreme oversold territory. Rare to reach; when it does, sharp mean-reversion bounces are common.
6637.36 38.2% ret 13-wk low Fibonacci 38.2% retracement measured from the 13-week low. A potential support for a broader recovery — holds this level in downtrends before new lows.
6628.13 50% ret 4-wk high/low The 50% midpoint of the 4-week range. A balanced level between buyers and sellers over the past month; often acts as a decision point for intermediate-term traders.
Market Profile zone: The value area spans just 9 points — from VAL at 6803.50 to VAH at 6812.50 — with the POC at 6811.50 (red). The current price of 6810.75 is sitting right inside the value area, essentially on top of the POC, which is a tight, indecisive condition.
Key context:
-
Price is trading below VAH and very close to POC — buyers and sellers are in balance right here
-
The ETH session range (6780–6847) contains the entire value area, meaning overnight activity defined today’s structure
-
The gap between current price and the 1-month high (6903) represents roughly 92 handles of potential upside before hitting standard deviation resistance bands
-
Below VAL, the next meaningful cluster is the pivot point at 6774 and then the 40-day MA at 6767
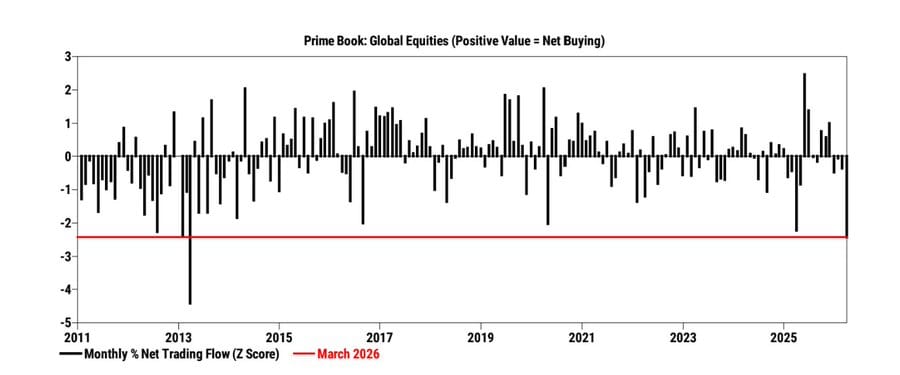
Hedge funds in the last few weeks have been ramping up short positions. Goldman Sachs’ prime brokerage unit found that, in March, hedge funds’ short sales outpaced long buys 7.6 to 1 — the fastest pace of global net selling in 13 years.

Guest Posts:
Dan @ GTC Traders
It is a ‘Too-Late Ceasefire’ … The Damage Is Done
( Full Disclosure, at the moment, we run a portfolio with many long and short positions. Our Equity Fixed Income Hybrid Core holds 18 risk assets, with a hedge wherein those risk assets delta’s are beta-weighted to the SPY, and holds a 0.50 hedge to those assets. Our Long-Short Valuation Book, is net short the indices. And our Short Term Trading Account, has deltas that are long the 10 year (hedged), short the S&P, long 5 year instruments, and short instruments with 30 year exposure )
Let’s start with a simple premise.
Let’s assume the Strait is open today. Fully open. No risk, no delays, no insurance complications, no hesitation from shipowners. Just normal flow of traffic through the strait of Hormuz … as if nothing had happened.
Even in that world … with that hypothetical premise? It’s already too late, in that a massive amount of damage has been done.
Because the system we are dealing with is not instantaneous. It is path dependent. And most importantly, it is time dependent. And we’re going to stress once again … time … is the problem.
Roughly 20 million barrels per day move through that corridor under normal conditions. That is not a number you simply “replace” because a ceasefire headline crosses. That flow was disrupted. And once disrupted, the clock starts. Tankers that did not move are still not where they need to be. Cargoes that did not load are still not in transit. Deliveries that were supposed to arrive simply do not exist in the system.
So even if everything normalized this very second, you are still dealing with a supply chain that has already been emptied.
Think through the mechanics. A barrel that needs to reach Asia does not step onto the transporter pad on the U.S.S. Enterprise to be teleported to it’s destination.

No. It loads, it sails, it queues, it unloads, it gets refined, and then it moves through product channels. That is a 30 to 45 day process under ideal conditions. So imagine that 30 to 45 days window with no ships are sailing. And while that is happening, inventories are being drawn down.
The floating storage that once acted as a buffer is gone. Strategic inventories built for this purpose have been tapped and balances are fragmented.
This is where most people make the error. They look at marginal improvement and assume resolution. A few ships get through, a headline crosses, a ceasefire is announced … and the conclusion is drawn that the problem is over.
No.
The problem is cumulative.
If you remove supply from a system for a period of time, you do not just replace that supply by restarting the flow. You must replace what was lost. That requires sustained surplus over time, not a short burst of normalization.
Now layer in something very simple. In normal conditions, roughly 135 ships cross that corridor daily. Recently? Three. At that rate, clearing roughly 800 vessels currently backed up takes 267 days. The ceasefire is for two weeks. The math does not reconcile. And that assumes everything works perfectly starting today … which it does not.
Behavior does not normalize overnight. Participants do not suddenly act as if nothing happened. Risk remains embedded in the system.
Which brings us back to the core point.
“Actually, not what’s taking place today … but what’s already taken place …”
What has already taken place is a break in the chain. And once that chain is broken, time compounds the problem. Inventories draw down, supply chains stretch, prices adjust, and behavior changes. You are no longer solving for equilibrium at time T. You are solving for equilibrium at T plus the time required to rebuild what was lost.
And that is where the market is making a critical error right now. It is pricing the headline. It is not pricing the mechanics.
Which is why you are seeing rallies in risk assets on the back of “peace” headlines. Hope. Relief. What we would simply call complacency.
We have seen this before. Fed Put. Fiscal stimulus. “There will always be a fix …” Now it has a new label. TACO. Same underlying belief … just a different wrapper. That things will just work out.
But markets are not narratives. They are systems. And systems break when the underlying mechanics fail.
So no, we are not buyers of this rally. To be sure, as more headlines hit and more discussions take place, you will get more upside bursts driven by positioning and short covering. That is fine. But none of that changes the underlying condition.
The damage has already been done. And more importantly … it is still being done.

Because despite the ‘Ceasefire’ … and despite headlines? The Strait is not open. The system is not functioning in the way it once did. Those sea-lanes are empty. And the clock is still running.
So we come back to the same conclusion.
Not what’s taking place today … but what has already taken place.
Until next time, stay safe and trade well.
Market Recap:
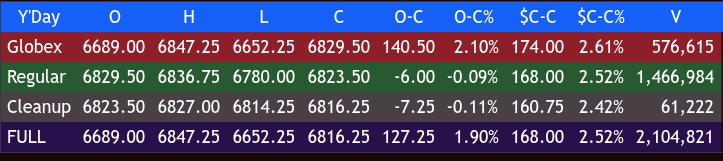
The ES made a 6817.00 low and 6847.25 high on Globex, with 580k contracts traded, and opened Wednesday’s regular session at 6829.50, up 174 points or +2.55%.
After the open, the ES rallied up to 6836.75, sold off 31.75 points down to 6805.00 at 9:55, rallied up to 6818.50, and sold off down to a new low at 6780.00 at 10:57. It rallied up to 6805.25 at 11:00, sold off down to 6789.75, and rallied 32.50 points up to 6822.25 at 12:00.
It then sold off to the VWAP at 6809.75 at 12:15, rallied up to 6829.75 at 1:00, and traded down to 6812.50 at 1:35. It rallied 18.75 points up to 6831.25 at 2:15, sold off 23.25 points down to 6808.00 at 2:15, and traded up to 6819.25.
It then sold off down to 6792.50 at 3:01, traded back up to 6815.00 at 3:47, and traded 6814.25 as the 3:50 cash imbalance showed $3.7 billion to buy. It traded up to 6819.75 at 3:58 and traded 6823.50 on the 4:00 cash close.
After 4:00, the ES traded up to 6827.00, sold off down to 6814.25 at 4:50, and settled at 6823.75, up 167 points or +2.43%, up 6 of the last 7 sessions with 1 unchanged.
The NQ settled at 25074.25, up 703.25 or +2.89%, up 6 of the last 7 sessions with 1 unchanged. The YM settled at 48144, up 1332 points or +2.85%, or up 5 of the last 8 sessions. The RTY settled at 2635.70, up 75.60 points or +2.95%, up 6 of the last 7 sessions with 1 session unchanged.
In the end, the ES rallied too much overnight on extremely high Globex volume, sold off, and rallied late. In terms of the ES’s overall tone, it acted firm but skittish. In terms of the ES’s overall trade, volume was high: 580k traded on Globex and 1.528 million traded on the day session, for a total of 2.108 million contracts traded, the highest volume in 8 sessions.
How Did We Get Here?
Like I tried to say in yesterday’s OP, there are just too many unknowns in the 14-day pause, and Iran has the upper hand. Iran’s 10-point proposal includes:
-
Guarantee of non-aggression — A formal commitment from the US (and implied for Israel) that Iran and its allies will not face future attacks.
-
Permanent and complete cessation of the war on Iran — Moving beyond temporary ceasefires to a durable, unlimited end to hostilities.
-
End to attacks on all fronts, including Iran’s regional allies — This includes stopping strikes on Hezbollah in Lebanon and conflicts involving proxies or allies in Iraq, Yemen, and elsewhere (effectively ending the broader regional war).
-
Continued Iranian control/regulation of the Strait of Hormuz — Iran would maintain sovereignty over the strait, reopen it for safe navigation under its coordination, and potentially impose fees on ships (with some versions mentioning funds going toward reconstruction).
-
Lifting of all primary and secondary US and international sanctions — Full removal of sanctions, along with the release of frozen Iranian assets.
-
Acceptance of Iran’s uranium enrichment — Recognition of Iran’s right to civilian nuclear enrichment (with Iran committing in some versions not to pursue nuclear weapons).
-
Withdrawal of US combat forces from the region — A broader pullback of US military presence in the Middle East.
-
Compensation/reparations for damages — Payment or equivalent support for the reconstruction of infrastructure damaged by US and Israeli strikes.
-
Termination of relevant international resolutions — Canceling UN Security Council and IAEA Board of Governors resolutions against Iran.
-
Binding UN Security Council resolution — To formalize and enforce the final agreement, providing legal guarantees.
How does this serve the people of Iran? How does it serve the Israelis, the US’s interest, and our allies in the Middle East?
If there is one thing that is clear, it’s that Trump had zero exit plan. Late in the day, Karoline Leavitt was quoted as saying that Iran’s initial ten-point plan was “fundamentally unserious, unacceptable and completely discarded.” “It was literally thrown in the garbage by President Trump and his negotiating team.” “The idea that President Trump would ever accept an Iranian wish list as a deal is completely absurd.”
On Tap Today
-
8:30 PCE, GDP, Jobless Claims
-
10:00 Wholesale Inventories
MiM
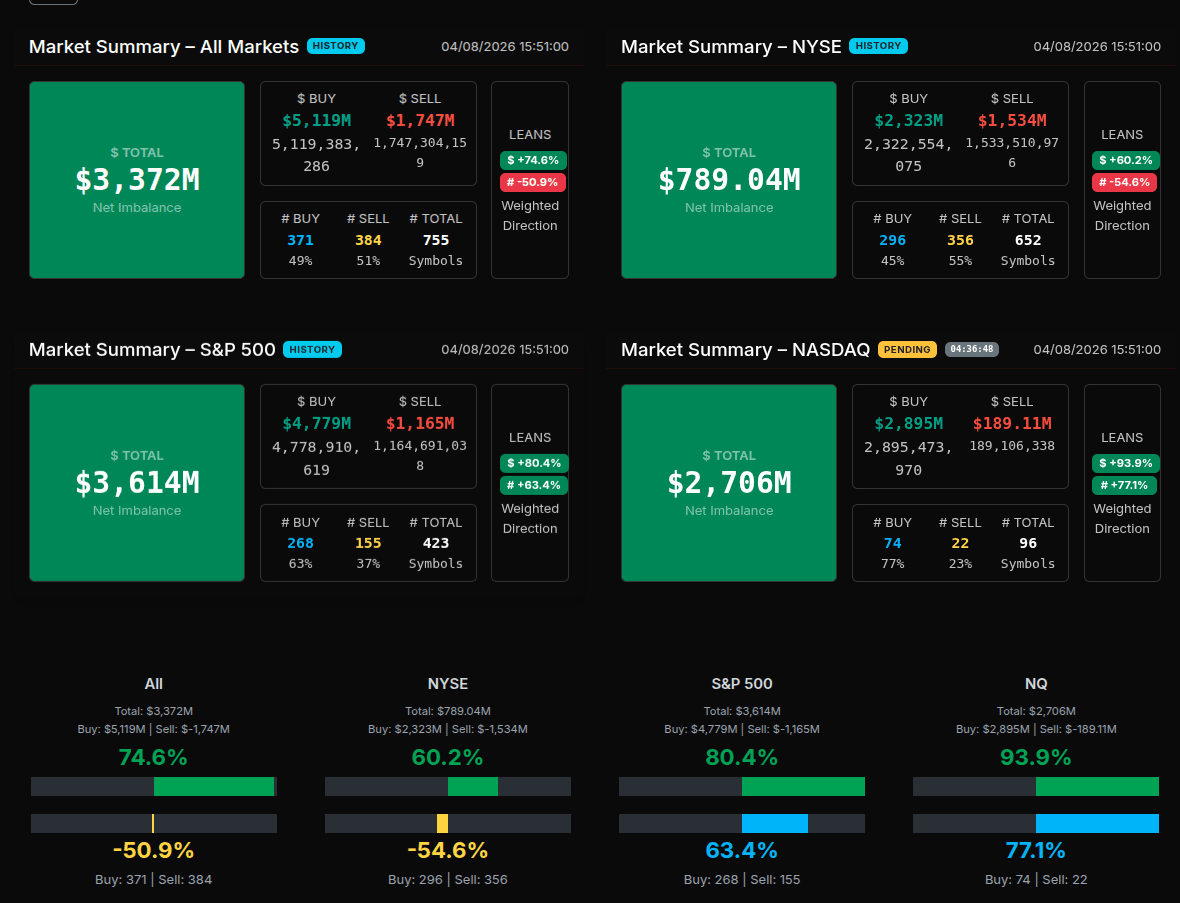
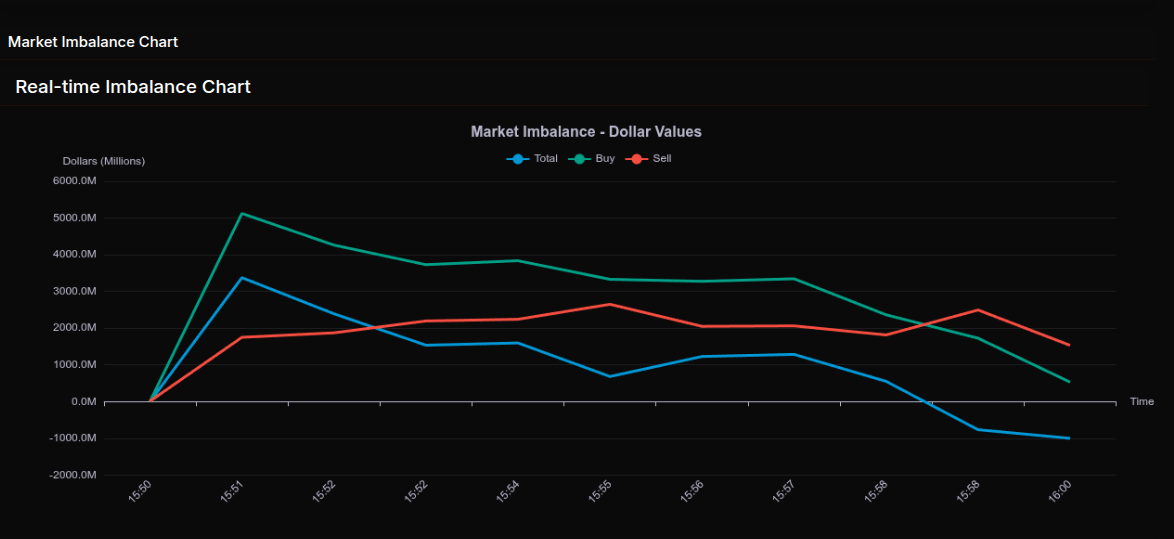
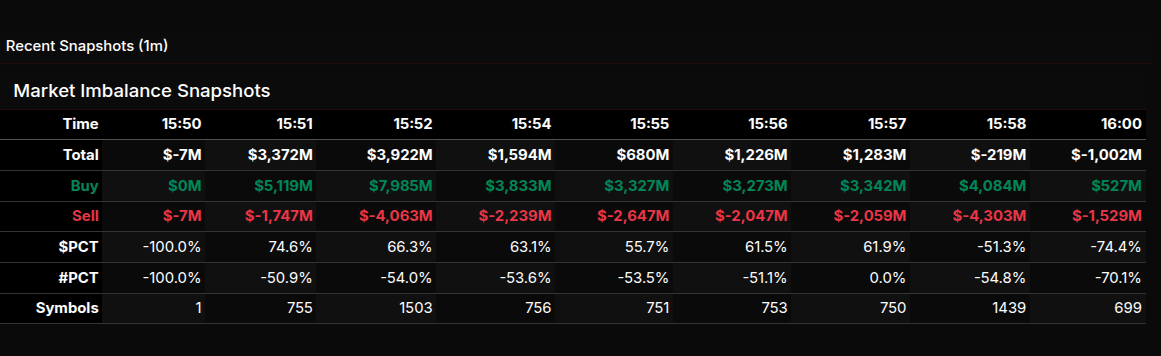
The MOC session opened with immediate strength, flipping from a negligible imbalance at 15:50 into a sharp buy-driven expansion by 15:51, where net imbalance surged to +$3.3B. This initial push was aggressive and directional, with $PCT hitting +74.6%, indicating a clear institutional bias toward accumulation rather than rotation. The follow-through into 15:52 maintained elevated buy pressure (+66.3%), confirming continuation rather than a one-minute anomaly.
From there, the auction began to transition. While still net positive through 15:57, the $PCT steadily compressed into the low 60s and mid-50s, signaling a shift from strong directional buying toward more balanced, rotational flows. This was reinforced by #PCT readings consistently negative, showing more symbols leaning sell even as dollars remained buy-heavy — a divergence that often precedes late-session instability.
That instability arrived into the close. At 15:58 the tape flipped decisively, with $PCT collapsing to -51.3%, and then accelerating into a wholesale sell program at 16:00 with -74.4%. This move meets the >66% threshold, marking a true institutional sell imbalance into the bell rather than simple rebalancing.
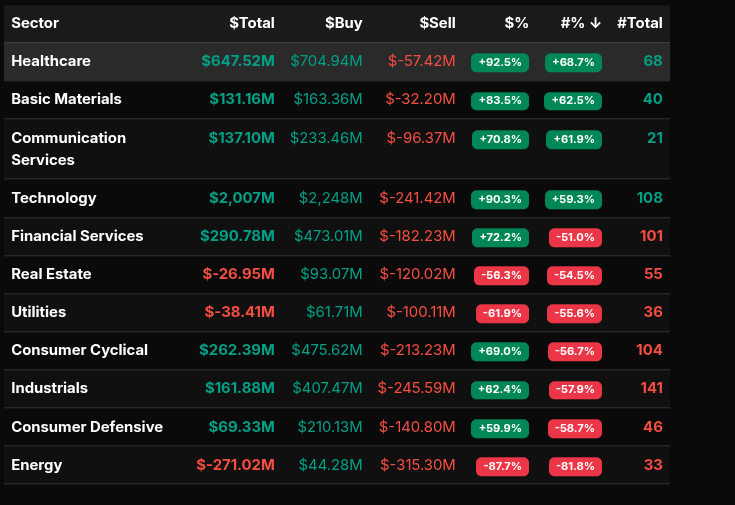
Sector flows were broadly constructive early, led by Technology (+90.3%), Healthcare (+92.5%), and Basic Materials (+83.5%), all showing strong buy-side conviction. Communication Services (+70.8%) and Financials (+72.2%) also participated, though Financials showed internal divergence with negative breadth. Energy stood out as the clear outlier at -87.7%, a decisive sell program and the weakest sector by a wide margin.
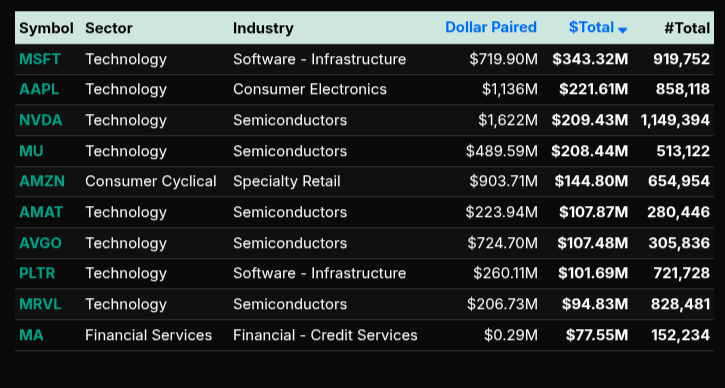
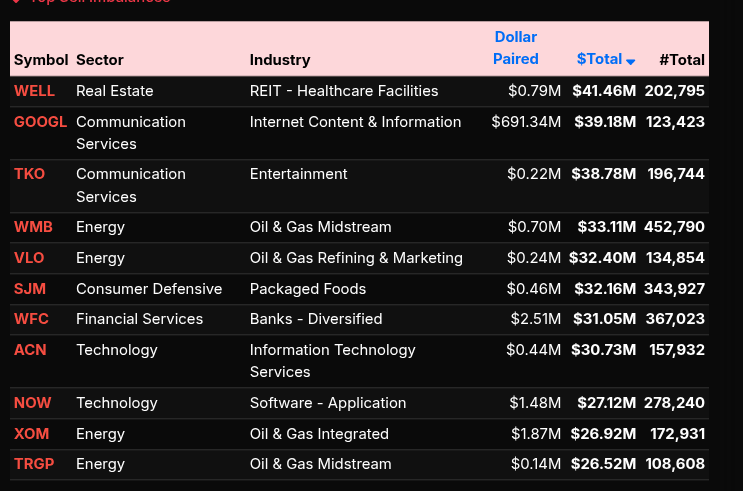
On the symbol level, leadership was concentrated in large-cap tech: MSFT, AAPL, NVDA, and AMZN dominated the buy side, reinforcing the Nasdaq’s extreme +93.9% lean — a near one-sided institutional bid. Conversely, sell pressure clustered in Energy (XOM, VLO, WMB) and select defensives.
Overall, the session evolved from broad, aggressive accumulation into a late, programmatic sell imbalance — a classic transition from trend to rebalance into the close.
Technical Edge
Fair Values for April 9, 2026
-
S&P: 40.82
-
NQ: 175.77
-
Dow: 224.63
Daily Breadth Data 📊
For Wednesday, April 8, 2026
-
NYSE Breadth: 73% Upside Volume
-
Nasdaq Breadth: 78% Upside Volume
-
Total Breadth: 76% Upside Volume
-
NYSE Advance/Decline: 84% Advance
-
Nasdaq Advance/Decline: 75% Advance
-
Total Advance/Decline: 78% Advance
-
NYSE New Highs/New Lows: 107 / 21
-
Nasdaq New Highs/New Lows: 215 / 79
-
NYSE TRIN: 1.90
-
Nasdaq TRIN: 0.85
Weekly Breadth Data 📈
For the Week Ending Thursday, April 2, 2026
-
NYSE Breadth: 59% Upside Volume
-
Nasdaq Breadth: 63% Upside Volume
-
Total Breadth: 62% Upside Volume
-
NYSE Advance/Decline: 75% Advance
-
Nasdaq Advance/Decline: 73% Advance
-
Total Advance/Decline: 74% Advance
-
NYSE New Highs/New Lows: 151 / 305
-
Nasdaq New Highs/New Lows: 191 / 734
-
NYSE TRIN: 2.00
-
Nasdaq TRIN: 1.53

BTS Levels:
ESM2026
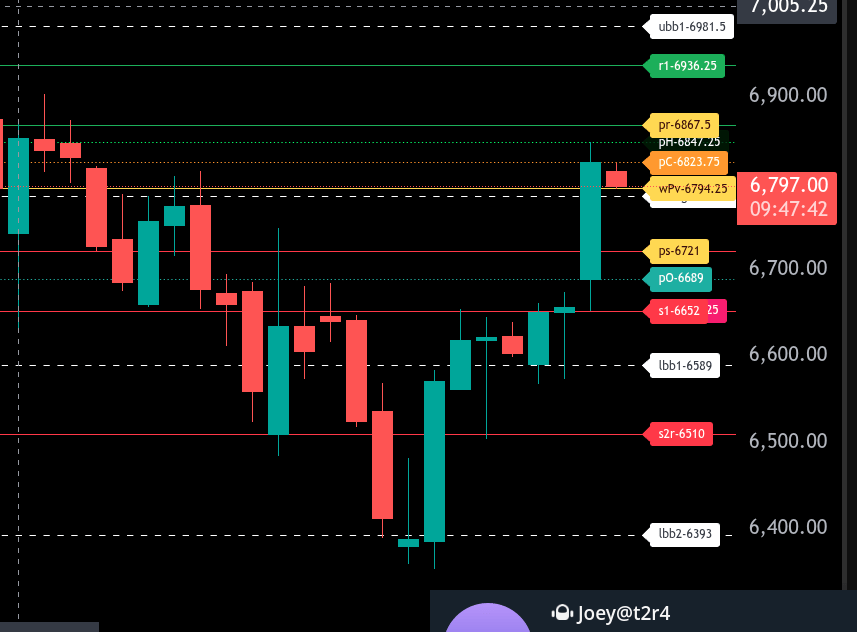
The bull/bear line for the ES is at 6794.25. This is the key level that must be reclaimed and held for bullish continuation. Acceptance above this level shifts momentum back in favor of buyers.
Currently, ES is trading around 6797.00, attempting to hold just above the bull/bear line after a sharp overnight push higher. This puts price in a fragile bullish posture, but follow-through is required to confirm strength.
On the upside, immediate resistance comes in at 6832.75, followed by 6867.50. These levels define the upper range target for today. If buyers can sustain acceptance above 6794.25, a rotation into these levels is likely. A break and hold above 6867.50 opens the door for continuation toward 6936.25.
On the downside, failure back below 6794.25 would shift momentum back to neutral-to-bearish. Initial support sits at 6721.00, which is the lower range target for today. A break below this level exposes 6689.00 and then 6652.25. Continued weakness below there could extend toward 6589.00.
Overall, price is at a decision point around 6794.25. Holding above keeps the path of least resistance higher, while rejection back below signals a failed breakout and potential rotation back into the prior range.
NQM2026
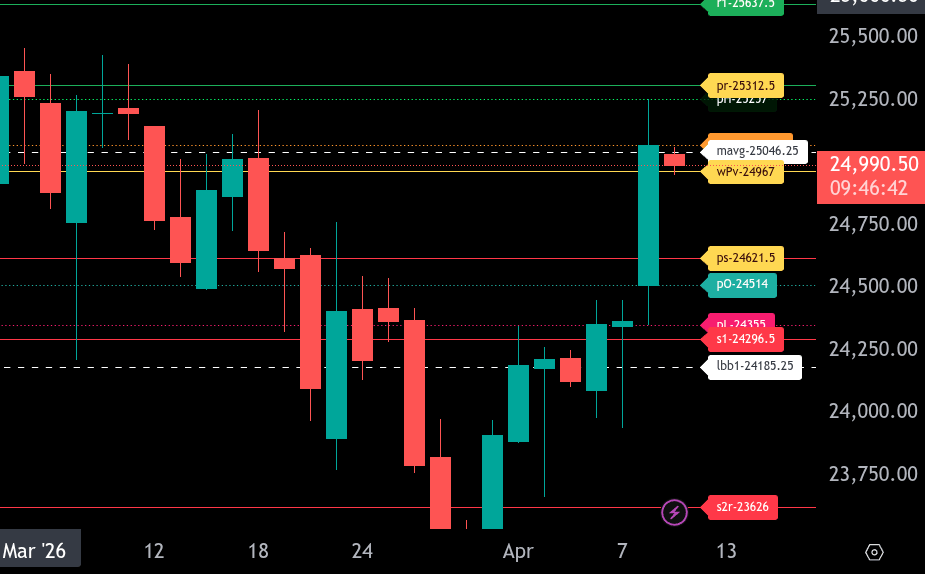
The bull/bear line for the NQ is at 24967.00. This is the key pivot for today. Holding above this level keeps the market in a bullish posture, while acceptance below it would shift momentum back to the downside.
NQ is currently trading around 24990.50, slightly above the bull/bear line, indicating early strength following the recent push higher. As long as price holds above 24967.00, buyers remain in control and dips into this level can be viewed as potential support.
On the upside, the first resistance comes in near 25046.25, followed by 25312.50, which is the upper range target for today. A sustained move above 25046.25 opens the door for continuation into 25312.50. Acceptance above the upper range target would signal expansion and continuation of the bullish trend.
On the downside, if price loses 24967.00, expect a rotation lower toward 24621.50, which is the lower range target. Additional support sits at 24514.00 and then 24355.00, with deeper downside risk extending to 24296.50 and 24185.25 if selling accelerates. A break below 24621.50 would confirm weakness and shift control back to sellers.
Overall, the market is attempting to transition back to bullish above 24967.00. Holding above this level favors continuation higher, while losing it puts the market back into a rotational or bearish environment..
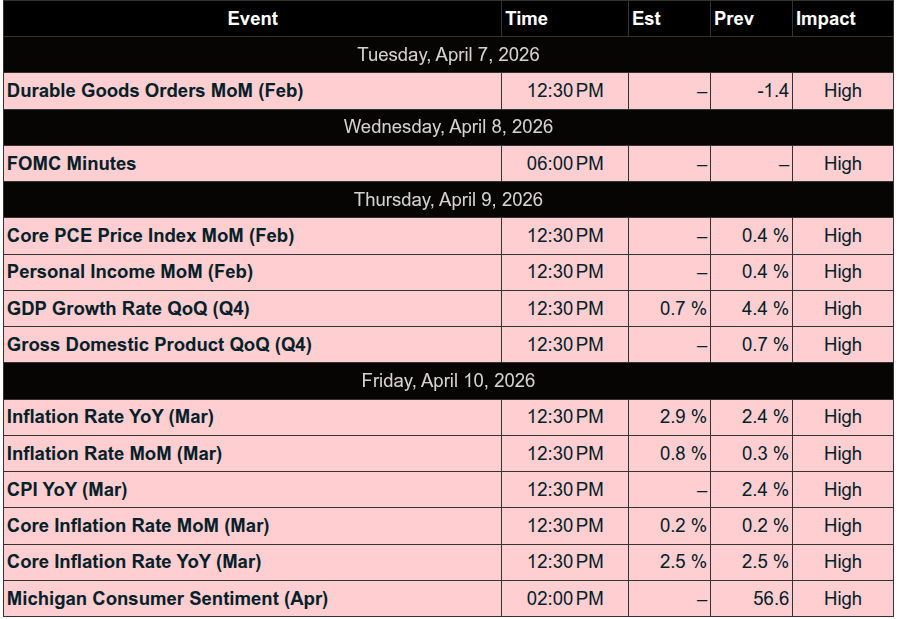
This Week’s High Importance
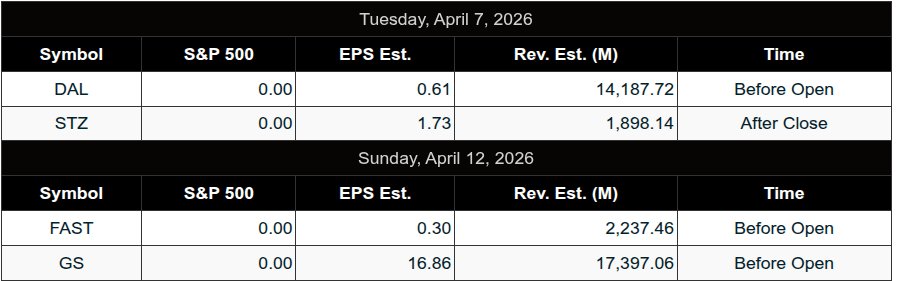
Earnings:
Trading Room News:
PTG Room Summary – For Wednesday, April 8, 2026
The session unfolded as a headline-driven, digestion day, with traders navigating a market reacting more to macro developments than clean technical structure.
Morning: Stable Start, Technical Focus
-
The room opened with normal engagement and chart review.
-
Early discussion centered around:
-
Prior ES reference levels (notably 6618 from the previous session)
-
Identifying valid extremes (around 9:46 AM) — reinforcing patience in waiting for confirmation.
-
Midday: Low Volatility, Observational Trade
-
Market lacked strong directional conviction.
-
Notable macro backdrop:
-
VIX down ~19%, signaling reduced fear but also less urgency.
-
-
Traders stayed disciplined, avoiding forcing trades in a slower environment.
Afternoon: Headline-Driven Environment
-
Key theme of the day:
This created:
-
Choppy conditions
-
Less predictable reactions
-
Importance of staying aligned with higher-probability setups
Trade Structure & Execution
-
Strong validation of the day’s plan:
-
ES price action held within the DTS target range: 6773 – 6820
-
-
This reflects:
-
Respect for levels
-
Controlled movement despite news volatility
-
-
Closing order flow:
-
MOC Buy Imbalance: $3.5B
-
Suggests underlying support into the close
-
Key Takeaways & Lessons
“Stay the course” mindset
-
Alignment trades remain the edge, especially in uncertain conditions.
Headline environments require patience
-
Markets may not respect technicals cleanly — avoid overtrading.
Range-bound days still offer structure
-
Even without trends, respecting pre-defined levels (DTS) is critical.
Discipline > activity
-
Quiet days are opportunities to sharpen execution, not force trades.
DTG Room Preview – Thursday, April 9, 2026
Macro Focus: Markets centered on the fragile US-Iran ceasefire and partial reopening of the Strait of Hormuz, with rising uncertainty around enforcement and shipping flow restrictions.
Geopolitics:
-
Ceasefire holding loosely but tensions increasing after reported Israel strikes.
-
Weekend US-Iran talks (led by VP Vance) seen as critical; truce described as “fragile.”
-
Confusion over whether Lebanon is included in ceasefire terms.
-
Iran considering tolls and limiting traffic through Hormuz, raising global trade concerns.
Oil / Shipping Watch:
-
Strait not fully reopened; traffic far below normal levels.
-
Tankers (China, Saudi, India) testing passage, signaling potential supply flow shift.
Data Catalyst (Today):
-
8:30am ET: Core PCE, GDP, Jobless Claims, Personal Income/Spending
-
First key read on inflation impact from elevated oil prices.
-
Volatility / Positioning:
-
Volatility elevated; ES 5-day avg range ~114.25
-
Whale bias slightly bullish into data on light overnight volume
-
-
Technical Setup (ES):
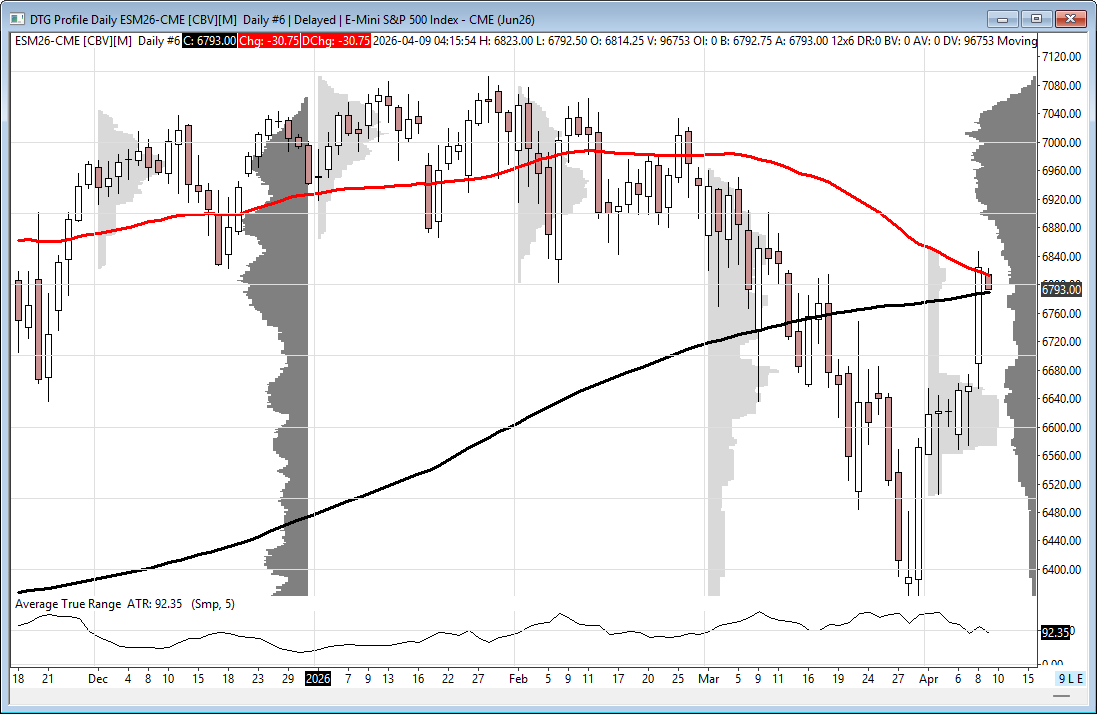
-
Trading between 50-day MA (6813) and 200-day MA (6789.50)
-
MAs converging → potential bearish cross
-
Needs clean break above 50-day MA for bullish continuation
-
-
Key Levels:
-
Resistance: 6874/71, 7190/95
-
Support: 6634/29, 6240/35
-
Affiliate Disclosure: This newsletter may contain affiliate links, which means we may earn a commission if you click through and make a purchase. This comes at no additional cost to you and helps us continue providing valuable content. We only recommend products or services we genuinely believe in. Thank you for your support!
Disclaimer: Charts and analysis are for discussion and education purposes only. I am not a financial advisor, do not give financial advice and am not recommending the buying or selling of any security.
Remember: Not all setups will trigger. Not all setups will be profitable. Not all setups should be taken. These are simply the setups that I have put together for years on my own and what I watch as part of my own “game plan” coming into each day. Good luck!
This post goes out as an email to our subscribers every day and is posted for free here around 2 PM ET. To get your real-time copy, sign up for the free or premium version here: Opening Print Subscribe.
Comments are closed