This post goes out as an email to our subscribers every day and is posted for free here around 2 PM ET. To get your real-time copy, sign up for the free or premium version here: Opening Print Subscribe.
Follow @MrTopStep on Twitter and please share if you find our work valuable!
Our View
In the big picture, the ES has been in a big back-and-fill pattern for the last two weeks. As It seems like Iran has the upper hand, and the more threats Trump puts out, the easier it is for Iran to reject.
They have bottlenecked the Strait of Hormuz and have flatly rejected the 45-day ceasefire and the 10-point plan, and currently hold the “tactical” upper hand regarding energy prices and regional disruption, but they are negotiating under the shadow of what the White House describes as “complete demolition” of their domestic infrastructure.
The world is watching!
Our Lean
Despite it all, the markets are holding. I honestly can say I do not understand it, but if there is no deal and Trump orders mass attacks, which seems likely, and Iran responds, oil will rally again, which should put pressure on the markets.
One thing the PitBull said that he agreed with me on was that the markets are more fixed than ever before.
Our lean: You can buy weakness, but this is a sell-the-rallies day.
Sorry, I tried several times to run the numbers on Claude, but it shut me out!

The Strait of Hormuz is a critical route for the world’s nitrogen fertilizer market, which is especially important for crops like corn and other grains. Disruption to the Strait because of the war in Iran could drive up prices for fertilizer and agricultural products around the globe, according to Goldman Sachs Research.
More than a quarter of the global nitrogen fertilizer trade and roughly 20% of liquefied natural gas (LNG)—the primary feedstock for nitrogen production—transit the Strait, Goldman Sachs Research analyst Lina Thomas writes in a report. Shipping disruptions have already pushed nitrogen fertilizer prices, such as urea, up by 40% since the conflict began (as of March 24).
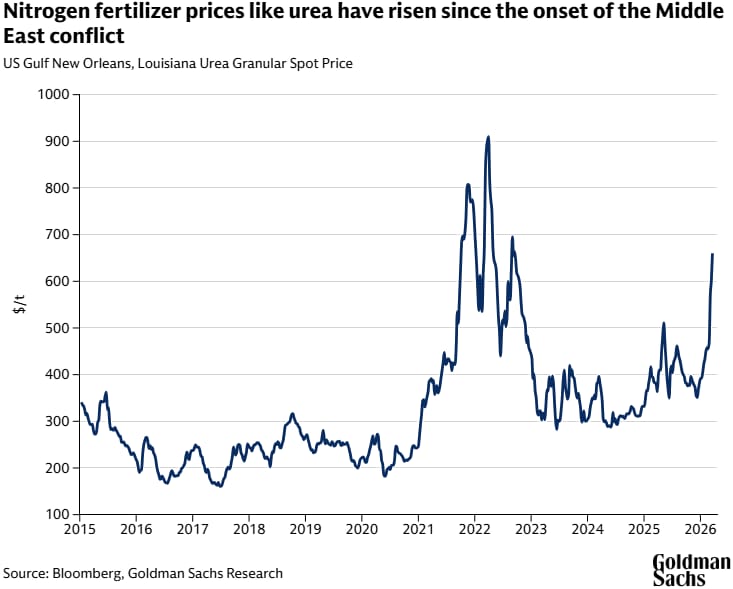
While higher fertilizer costs could increase grain prices—fertilizer accounts for about 20% of grain production costs—the bigger risk lies in reduced grain supply. Yield losses from delayed or sub-optimal nitrogen application, along with potential acreage shifts toward less fertilizer-intensive crops, could tighten global grain markets.
The impact varies by region. The US appears relatively insulated in the near term, as most farmers probably secured fertilizer ahead of planting season, though April availability could still be affected.
Europe, Australia, and parts of the Southern Hemisphere face greater exposure due to later crop calendars and reliance on LNG-linked fertilizer production. If disruptions persist, increased grain imports from the US by more exposed regions could push American grain prices higher as well.

Guest Posts:
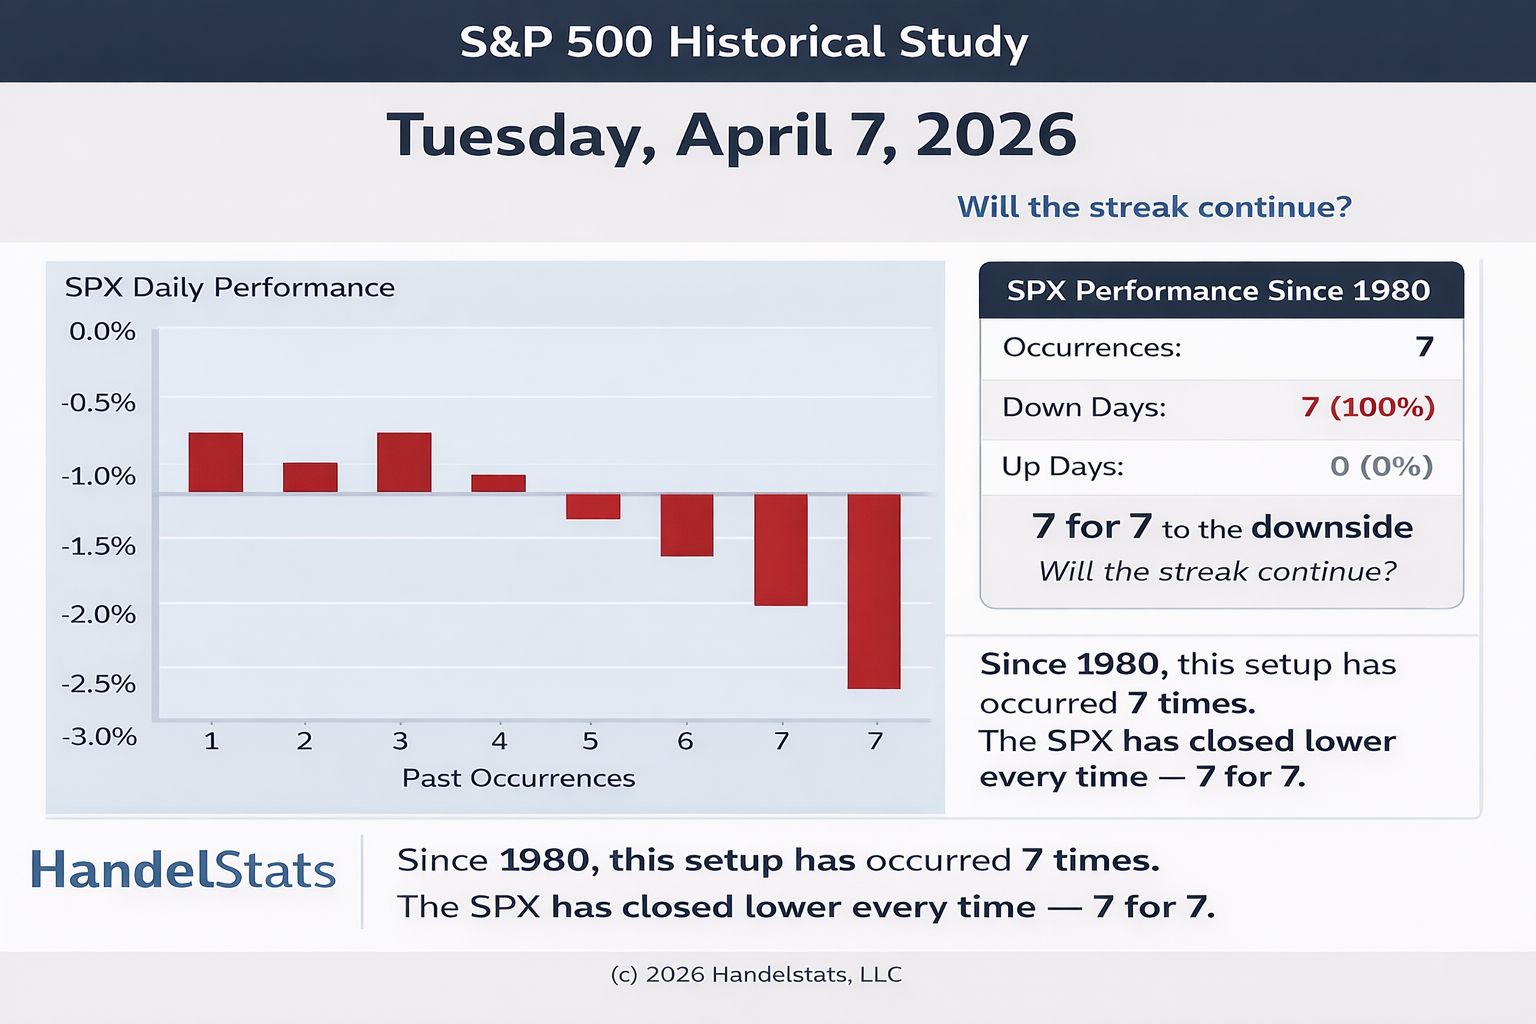
Rich Miller – HandelStats
Study:
Tom Incorvia – Blue Tree Strategies
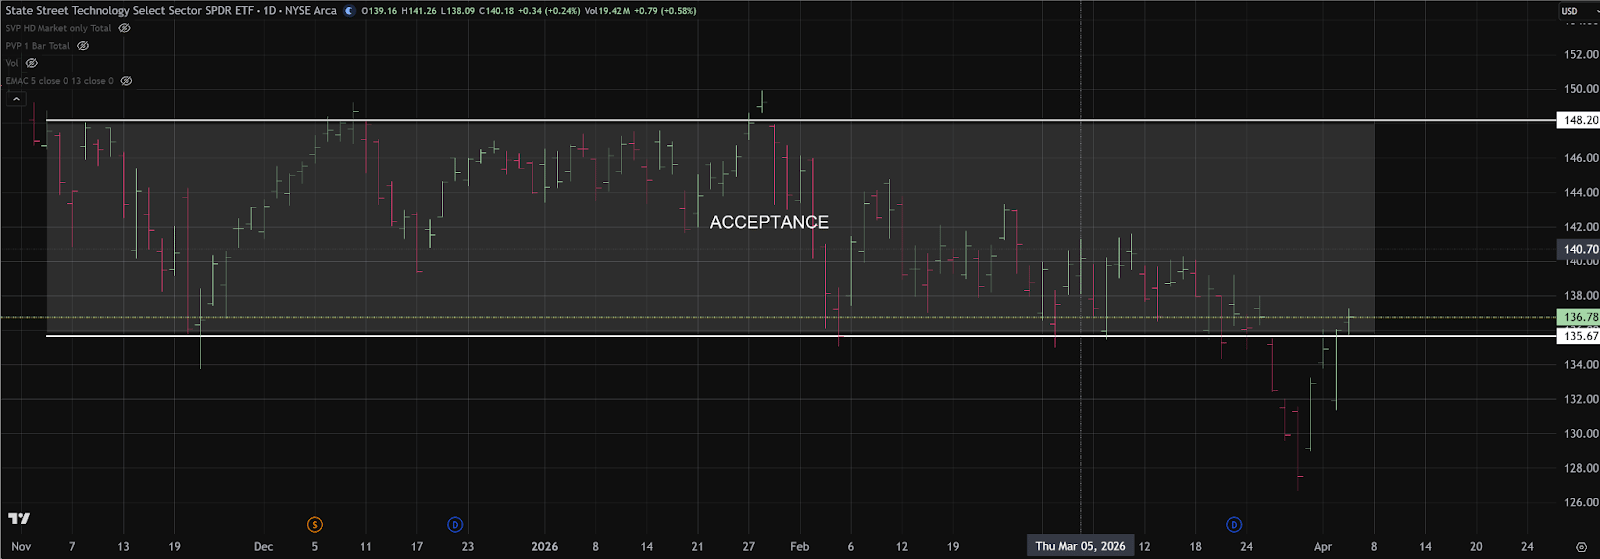
XLK remains in a well-defined multi-month trading range, with sustained two-way auction between roughly 135 support and 149 resistance since November. The recent break below 135 failed to attract meaningful continuation, and last Thursday’s recovery back into the prior value zone signaled renewed acceptance within the established range.
Today’s session further supports that shift, as price held within the lower end of the broader balance area rather than being rejected back out. From a technical perspective, 135 is the key reference. As long as XLK continues to hold above that level, the bias favors range rotation toward the upper extreme near 149.
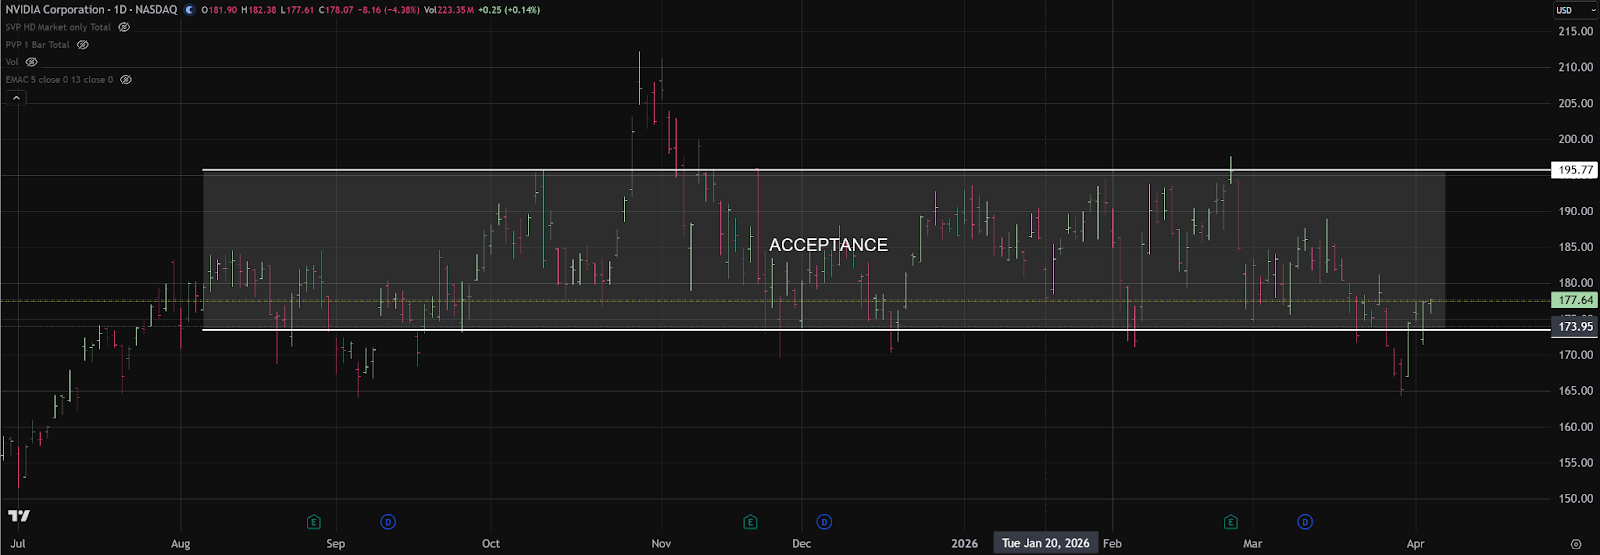
NVDA continues to mirror the broader technical structure seen in XLK, which is notable given its approximate 15% weighting in the sector ETF. Since August, price has largely been contained within a well-established acceptance range between roughly 174 and 195. Although shares briefly broke below the lower boundary, that move failed to gain traction and was quickly reversed, signaling a lack of sustained selling pressure below accepted value.
That swift recovery back into the range suggests the recent breakdown may have been an exhaustion move rather than the start of a new directional leg lower. From a market technician’s perspective, as long as NVDA remains above the 174 area, the setup continues to favor rotation back toward the opposite side of the range, with 195 serving as the key upside reference.
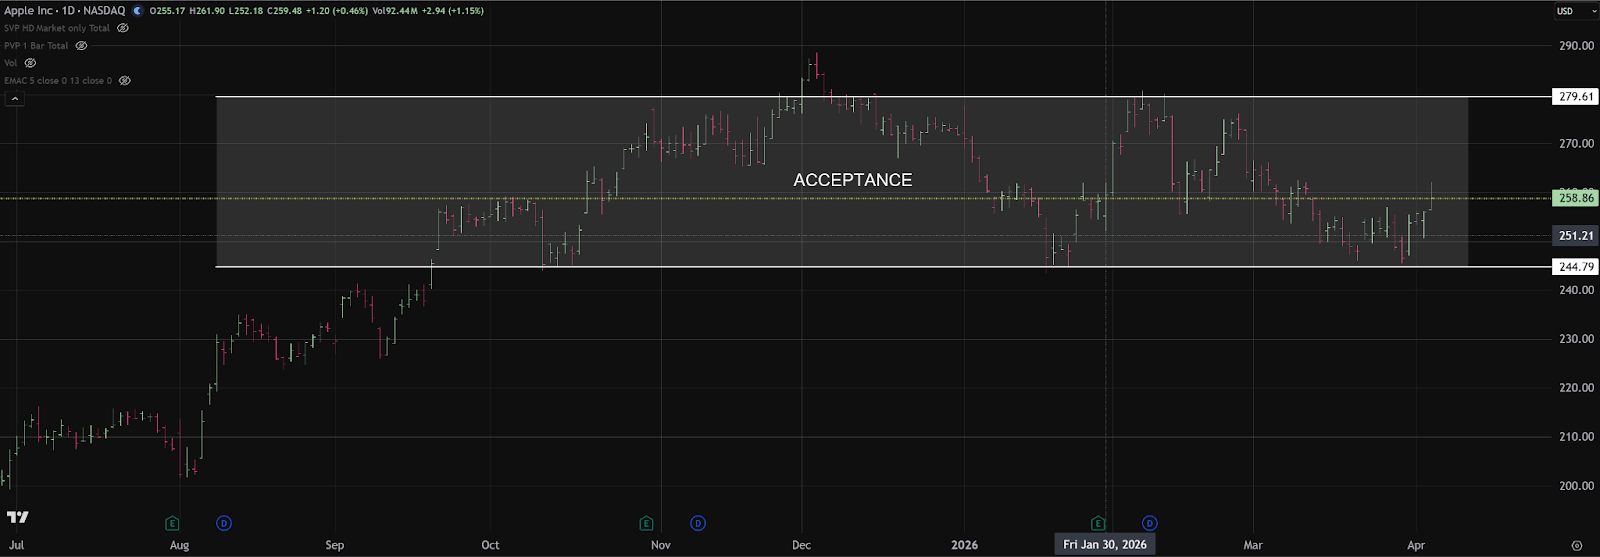
AAPL is showing a similar technical profile, with price spending the last several months auctioning within a clearly defined acceptance range between roughly 245 and 280. Recent weakness tested the lower end of that established value area, but sellers were unable to drive sustained trade below it.
The rebound back into the range suggests the market continues to recognize this zone as fair value rather than the start of a fresh downside trend. From a market technician’s standpoint, the lower boundary near 245 remains the key support reference. As long as AAPL continues to hold above that area, the bias favors further rotation through the range, with the upper extreme near 280 serving as the next major objective.
You can purchase Tom’s Course on Volume Profile here
Market Recap
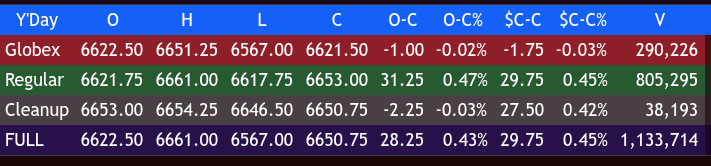
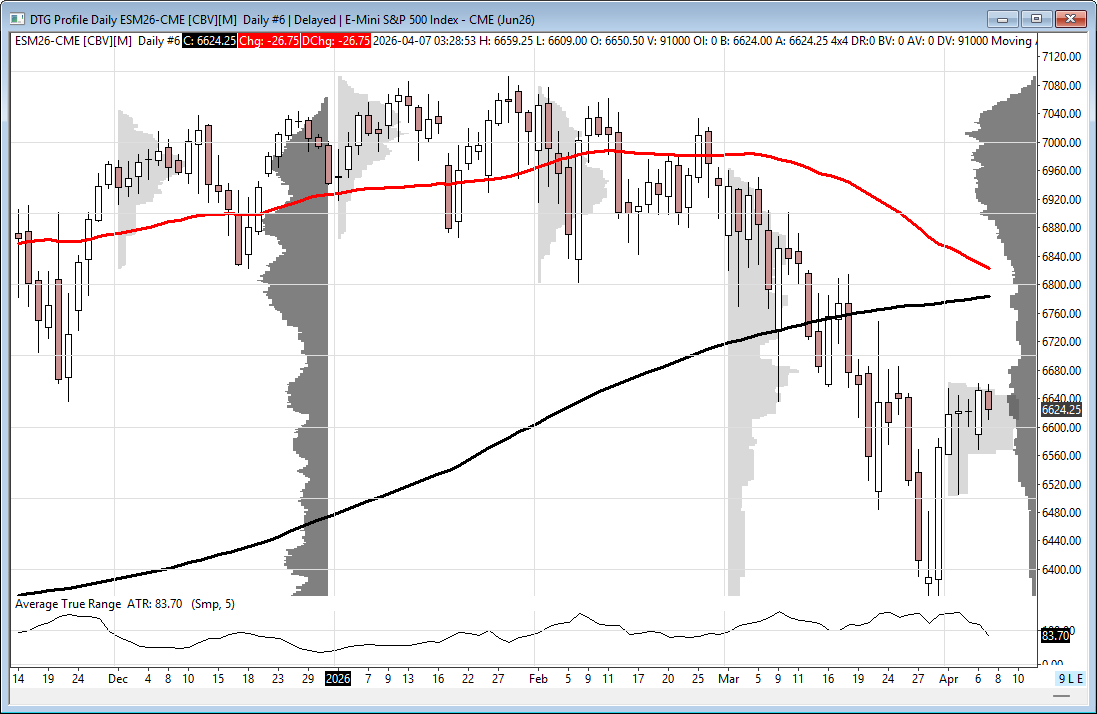
The ES traded down to 6613.25 on Globex and traded up to 6651.25 before opening Monday’s regular session at 6621.75, down 1.5 points.
After the open, the ES traded at 6621.50, rallied up to 6637.25, and pulled back to 6617.75 at 9:35. It made 4 higher lows and then rallied 43.25 points up to 6661.00 at 10:00. It sold off 37.00 points down to just below the VWAP at 6624.00 at 10:05, rallied 30.50 points up to 6654.50, and sold off 23.50 points down to the VWAP at 6631.00 at 10:45.
The index traded up to 6644.25 at 11:00, sold off 17.75 points down to 6626.50 at 11:35, and rallied up to 6644.00 at 12:00. It then traded 6635.75, rallied up to 6649.00 at 12:35, and sold off 30.25 points down to 6618.75 at 1:10. It rallied 25.25 points up to 6644.00 at 1:35, sold off 18.00 points down to 6626.00 at 2:00, and rallied 24.25 points to a 6650.25 double top at 2:25.
It pulled back to 6641.00 at 2:40, back-and-filled on a 4 to 6 point range until 3:45, and traded up to 6651.75. It traded 6651.00 as the 3:50 cash imbalance showed $1.6 billion to buy, and finally traded 6653.00 in the 4:00 cash close.
After 4:00, the ES reached 6654.25, traded down to 6646.50 at 4:15, and flat-lined into the 5:00 futures close. The ES settled at 6651.00, up 47.25 points or +0.72%, down 6.37% YTD. The NQ settled at 24,192.17, up 146.61 points or +0.61%, down 8.52% YTD. The YM settled at 46,946.00, up 168 points or +0.36%, down 7.83% YTD. The RTY settled at 2548.40, up 15.50 points or +0.61% on the day, down 7.94% YTD.
In the end, it was a quiet day of buying the pullbacks. In terms of the index’s overall tone, they were firm. In terms of the ES’s overall trade, total volume was 1.64 million contracts traded, a decrease from the 1.8 million to 2.2 million contract average we have been seeing.
I’m not sure where the Middle East war is going, but so far, Iran is unwilling to negotiate an end to the war because it will not agree to Trump’s 15-point agreement or a 45-day pause in exchange for opening the Strait of Hormuz. Trump reaffirmed his 8 p.m. ET Tuesday deadline for Iran to reopen the Strait of Hormuz, the critical oil shipping lane, warning that failure to comply would result in U.S. strikes on Iranian infrastructure and stating, “The entire country can be taken out in one night—and that night might be tomorrow night.”
He described Tehran’s counterproposal as “a significant step,” but said it was not good enough to secure a cease-fire. According to multiple U.S. officials, the U.S. military is actively preparing for potential strikes on Iranian energy targets.
The president also provided detailed remarks on the dramatic search-and-rescue operation to recover two U.S. airmen from Iranian territory, calling it “a rescue that’s very historic,” while U.S. officials offered few details on how Iranian forces were able to down an F-15E Strike Eagle and damage an A-10 Warthog attack aircraft on Friday.
Trump announced that the United States has launched an investigation into the leak of information about a missing airman to the media and floated the idea of the U.S. imposing a fee on commercial ships passing through the Strait of Hormuz. Iran also rejected Pakistan’s two-phase plan but offered its own 10 -point plan. I keep thinking there will be a deal at some point, but right now it seems like Iran has the upper hand in the negotiations.
-
8:30 am Durable Goods
-
12:35 Chicago Fed President Austin Goollsbee speaks
-
3:00 Consumer Credit
-
5:50 Fed Vice Chair Philip Jefferson speaks
MiM
Market-on-Close Recap – MiM
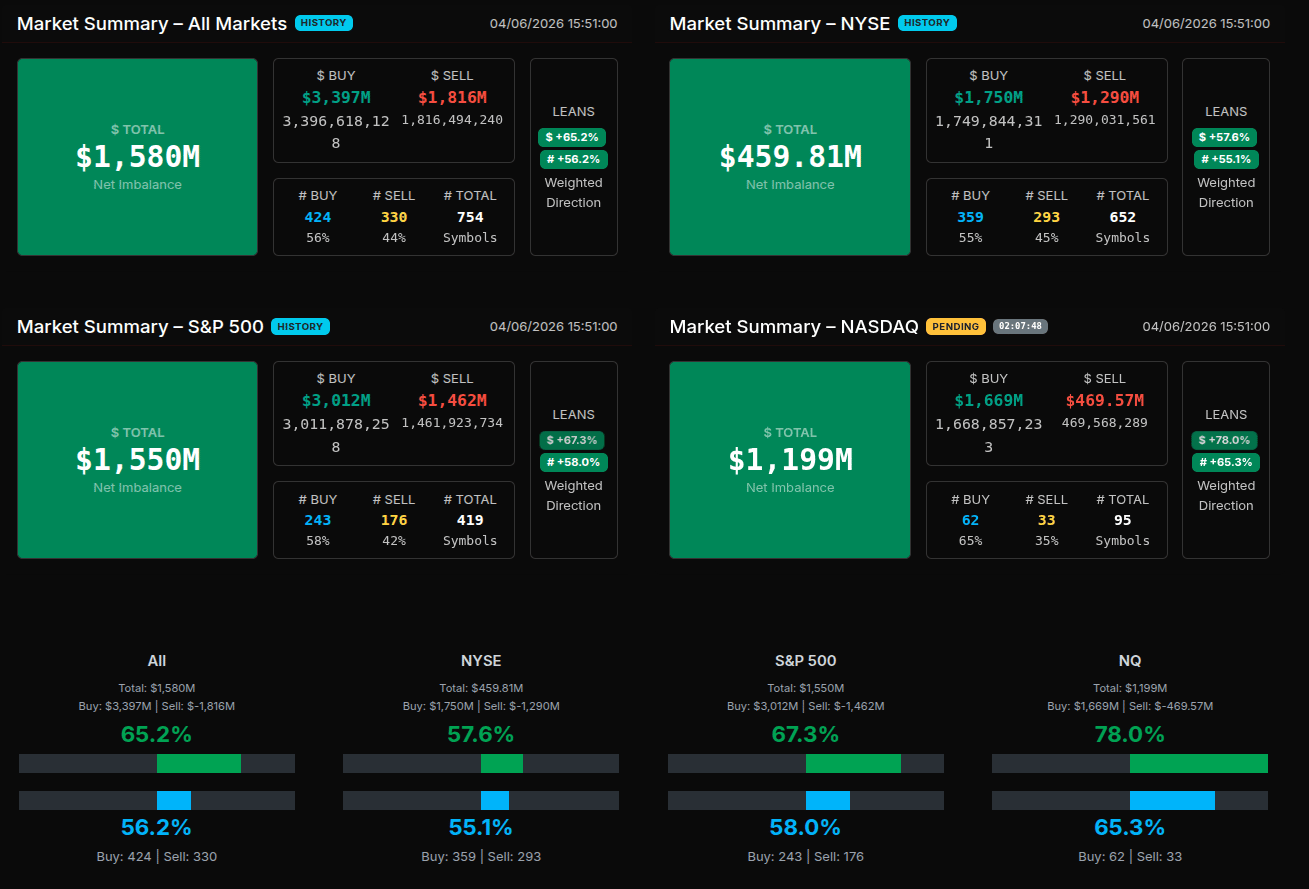
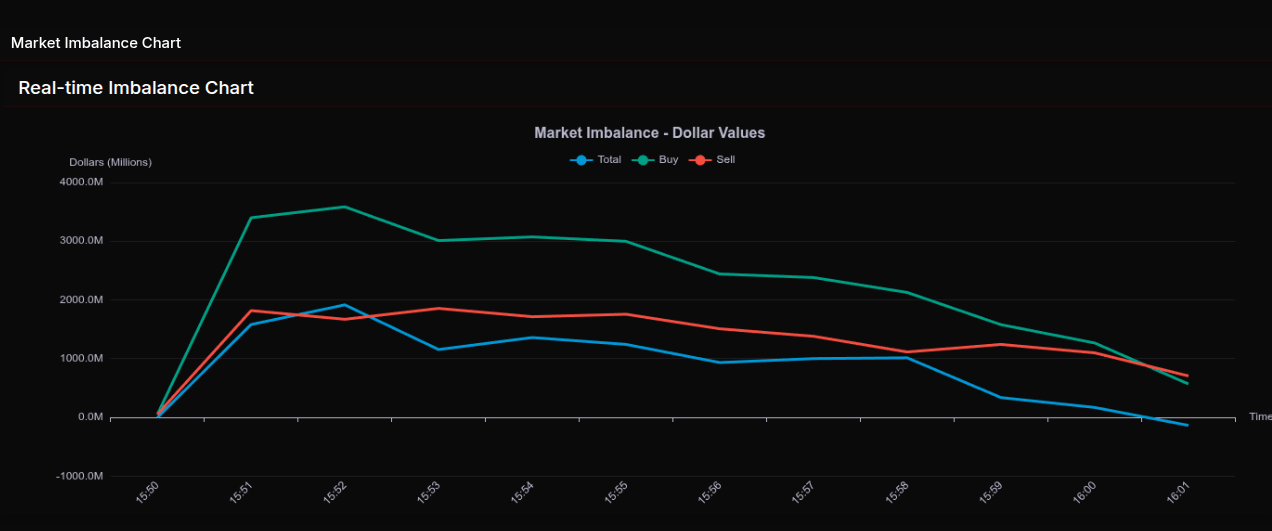
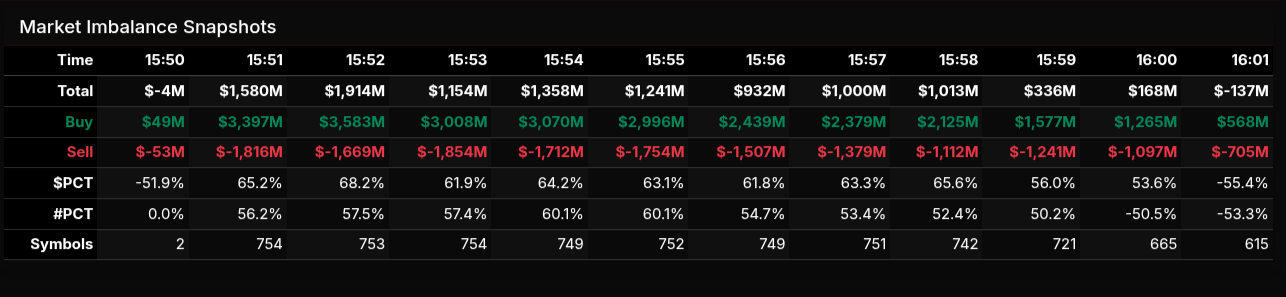
The MOC session opened with a sharp imbalance shift from an initial -$4M reading at 15:50 into an aggressive buy-driven tape by 15:51, where net imbalance surged to +$1.58B. Buy programs immediately dominated, printing over $3.3B versus $1.8B for sale, establishing a clear institutional bid early in the auction window. From 15:51 through roughly 15:55, the tape remained consistently buy-heavy, with $PCT readings holding in the 61–68% range—firmly directional rather than rotational.
As the session progressed, however, the imbalance began to decay. Buy notional steadily declined from peak levels (~$3.5B) down toward ~$2.1B into 15:58, while sell pressure stabilized rather than expanded. This created a compression phase, reflected in $PCT drifting toward the mid-50s by 15:59, signaling a transition from strong directional flow into a more rotational environment. By the close (16:01), the imbalance flipped negative (-$137M), indicating late sell-side dominance and a meaningful reversal in auction pressure.
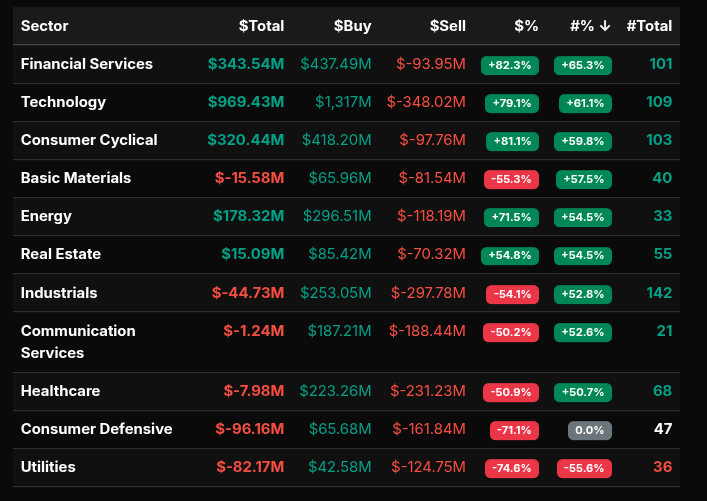
Sector flows were broadly constructive early, with Technology (+79.1%), Financials (+82.3%), and Consumer Cyclical (+81.1%) showing strong buy-side conviction—well beyond the >66% threshold that indicates wholesale accumulation. Energy (+71.5%) also qualified as a strong buy sector. In contrast, Utilities (-74.6%) and Consumer Defensive (-71.1%) exhibited clear institutional selling, both exceeding the -66% threshold, suggesting defensive rotation out of safety.
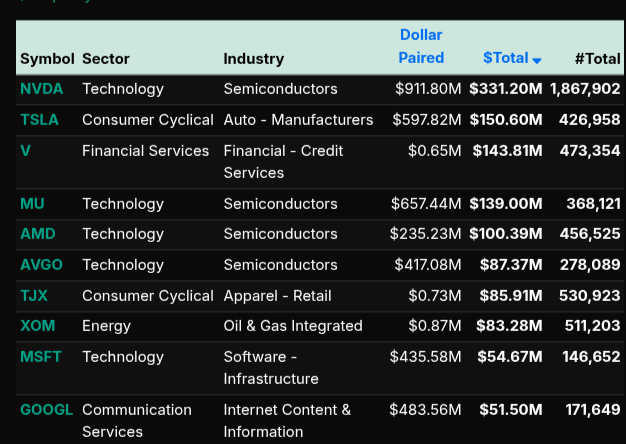
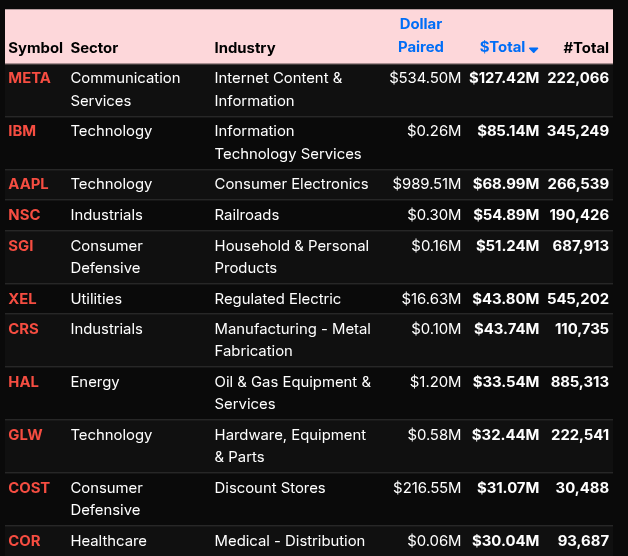
Single-name flows reinforced this bifurcation. On the buy side, NVDA (+$331M), TSLA (+$150M), and V (+$143M) led, alongside semiconductor strength (MU, AMD, AVGO), confirming growth and beta demand. On the sell side, META (+$127M sell imbalance), IBM, and AAPL showed distribution, indicating selective profit-taking within large-cap tech despite broader sector strength.
Overall, the MOC evolved from a strong institutional buy program into a late-stage unwind. Early directional conviction gave way to rotation and eventual sell pressure, highlighting a market that began with aggressive risk-on flows but closed with signs of rebalancing and supply absorption.
Technical Edge
Fair Values for April 7, 2026:
-
SP: 38.93
-
NQ: 169.27
-
Dow: 211.35
Daily Market Recap 📊
For Monday, April 6, 2026
• NYSE Breadth: 60% Upside Volume
• Nasdaq Breadth: 67% Upside Volume
• Total Breadth: 66% Upside Volume
• NYSE Advance/Decline: 63% Advance
• Nasdaq Advance/Decline: 62% Advance
• Total Advance/Decline: 62% Advance
• NYSE New Highs/New Lows: 43 / 22
• Nasdaq New Highs/New Lows: 98 / 82
• NYSE TRIN: 1.09
• Nasdaq TRIN: 0.78
Weekly Breadth Data 📈
For Week Ending Thursday, April 2, 2026
• NYSE Breadth: 59% Upside Volume
• Nasdaq Breadth: 63% Upside Volume
• Total Breadth: 62% Upside Volume
• NYSE Advance/Decline: 75% Advance
• Nasdaq Advance/Decline: 73% Advance
• Total Advance/Decline: 74% Advance
• NYSE New Highs/New Lows: 151 / 305
• Nasdaq New Highs/New Lows: 191 / 734
• NYSE TRIN: 2.00
• Nasdaq TRIN: 1.53
ES & NQ Levels (Premium only)

ES – M26 Levels
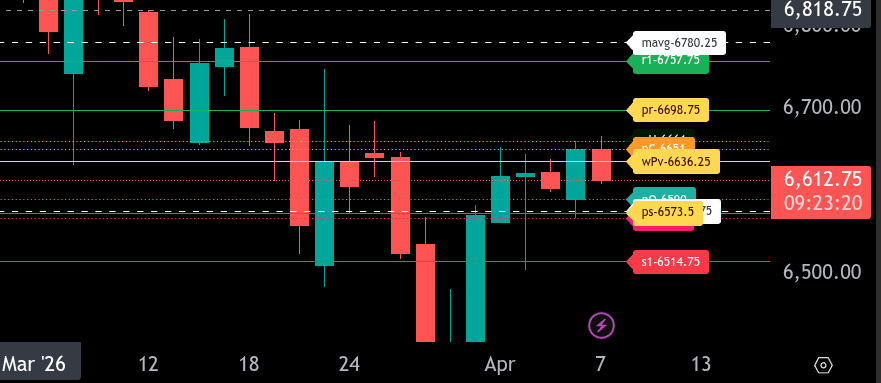
The bull/bear line for the ES is at 6636.25. This remains the key pivot for today’s session. Holding below this level keeps the market in a weaker, sell-the-rally posture, while reclaiming it shifts momentum back toward buyers.
Currently, ES is trading around 6614.25, positioning price below the bull/bear line and signaling early weakness out of Globex. As long as price remains under 6636.25, downside targets come into focus at 6590.00, followed by 6573.75, which is the lower range target for the session. A break below 6573.75 opens the door toward 6567.00 and potentially a deeper test into 6514.75.
On the upside, initial resistance is seen at 6661.00, which aligns with recent structure. If buyers can reclaim 6636.25 and hold, a push into 6661.00 becomes likely, followed by the upper range target at 6698.75. A sustained move above 6698.75 would signal stronger continuation and could extend toward 6757.75.
Overall, the market is leaning bearish below 6636.25, and rallies into resistance are likely to face selling pressure unless that level is reclaimed and held. Price acceptance back above the bull/bear line is required to shift intraday sentiment back to bullish.
NQ – M26 – Levels
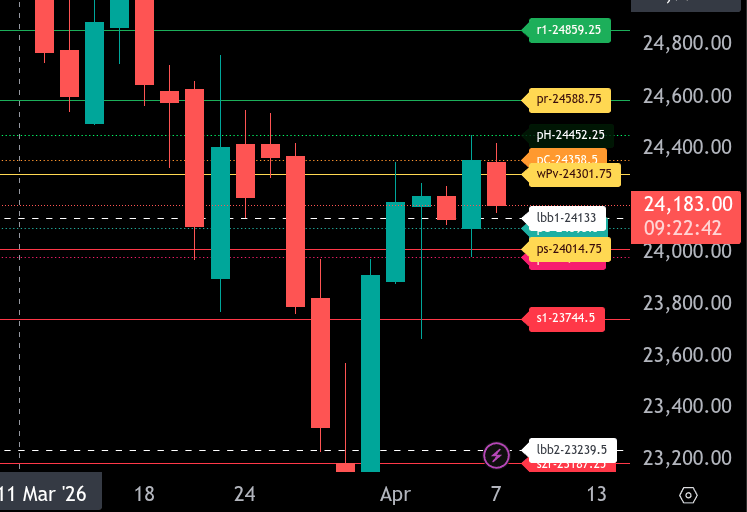
The bull/bear line for the NQ is at 24301.75. This remains the key pivot for today. Holding below this level keeps the market in a bearish posture, while reclaiming it would shift momentum back to the upside.
NQ is currently trading around 24184.75, positioning price below the bull/bear line and indicating continued overnight weakness. As long as price remains under 24301.75, sellers are in control and we look for downside continuation.
On the downside, the first key support sits at 24133.00, followed by 24093.50. A break below these levels opens the door to 24014.75, which is the lower range target for today. If that level fails, extension toward 23981.50 is likely, with further downside risk toward 23744.50 if selling accelerates.
On the upside, resistance comes in at 24358.50, followed by 24452.25. A reclaim and hold above the bull/bear line at 24301.75 would target 24452.25 and then 24588.75, which is the upper range target for today. Sustained acceptance above 24588.75 would signal a stronger reversal structure.
Overall, the market remains bearish below 24301.75. Any rallies into resistance should be treated with caution unless price can reclaim and hold above the bull/bear line. Continued acceptance below 24133.00 increases the probability of testing the lower range targets.
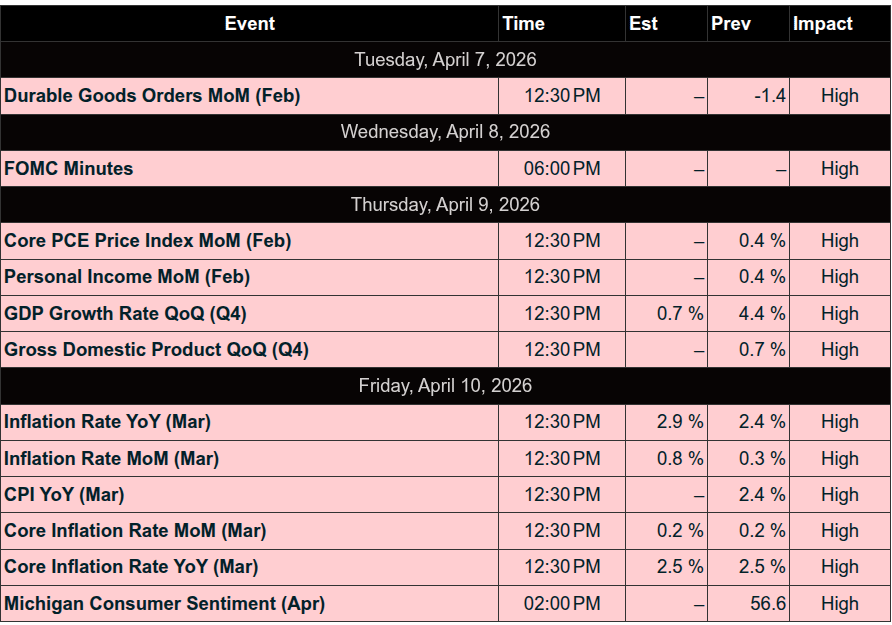
Calendars
Economic Calendar
Trading Room Summaries
Important nuance for entries in rotational markets
Polaris Trading Group Summary – Monday, April 6, 2026
Monday was a textbook Cycle Day 2, and the room did a solid job recognizing the environment early and adapting expectations accordingly.
Market Context & Open
-
Overnight gave a classic Sunday Globex dip (around 6575) that was quickly bought, recovering back toward 6650.
-
Key backdrop:
-
Europe closed (Easter Monday) → reduced participation
-
Expectation: smaller range, rotational behavior
-
-
David confirmed:
-
Cycle Day 2 → balance/consolidation
-
Ultimately played out as a clean, delta-shaped profile
-
Big theme: Conditions mattered more than forcing trades.
Trade Themes & Execution
-
Early focus on:
-
VWAP bounces
-
D-level interactions (reclaims > holds)
-
Awareness of tight range vs. 10-day ATR
-
-
Market behaved as expected:
-
Choppy, rotational
-
Respecting levels but lacking follow-through
-
AVWAP from Sunday low acted as support repeatedly
-
Standout Trade
-
Barbara’s A10 Trade
-
Executed a sell stop below market
-
Clean entry + exit at ATR Bull 10
-
Recognized by David as a “Nice A10 trade”
-
This was the ideal trade for the day’s conditions:
-
Mechanical
-
Level-based
-
No need to predict direction
Key Levels & Structure
-
“Big Pin” (options influence):
-
SPX: 6600–6605
-
ES equivalent: 6640–6645
-
-
Late-day:
-
$1.6B MOC Buy Imbalance
-
-
Reinforced the magnet / pinning effect in a balanced day
Education & Insights
Several strong lessons reinforced throughout the session:
1. Reclaims > Holds
-
David emphasized:
2. Match Strategy to Environment
-
Traders identified:
-
“Ranging day → stay out” (Peter)
-
-
This is professional behavior:
-
Not every day is tradable for every system
-
3. Patience Over Activity
A great quote shared:
“Amateurs look for challenges. Professionals look for easy trades.”
This perfectly matched the day:
-
Best opportunities were quick, defined setups
-
Overtrading = getting chopped
4. Value of Deep Study
-
Strong endorsement of:
-
1-on-1 coaching
-
Backtesting (even using tools like AI)
-
-
Reinforces PTG principle:
-
Understanding the “why” beats memorizing setups
-
Psychology & Awareness
-
Traders showed growing maturity:
-
Recognizing low-quality conditions
-
Avoiding forcing trades
-
Focusing on specific setups only
-
-
Also notable:
-
Awareness of headline noise (Iran news, Trump speech)
-
Many acknowledged:
-
News = distraction unless it drives structure
-
-
Overall Takeaway
This was a discipline day, not a hero day.
The market gave:
-
Clean structure
-
Limited range
-
Rotational behavior
The best performers:
-
Took mechanical trades (like A10)
-
Or stayed patient and selective
Biggest lesson:
Knowing when NOT to trade is just as important as executing well.
Discovery Trading Group Room Preview – Tuesday, April 7, 2026
-
Macro Focus – Middle East:
Markets remain focused on the Middle East as Trump’s Iran deadline approaches. Messaging has been inconsistent—ranging from escalation to more conciliatory tones—leaving markets cautious but slightly optimistic on potential diplomacy. -
Energy / Oil:
Risk remains elevated around the Strait of Hormuz. JPMorgan warns gas prices could exceed $5/gallon if disruptions persist. Current prices are ~$4.12, up sharply over the past month. -
Equities / Semis:
Samsung posted a major profit surge driven by AI memory demand (HBM/DRAM). Supply remains tight, reinforcing bullish momentum in the AI chip space. -
Economic Calendar:
-
ADP Employment (8:15am ET)
-
Durable Goods (8:30am ET)
-
Consumer Credit (3:00pm ET)
-
Goolsbee speaks (12:35pm ET)
-
Earnings tomorrow: DAL, RPM
-
-
Volatility / Flow:
-
Volatility declined (5-day ADR ~119.75)
-
No strong whale bias (light, mixed flows)
-
-
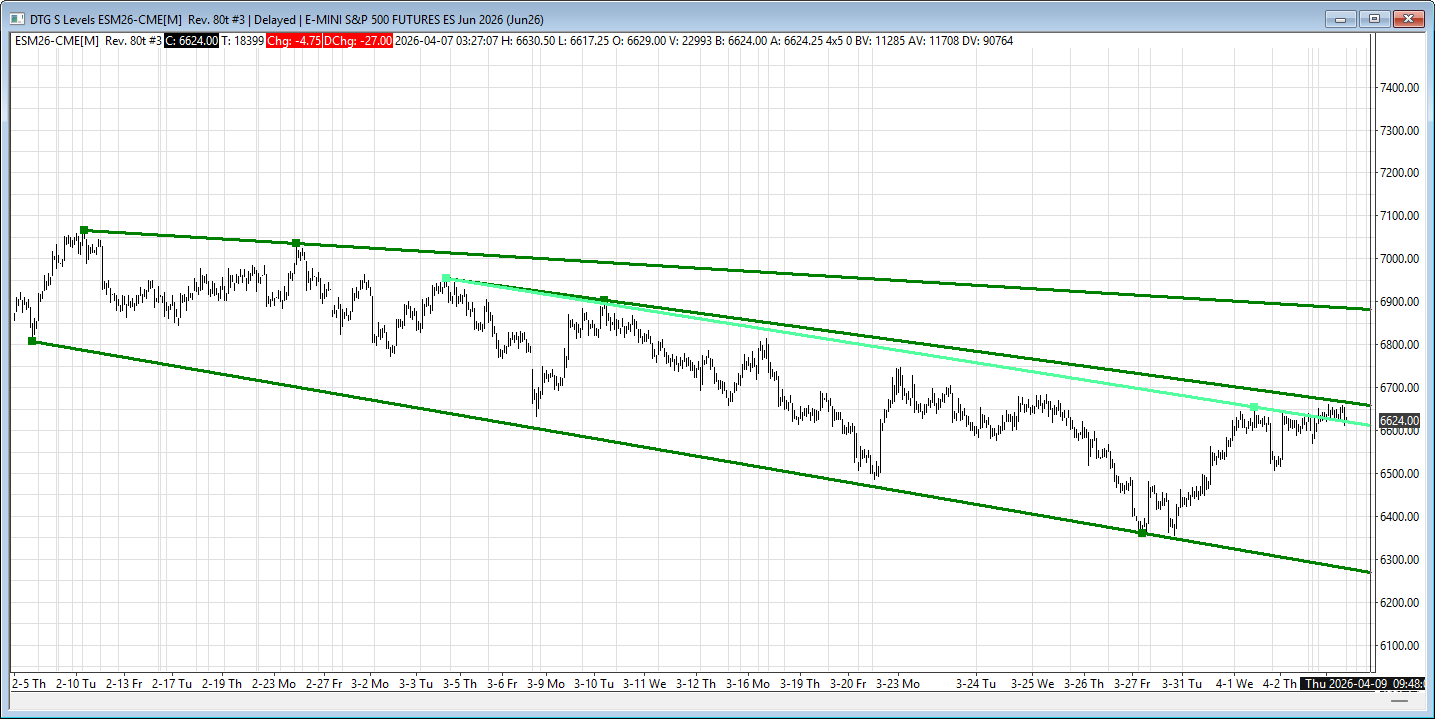
Technical (ES):
-
Broke above short-term downtrend (~6619), now acting as support
-
Break above secondary trendline opens ~+200 pts upside
-
Failure back into channel opens downside toward ~6267
Key Levels:
-
Resistance: 6670, 6885
-
Support: 6619, 6267
-
Bottom line: Market is at a key inflection point—technicals are stabilizing, but direction will be driven by geopolitics and energy risk.
Affiliate Disclosure: This newsletter may contain affiliate links, which means we may earn a commission if you click through and make a purchase. This comes at no additional cost to you and helps us continue providing valuable content. We only recommend products or services we genuinely believe in. Thank you for your support!
Disclaimer: Charts and analysis are for discussion and education purposes only. I am not a financial advisor, do not give financial advice and am not recommending the buying or selling of any security.
Remember: Not all setups will trigger. Not all setups will be profitable. Not all setups should be taken. These are simply the setups that I have put together for years on my own and what I watch as part of my own “game plan” coming into each day. Good luck!
This post goes out as an email to our subscribers every day and is posted for free here around 2 PM ET. To get your real-time copy, sign up for the free or premium version here: Opening Print Subscribe.
Comments are closed