Follow @MrTopStep and @BretKenwell on Twitter and please share if you find our work valuable.
Our View
After a solid rebound on Thursday, the ES posted its worst week of the year. The ES and NQ were weak going into January’s PCE reading, which overshot economists’ expectations. We have written it 9 other times this month, but what’s it matter if we do it 10 times.
The hot PCE number comes after a hot CPI and PPI result and a robust January jobs report at the start of the month.
I know people are still holding out hope the Fed will start to lower rates this year, but for that to happen, the Fed needs to first stop raising rates! At least for now, that’s not going to happen.
Our Lean
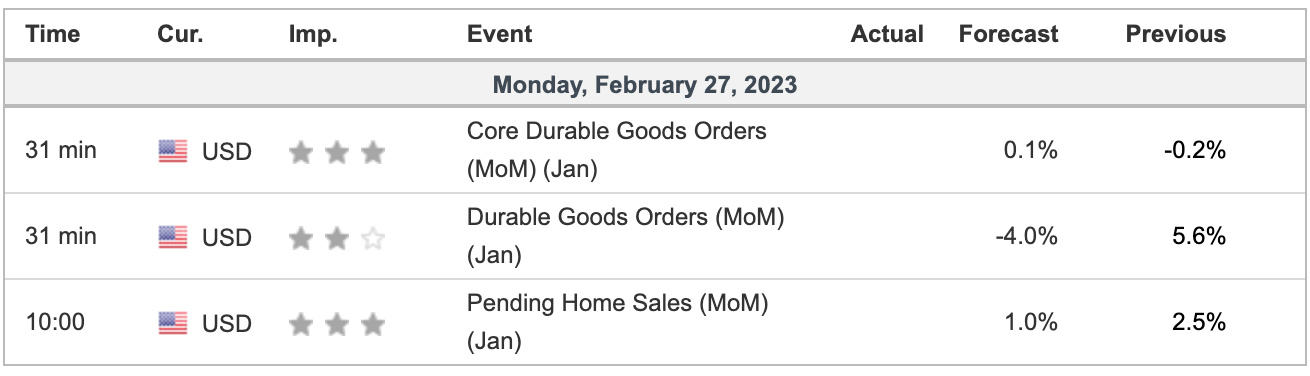
There are a few key economic reports out this week and more Fed speak (keep in mind, no Jobs report on Friday. It will come on March 10 instead). Today, we have the durable goods and pending home sales on tap.
There are two trading days left in February. Ultimately, our 3950 support level held and the ES closed ok. My guess is we see some type of bounce. Ultimately though, I don’t think this decline is over.
According to the Stock Trader’s Almanac, the end of February has been closing miserably. However, the first trading day of March has the S&P up 16 of the 23 and is historically strong in the beginning of the month.
Our Lean: If the ES gaps up, my lean would be to fade the open. 4020 to 4030 is resistance to my eye, followed by the 10-ema. On the downside, 4000 has to hold, otherwise 3973-75 is on deck, followed by 3947-50.
MiM and Daily Recap
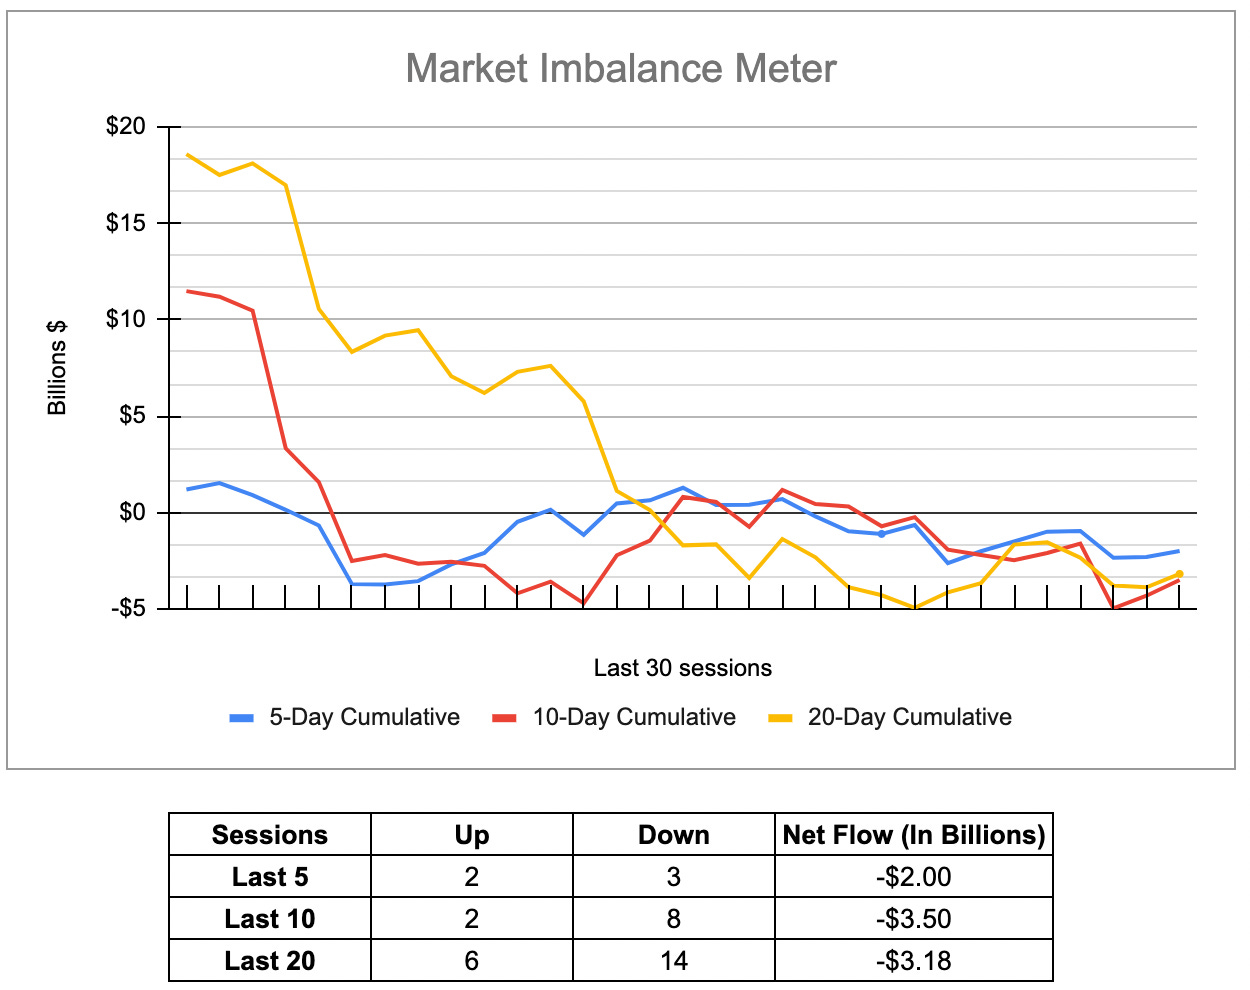
The ES sold off down to 3961.50 on Globex and traded 3965.25 at the 9:30 ET futures open. After the open, the ES traded up to 3978 at 9:40, then traded down to the low of the day at 3947.50 10:55. From there it traded up to 3978.50 at 11:50, broke back down to 3954 at 1:10 and then traded to a new high of the day at 398 at 3:00.
The ES traded 3962 as the 3:50 cash imbalance showed $2.6 billion to sell and traded 3977.75 at the 4:00 cash close. After 4:00, the ES traded between 3976 and 3972.75 and settled at 3974.50 on the 5:00 cash close.
In the end, it was a very choppy trade. In terms of the ES’s overall tone, it shook off the early selling but still struggled until a late day ramp. In terms of the ES’s overall trade, volume was slightly higher at 1.97 million contracts.
Technical Edge —
-
NYSE Breadth: 27% Upside Volume
-
Advance/Decline: 28% Advance
-
VIX: ~$21.75
Last week was messy in the markets, but clean on the charts. Does that make sense? First, 4000 held as support and gave us a bounce. A few days later on Friday we were looking at 3950, “where it should find — at the very least — temporary support.”
It traded 3947.50 and bounced, closing near the 3975 level with 4000 back in play as of 8 a.m. ET.
So what now?
S&P 500 — ES
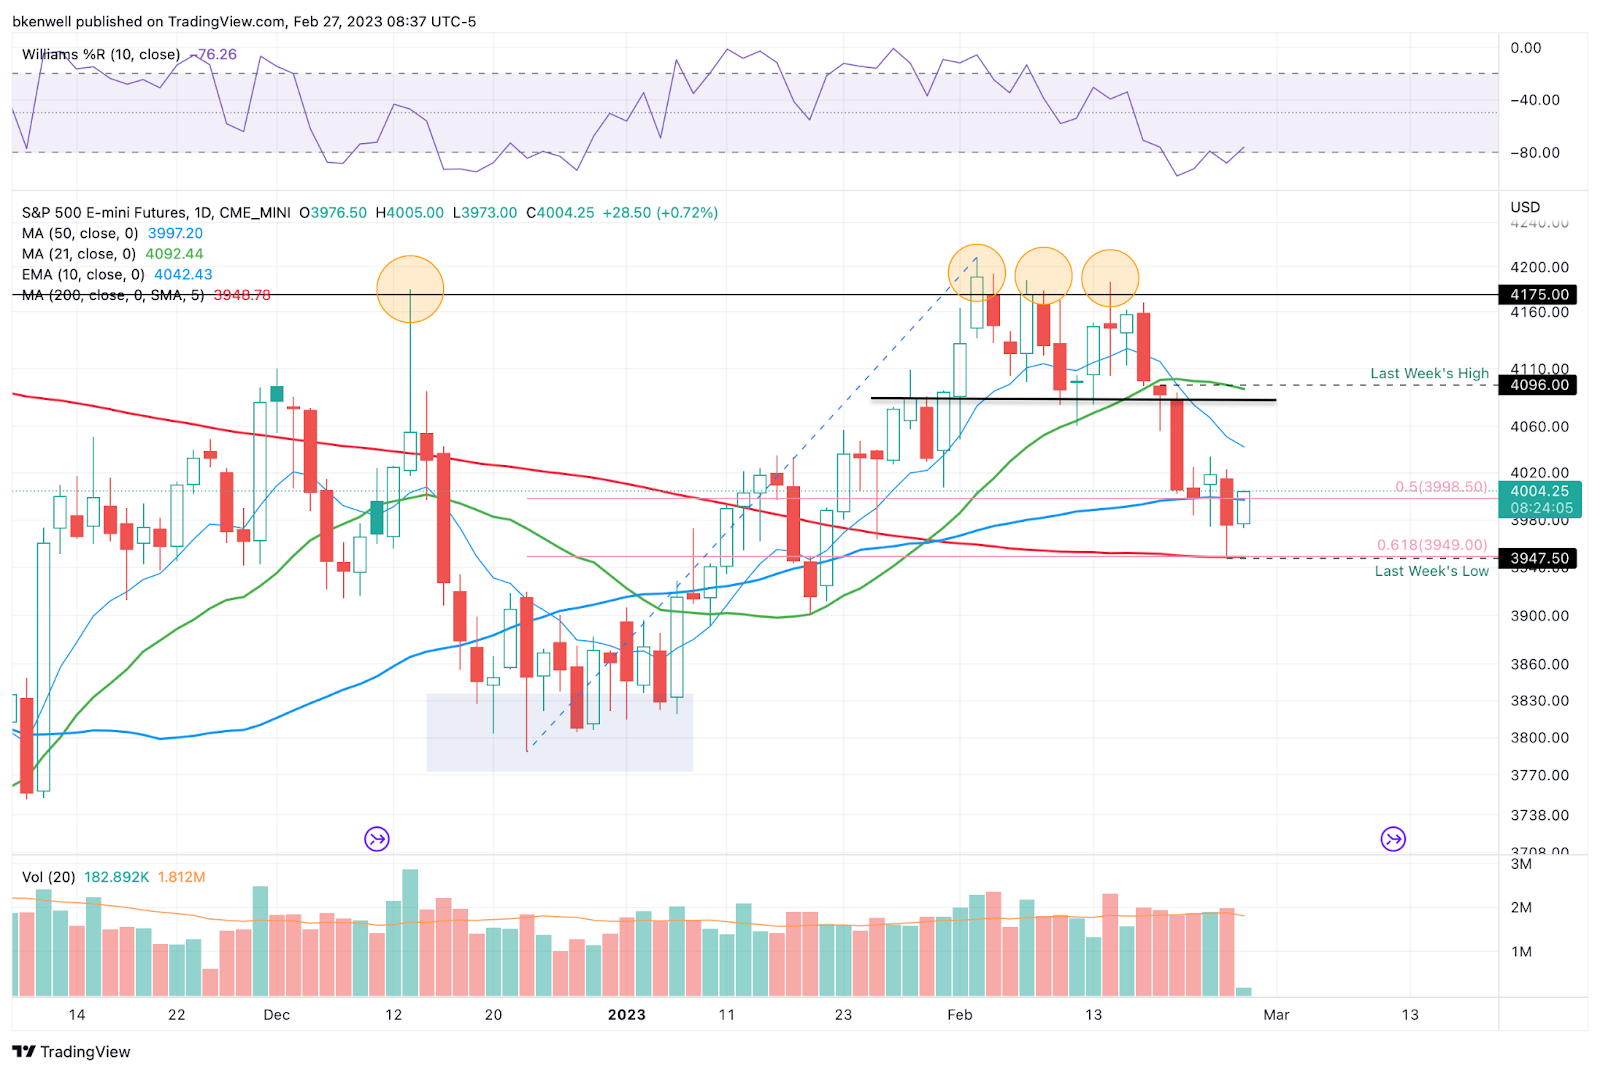
Let’s talk about the bigger picture here for a second. The 4175-ish area held as resistance, despite several attempts to clear this zone.
We’ve lost the 10-day and 21-day moving averages, but are holding some of the bigger MAs (like the 50-day and 200-day). We’ve also now retraced 61.8% of the move from the Dec. lows.
So there are definitely some “concerns” on the chart, although after three straight down weeks and testing a major level, a short-term bounce could certainly be in the cards.
Zooming In
As we take a closer look at the chart, 4020 to 4030 was a notable resistance level last week. I expect this area to be initial resistance if we see it. Above it and the 10-day ema could be in play.
If the ES can’t hold 4000, ~3975 remains in play. If we somehow lose 3973 and can’t regain it, 3950 is back in play.
SPY
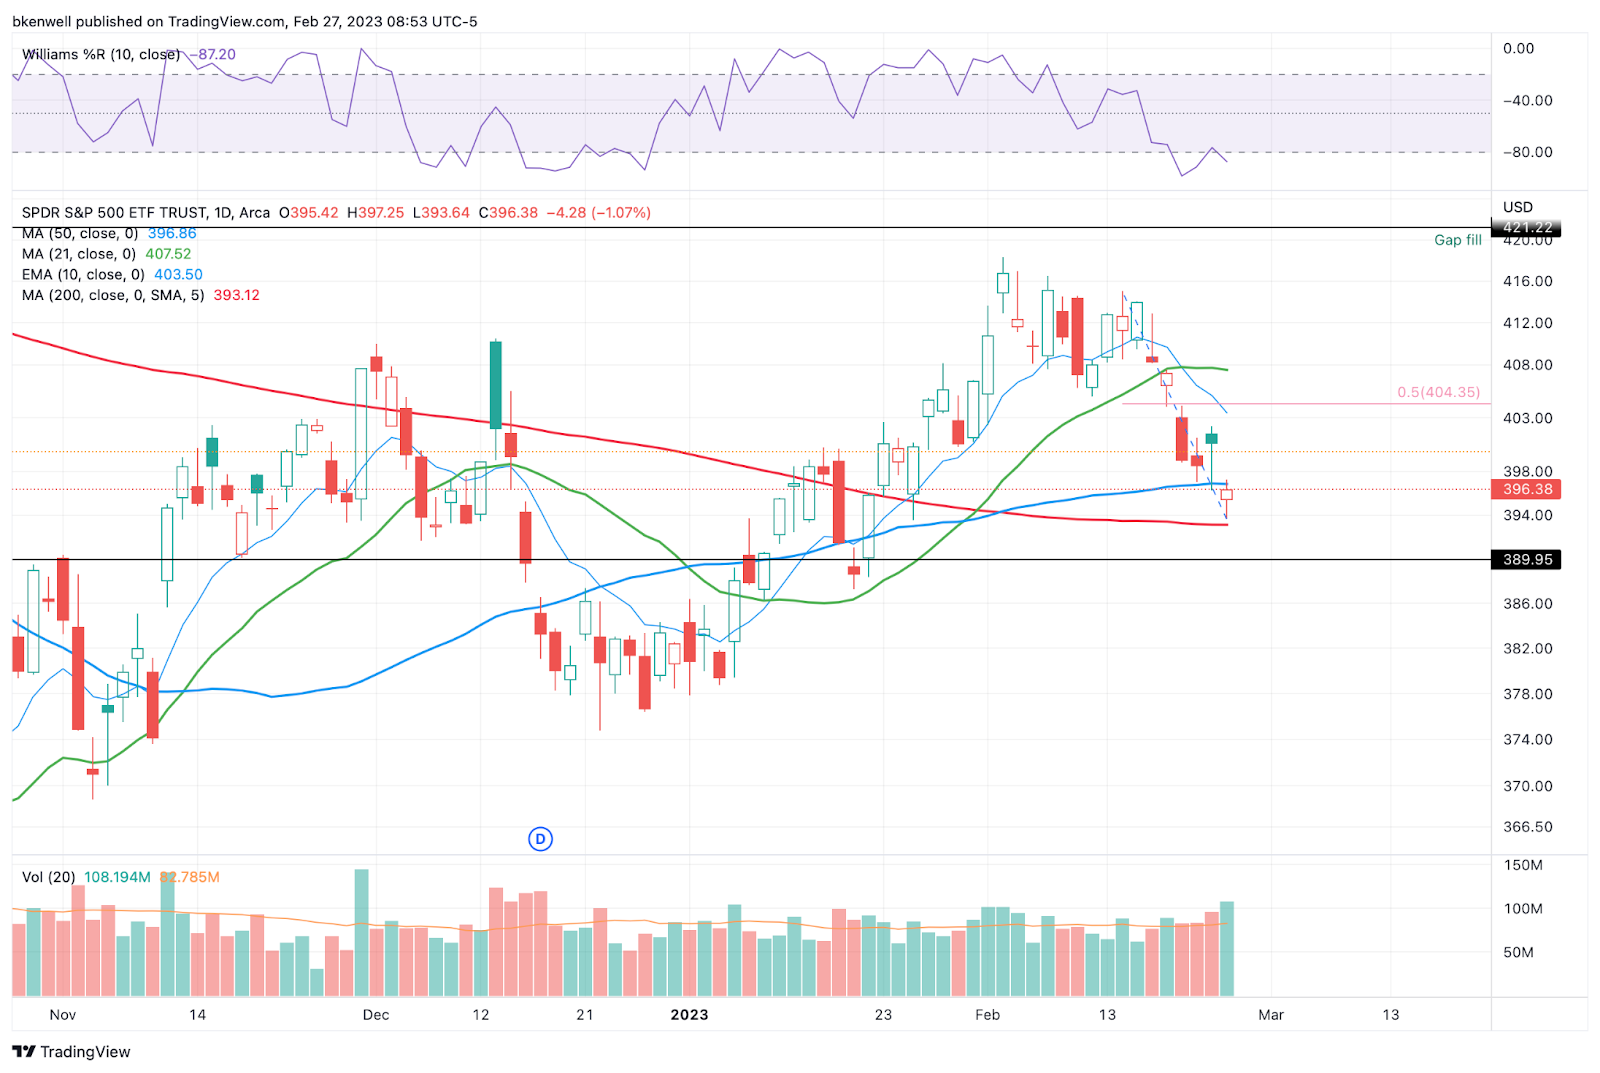
The SPY ended well off the low on Friday and is now trading notably higher on Monday. The old bear-market rule of, “markets tend to rally early in the week” has me a little leary as to chasing such a big move.
The SPY is trading just under $400 as I type. This level could be a line-in-the-sand.
Below it and we could at least fill this morning’s gap back down to $397.25. Above $400 and Thursday’s high — maybe? — could be in play up near $402.20.
Ultimately though, I’m not interested in micro-managing this one. If the SPY can clear and hold $400, my attention is more focused on the 50% retrace near $404 and the declining 10-ema, even if that takes a day or two to materialize.
PFE
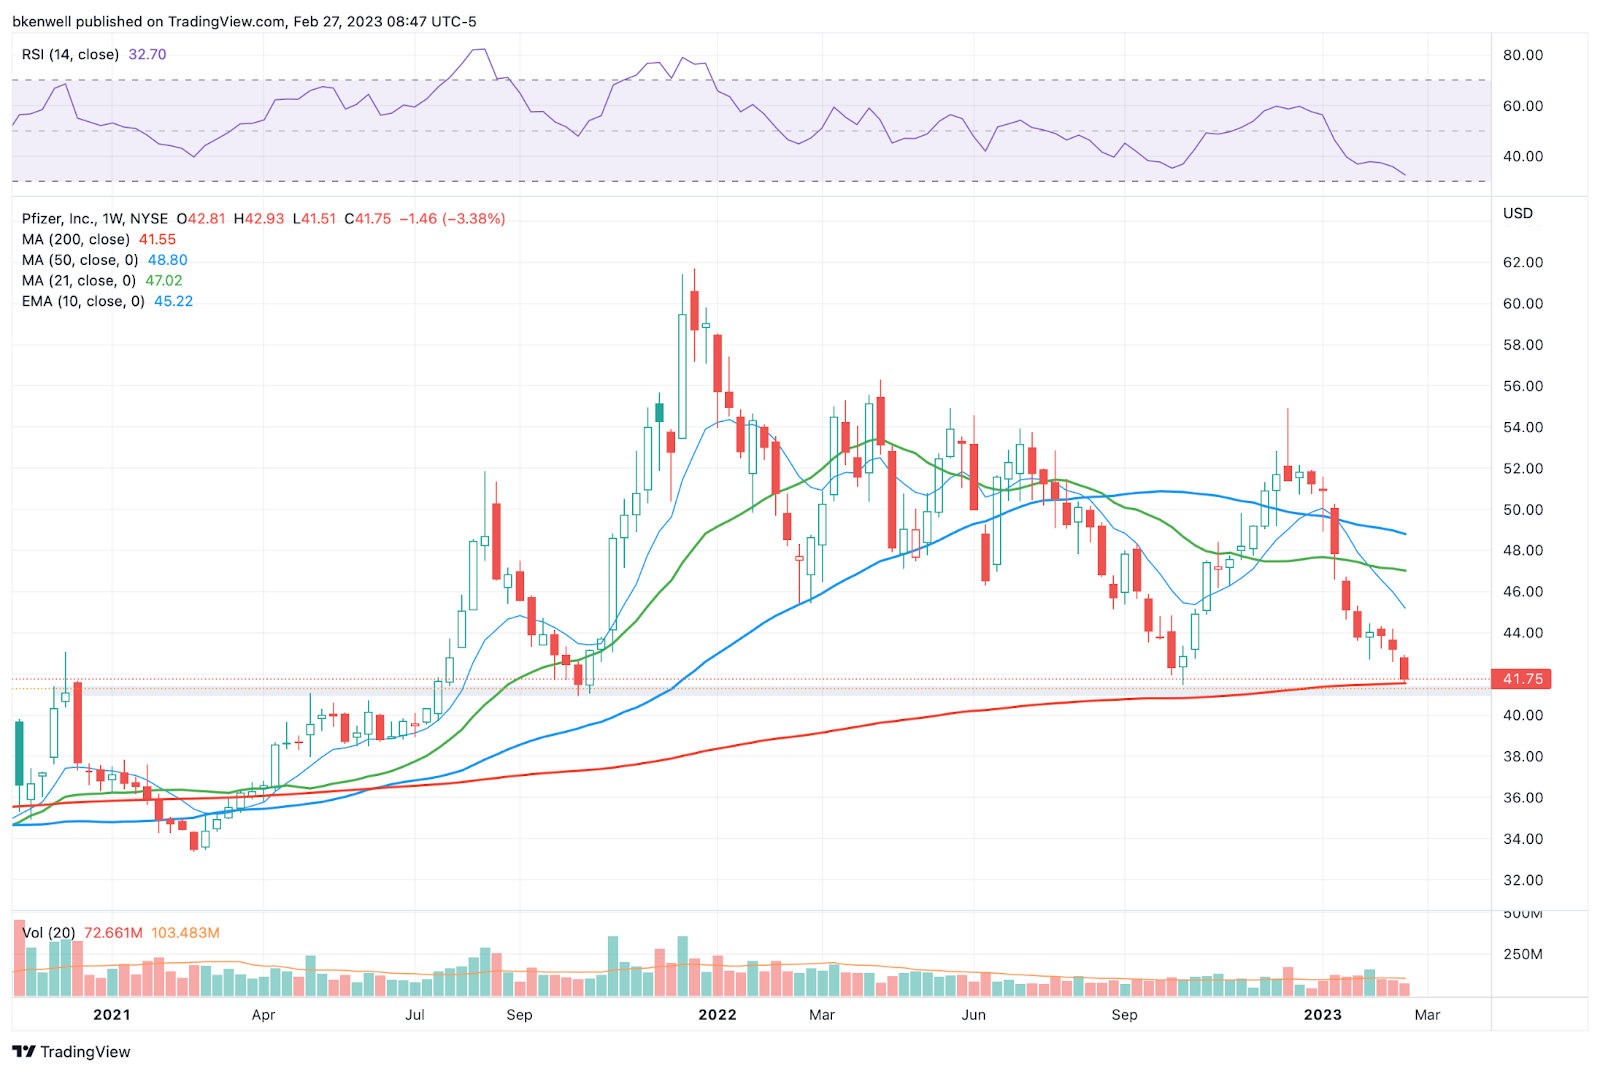
PFE coming into a long-term support level and 200-week sma. It’s not everyone’s cup of tea, but with a ~4% yield and trading at about 11 times earnings, it may appeal to some long-term buyers’ appetite.
Gapping down now, see if PFE can regain last week’s low of ~$41.50. That could put a low-risk reversal in play, after it decline in 8 of the last 9 weeks.
Open Positions
-
Bold are the trades with recent updates.
-
Italics show means the trade is closed.
-
Any positions that get down to ¼ or less (AKA runners) are removed from the list below and left up to you to manage. My only suggestion would be B/E or better stops.)
-
** = previous trade setup we are stalking.
-
MRK — Long from ~$110 — Initial stop can be as tight at $108 or as loose as $105, (trader’s preference). Initial target for ⅓ trim is $112.50.
-
DD — Long from $72.50 (starter buy at $72.25, added at $72.75 when alert when out) —
-
Stop at $71. First target $74 to $75 (ideally $74.50+)
-
-
JNJ — This will be the only mention of JNJ but I do have a long position based on Friday’s setup into long-term support. Not a trade, but a long-term position. Thanks
Go-To Watchlist
*Feel free to build your own trades off these relative strength leaders*
Relative strength leaders →
-
AQUA
-
AEHR
-
GE
-
NVDA, TSLA
-
SBUX
-
MELI
-
WYNN, LVS
-
AXP
-
BA & Airlines — AAL, DAL, UAL
-
TJX, ULTA, NKE
-
CAT
-
HCCI
-
XLE — XOM, CVX, COP, BP, EOG, PXD — (Weekly Charts)
Economic Calendar
No responses yet