Follow @MrTopStep and @BretKenwell on Twitter and please share if you find our work valuable.
Our View
Interest rates are on the rise. Or at least, that’s the expectation. To quickly recap the last four weeks, the January jobs report came in stunningly hot (more than double economists’ expectations). Then the CPI, PPI and PCE reports all came in hot.
In other words, inflation is not dying down the way the Fed had hoped.
At the start of the year, the assumption was that the Fed would do two 25 basis point hikes, pause, and then cut rates by year-end.
That’s no longer the case.
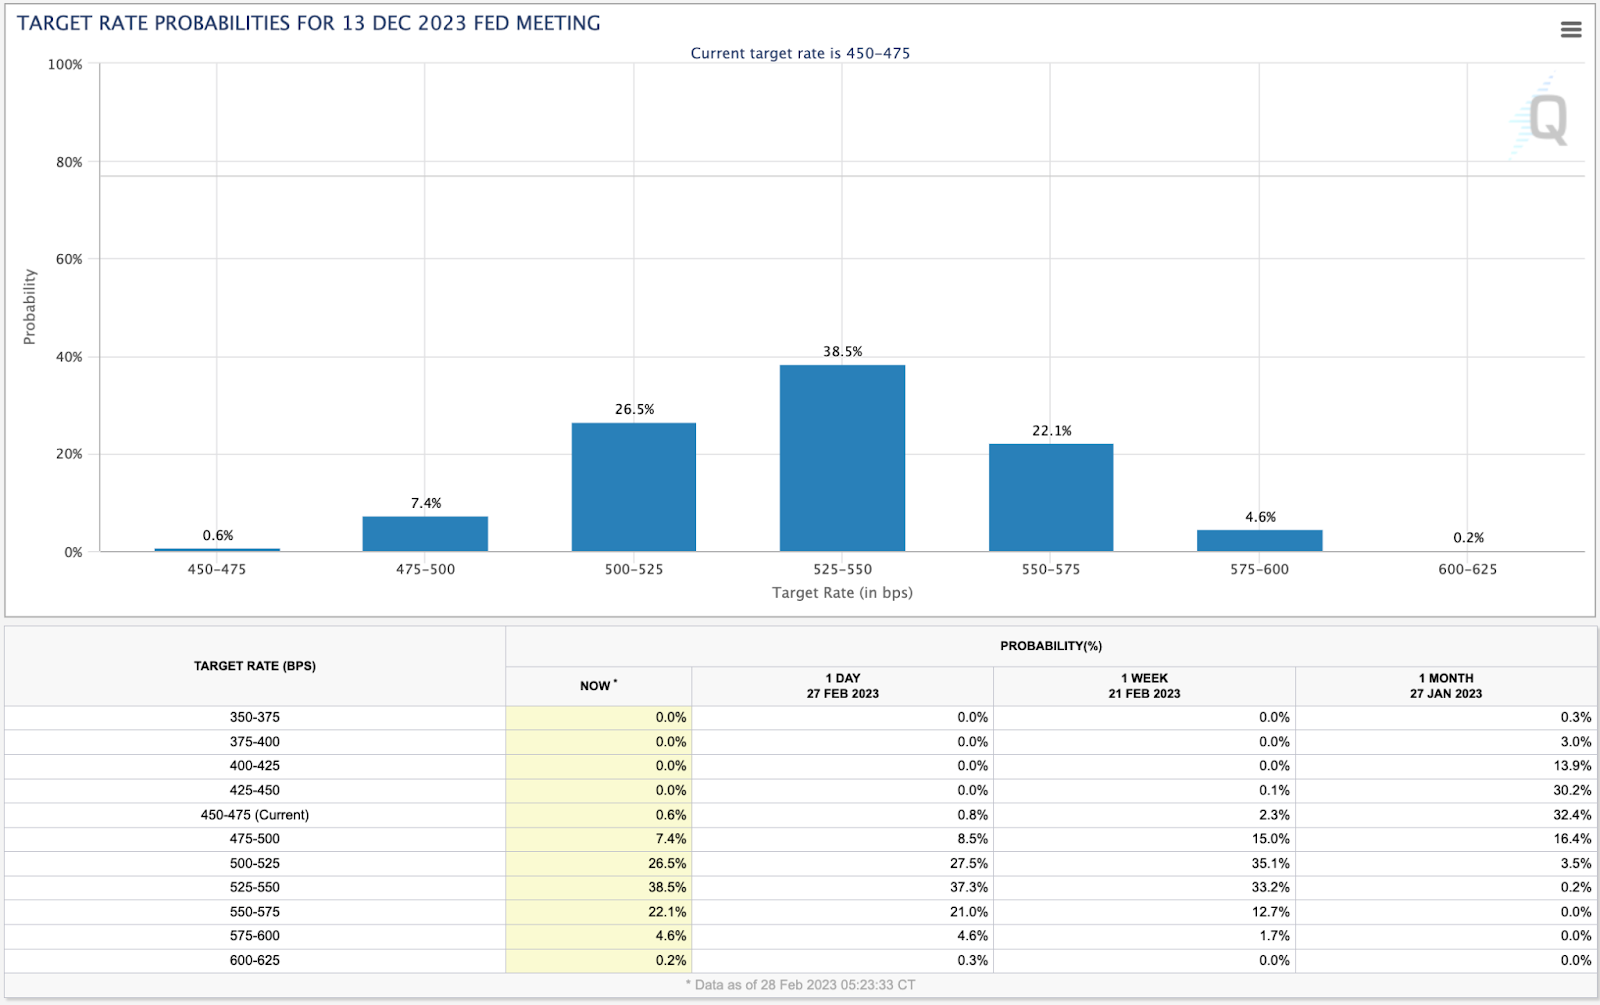
By June, the Fed Funds Futures market is pricing in 75 basis points worth of increases from today’s levels (to a range of 5% to 5.25%). A month ago, that expectation stood at just 3.7%. Now it’s the base case.
By year-end, the market expects rates to be unchanged from the June levels.
In other words, hike into the summer and then no rate cut. A month ago, expectations for this scenario stood at just 0.3%. Expectations also called for rates at year-end to be at the same level that they are today (at 4.5% to 4.75%).
“Higher for longer” may not pan out. I think it will, because inflation is proving to be quite stubborn and the US consumer continues to spend rather freely. If it does pan out and the Fed is forced to go higher than the market previously thought and hold there for longer, then that’s a notable market headwind.
Our Lean
Yesterday, Our Lean was to fade the early strength, with a keen eye on 4020 to 4030. Monday’s high for the ES? 4024.75. Remember the old bear-market rule of, “markets tend to rally early in the week.” That’s why we said yesterday that we are “a little leary as to chasing such a big move [rally].”
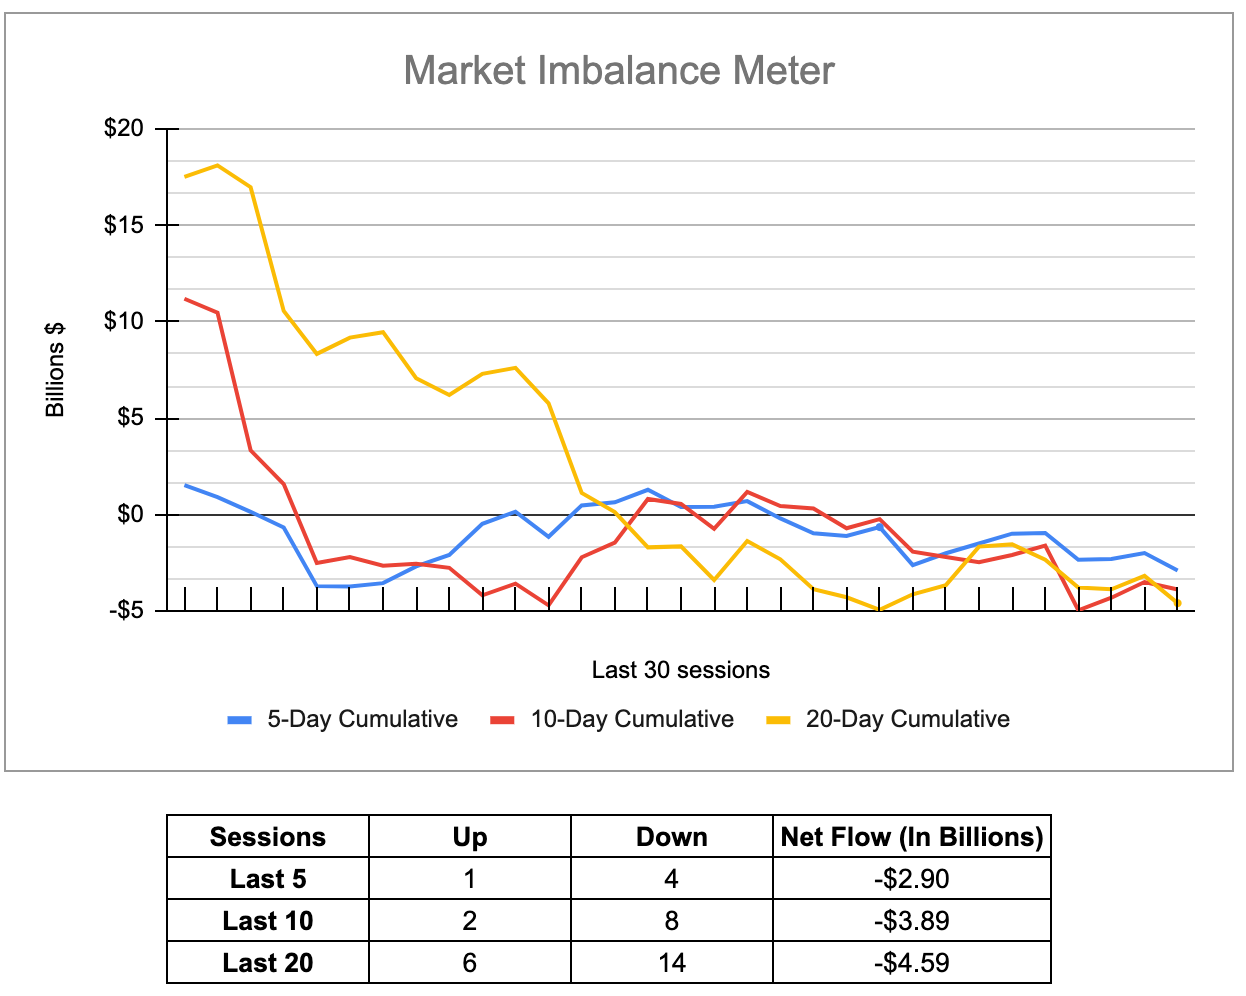
In any regard, it’s the last day of February, so you can expect some big MIM flow on the close. According to my friend Jeff Hirsch at Stock Trader’s Almanac, the last day of February doesn’t tend to be very good. Specifically:
February’s last trading day is historically bearish. The DJIA and S&P 500 have been down 8 straight and in 10 of the last 11. The Nasdaq has bucked the trend, up in each of the last 3 years.
However, it’s a potential setup for the historically bullish first trading day of March.
Our Lean: The US dollar, 10-year yield, interest rate expectations and seasonal statistics have me leaning to the sell side today. That said, the bears are getting a little too comfortable with all the declines and fades.
I don’t know if we’ll get it again, but I am looking to sell a rally in the 4025 to 4035 region.
MiM and Daily Recap
The ES rallied up to 4014.50 on Globex and opened Friday’s regular session at 4010.25. After the open, the ES pulled back to 4002, rallied up to the 4024.75 level at 10:05 and then dropped down to a new low at 3997 at 10:55. It was able to rally back up to 4007 but then sold off down to 3987.25 at 11:30. After the ES ‘triple topped’ at 3995, it sold off down to a new low at 3986.50 at 12:20, popped back to the 3998 area at 12:30, then pulled back down to 3993.50 and rallied back up to 4001.50.
The next move was back up to 4006.50 at 2:10 and then made a sequence of lows down to 3988.50 at 2:45. After the drop, the ES up-ticked to the 3993 area at 3:00, then sold off down to a new daily low at 3978.50 at 3:35. The ES traded 3983.50 as the 3:50 cash imbalance showed $779 million to sell and traded 3990.25 on the 4:00 cash close. The ES settled at 3991.50 on the 5:00 futures close, up 12.25 points or 0.3% on the day.
In the end, all the buying power was used by 10:00 am. In terms of the ES’s overall tone, it was firm off the open, but all sell programs after. In terms of the ES’s overall trade, volume was low at 1.58 million contracts traded.
Technical Edge —
-
NYSE Breadth: 54% Upside Volume
-
Advance/Decline: 59% Advance
-
VIX: ~$21
S&P 500 — ES

We faded hard from yesterday’s resistance zone, although the ES held ~3975 on the pullback. That was constructive, although the fade was certainly a blow to the bulls’ morale.
That’s especially after already having declined in 5 of the last 6 sessions.
As for Tuesday, we have another Globex rally underway. Can this one stick?
The Trade: Keep a very close eye on the 4025 to 4035 zone. Yesterday’s high of ~4025 comes into play in that range and just before the declining 10-ema. I wouldn’t hate a rally to the 10-ema and trade back below Monday’s 4024.75 high, giving us a decent short opportunity.
The 4020 to 4030 zone has been resistance for a week now. If the ES can clear this zone and the 10-ema, 4055 to 4060 is in play.
On the downside, 3970 to 3975 remains vital for the bulls. A break of this area puts last week’s low back in play. Below that and 3920 is next.
SPY
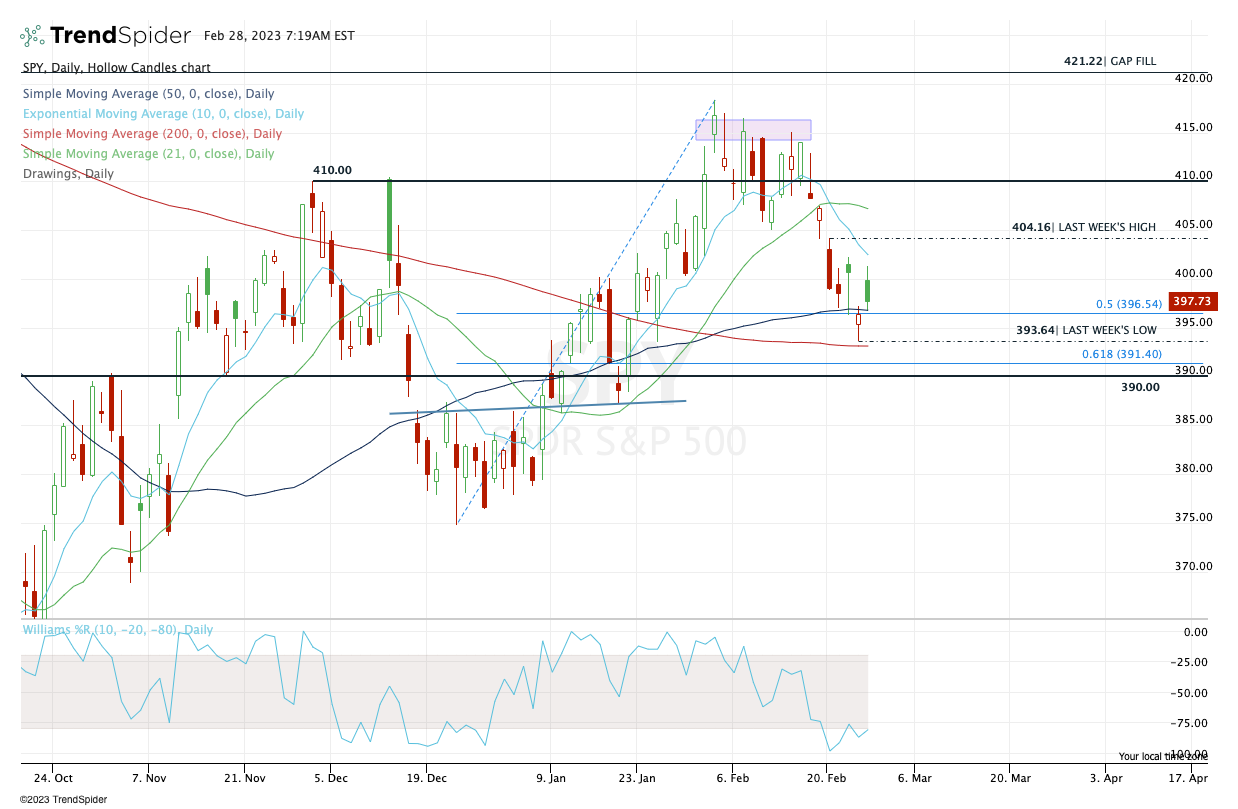
Look at the way the SPY has been dancing around $396.50, as both support and resistance over the last few days.
If we rally back up today and make a run at Monday’s $401.29 high, use some caution. We haven’t touched the 10-ema in six sessions.
A pop to this measure — indicating a rally of about 1% from Monday’s close — could be a selling opportunity. In my book, it likely will be a selling opportunity. If that trade setup materializes and the move to the downside gains momentum intraday, it could be a multi-day swing.
On the downside, a break below $396.50 and failure to regain it opens the door to last week’s low near $393.50.
TLT

Bonds have been presenting a bit of a concern lately as the 10-year yield continues to rise. Bonds are often referred to as the “smart money” and if it’s a leading indicator for equities, the roadmap doesn’t look all that encouraging.
The TLT has fallen in four straight weeks and is struggling to find a bid. The same can be said for /ZB.
If the TLT breaks last week’s low, we have to be concerned about it breaking and closing below the Dec. low of $99.35.
That would open the door down to ~$95 and, in my mind anyway, create some concerns for equities.
NVDA
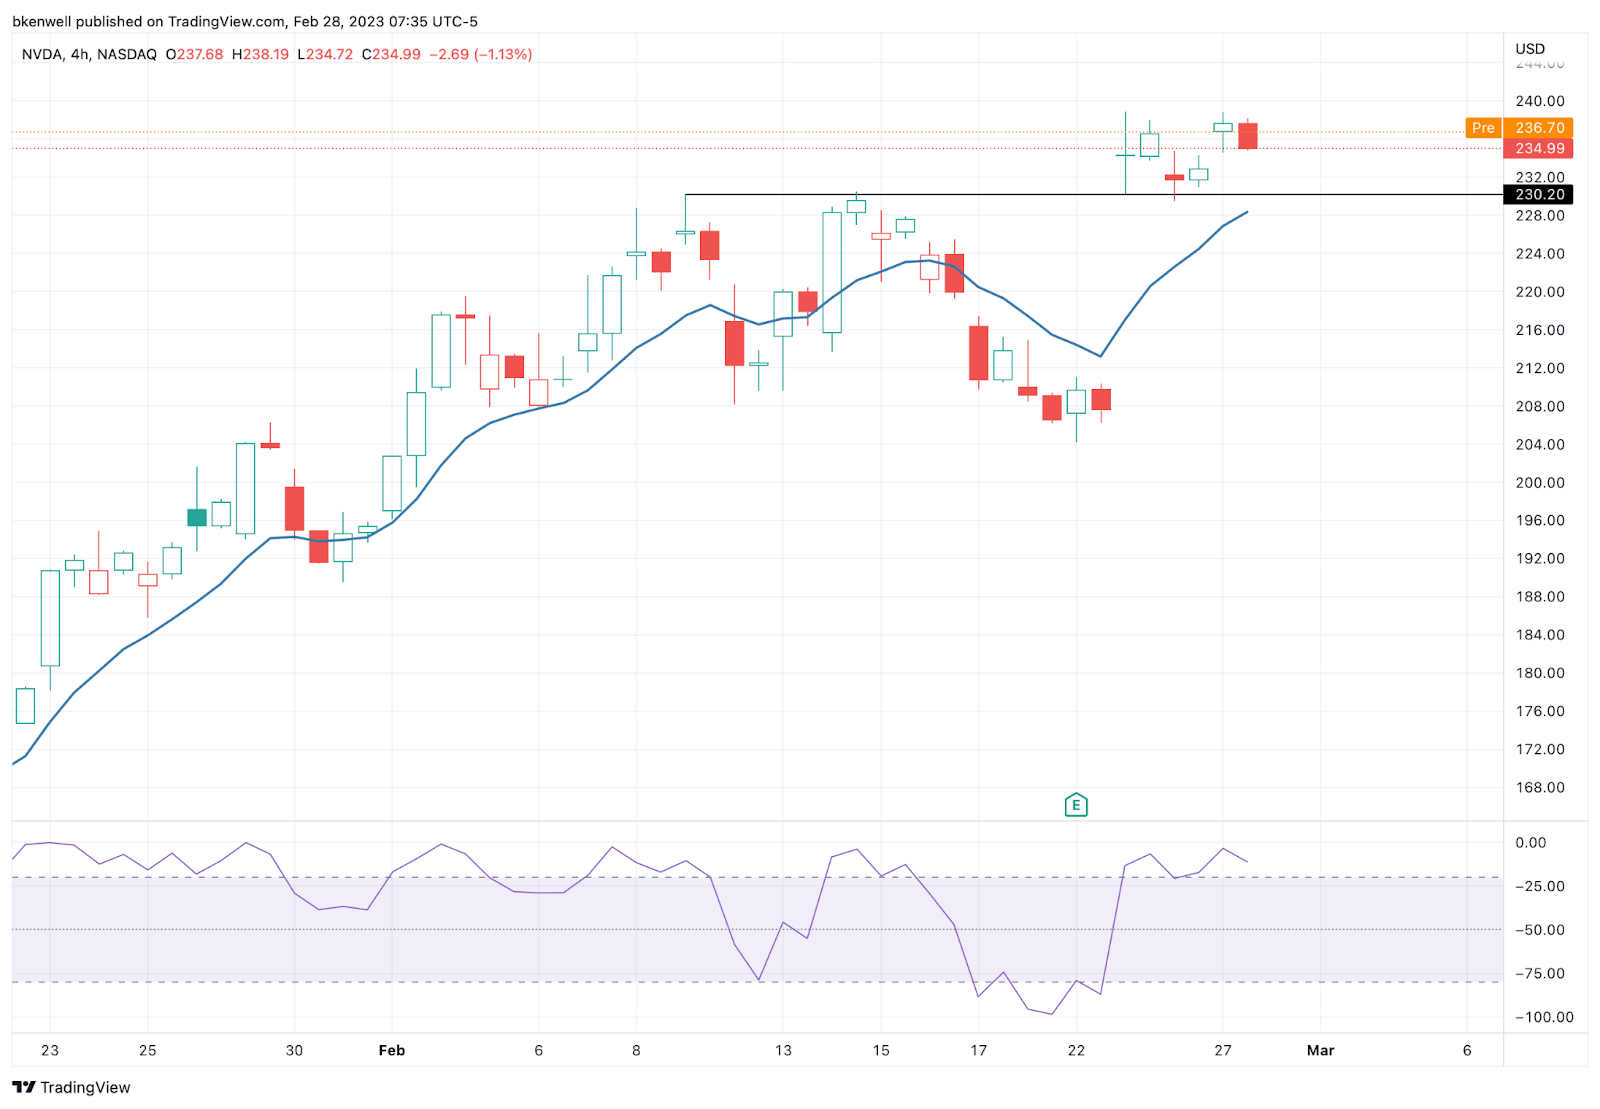
We had pretty good fortune with NVDA this year. This one is on watch on the 4-hour chart.
Specifically, I am looking for a test of the 10-ema on the H4 chart, which coincides with a retest of the $230 area. This level was resistance before earnings and support after earnings.
$234 to $235 would be the first upside target. Below $226 to $227 and it may want to tag the 10-ema on the daily chart.
Open Positions
-
Bold are the trades with recent updates.
-
Italics show means the trade is closed.
-
Any positions that get down to ¼ or less (AKA runners) are removed from the list below and left up to you to manage. My only suggestion would be B/E or better stops.)
-
** = previous trade setup we are stalking.
-
MRK — Long from ~$110 — Initial stop can be as tight at $108 or as loose as $105, (trader’s preference). Initial target for ⅓ trim is $112.50.
-
DD — Long from $72.50 (starter buy at $72.25, added at $72.75 when alert when out) —
-
Stop at $71. First target $74 to $75 (ideally $74.50+)
-
Go-To Watchlist
*Feel free to build your own trades off these relative strength leaders*
Relative strength leaders → So much strength amid market fade.
-
NVDA, TSLA → Robust
-
AQUA
-
AEHR
-
GE
-
SBUX
-
MELI
-
WYNN, LVS
-
AXP
-
BA & Airlines — AAL, DAL, UAL
-
TJX, ULTA, NKE
-
CAT
-
HCCI
-
XLE — XOM, CVX, COP, BP, EOG, PXD — (Weekly Charts)
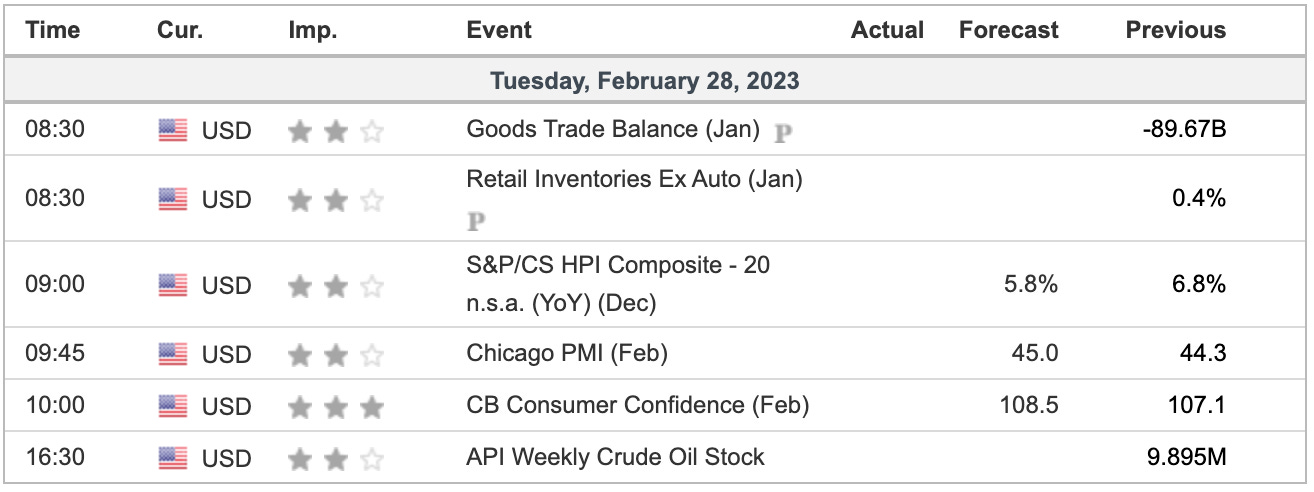
Economic Calendar
No responses yet