Is the Tech Rotation Finished? (No)
We’re nearing the end of the month
Follow @MrTopStep on Twitter and please share if you find our work valuable!
Every week, MrTopStep invites traders to an “Own the Close” contest where the closest guesstimate where the SPX will settle on Friday’s 4:00 cash close.
The winners get a free week’s access to the MrTopStep Chat and trading tools. Enter your guess now!
Our View
It’s time to focus on earnings and the Fed now. Four of the Magnificent Seven stocks — Amazon, Apple, Meta, and Microsoft — are set to report earnings in the next few days. I don’t know what will happen to the ES and NQ after Powell speaks, but what I can tell you is that the rotation out of Nasdaq/tech stocks is ongoing. This was extremely evident in yesterday’s NQ price action, which was a straightforward selloff.
The ‘great rotation’ began on July 9th, but I noticed a change in price action at the end of June and early July when I started observing that the NQ was declining while the ES was rising.
Despite the recent rally, the rotation has not eased, and we are now entering the busy part of earnings season. Powell will be discussing how soon rate cuts should begin, and Friday’s jobs report is crucial for the Fed. A softening job market will be vital for initiating rate cuts in September, with total rate cuts in 2024 projected to be between 2 and 3. We shall see about that!
Our Lean
The markets acted crappy yesterday. Was it part of an “end of the month” walk away? It very well could be. As stated last week, the Stock Trader’s Almanac has the last trading day of July as down. The S&P and Nasdaq have been down 12 of the last 18 and Dow has been down 13 of the last 18 occasions. The first trading day of August has the Dow up 18 of the last 26 occasions, but the first nine sessions of the new month are historically weak.
Our Lean: I know when the ES closes weak it usually rallies, but it seems like yesterday was T+1 and today could add to the selling idea. I think the question today is, will the same bad NQ price action show up again? I see no reason why it shouldn’t. If the ES opens lower, I want to buy the lower open or the early weakness. If the ES gaps higher, I want to sell the early rallies. I think this weak price action should play out right into the end of the month which could change after Powell speaks on Wednesday.
Here’s some good commentary from Morgan Stanley that I liked:
Speaking of buoyant, the SPX broke an incredible streak this week – 356 trading days without a 2% decline – and suffered its largest decline since December 2022 (down ~2.3% on Wed) while the NDX saw its worst daily performance since October 2022 (down ~3.7% on Wed). This comes on the back of last week’s lighter CPI, a continued rotation, and seemingly disappointing numbers from some big names this week. Given yesterday’s reversal, it all seemed like a distant memory – but we are reminded that volatility may be with us here as we race through earnings, Fed meetings, and the US election.
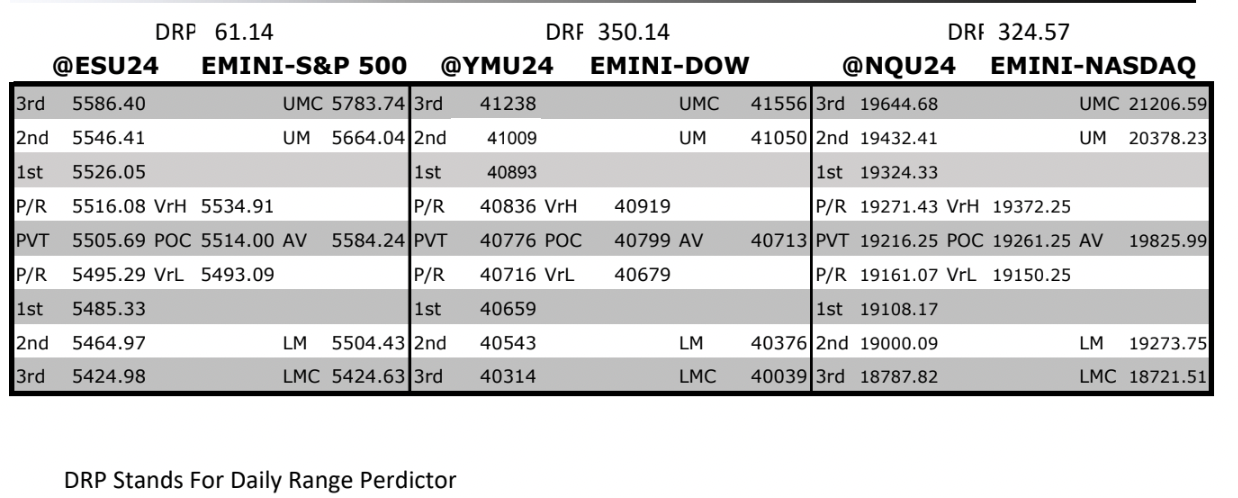
MrTopStep Levels:
MiM and Daily Recap
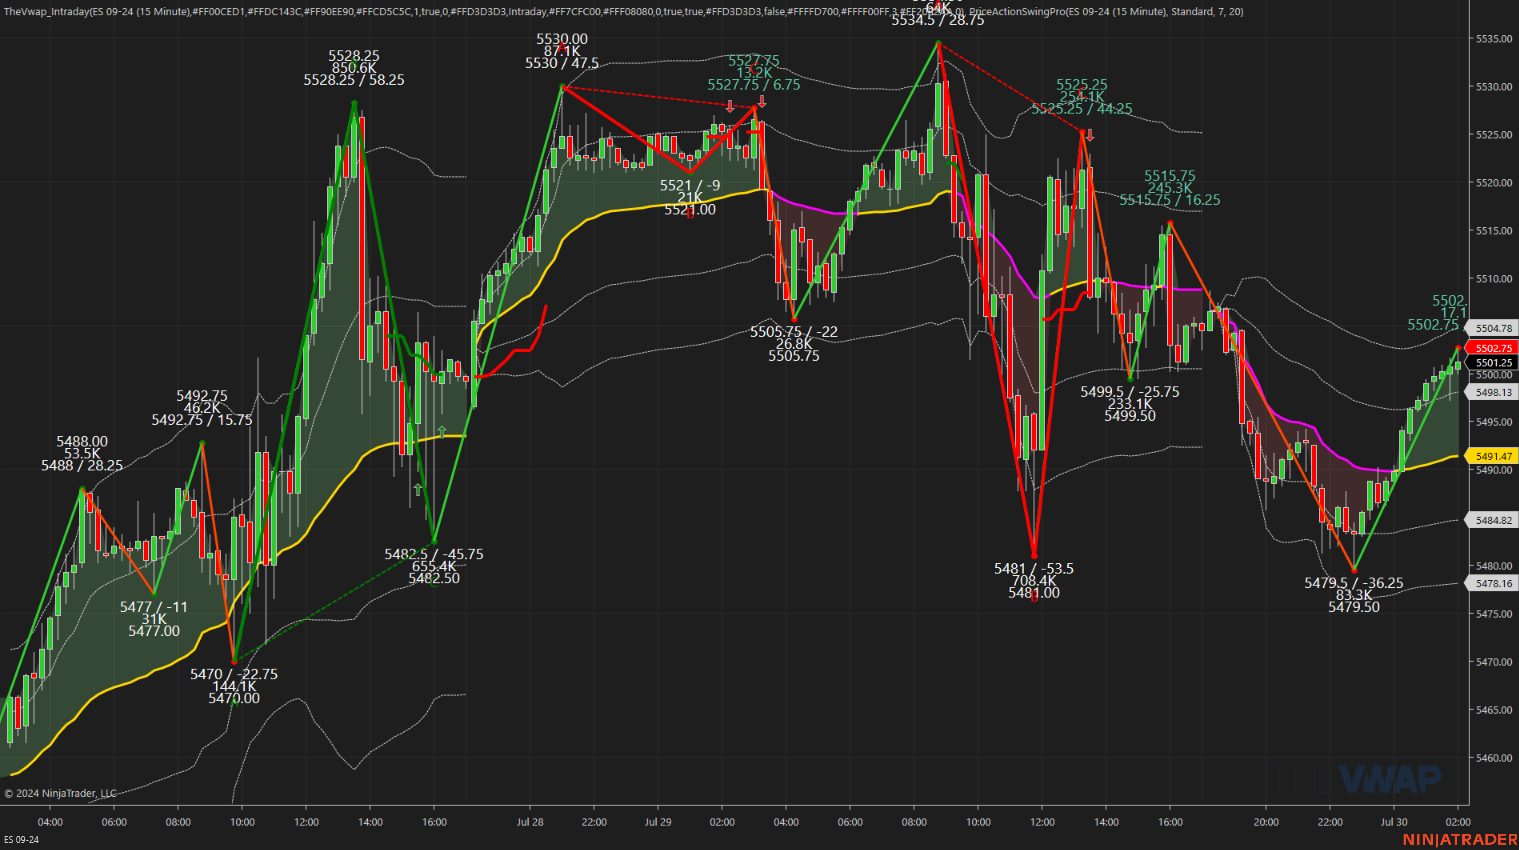
ES recap
The ES rallied to 5534.50 on Globex at 8:38 AM and opened Monday’s regular session at 5514.25. After the open, the ES traded up to 5516.75, then sold off to 5501.50 at 9:37. It rallied to a new high of 5519.25, dropped to a higher low at 5506.25, and then rallied to the high of the day at 5525.00 at 10:02. After this high, the ES sold off to 5503.25, rallied to a lower high of 5517.25 at 10:24, and then sold off to a new low of 5498.75 at 10:35. It rallied to another lower high at 5811.25 at 10:47 and then sold off to a new low of 5481.00 at 11:38 before rallying to 5522.50 at 12:22. Very choppy stuff.
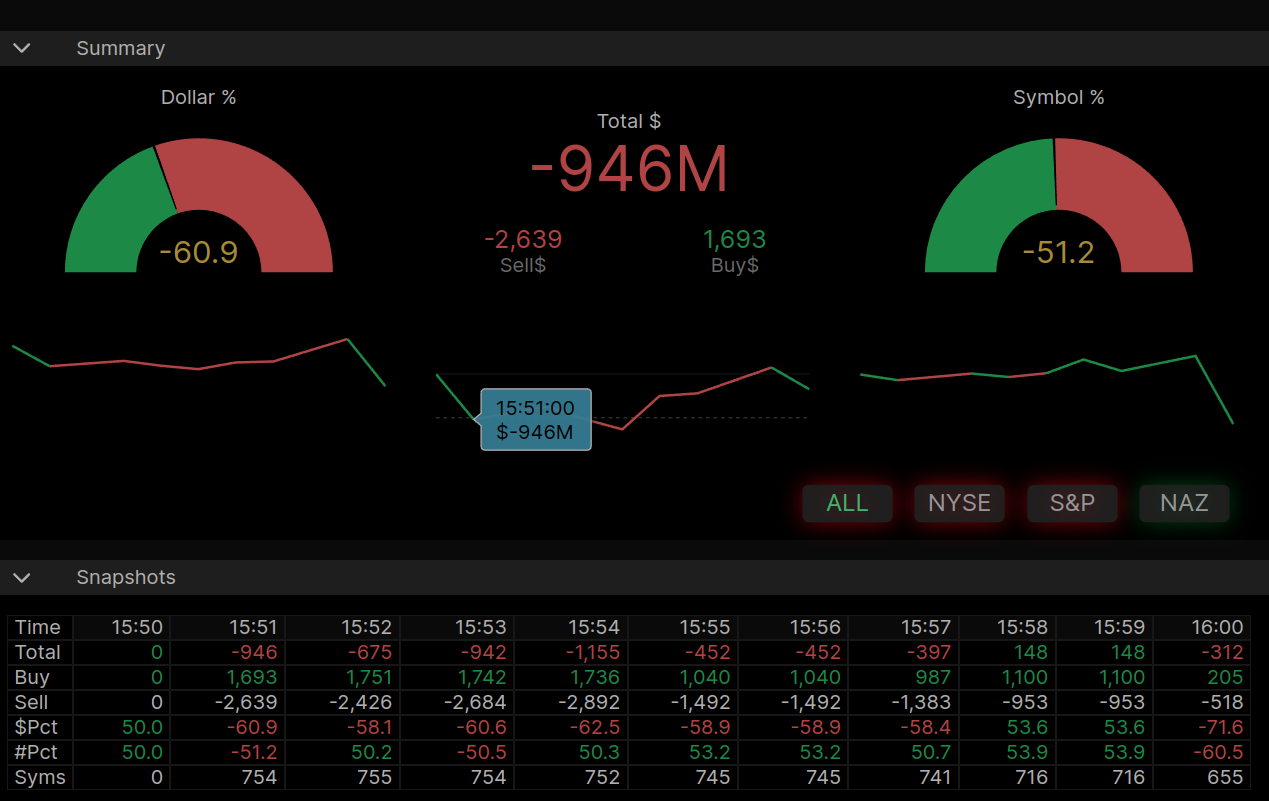
After this rally, the ES pulled back to 5513.25, rallied to 5525.25, and then dropped to 5499.50 at 2:32. It rallied to 5511.50 at 3:32 and then chopped in a 5 to 7-point range until a buy program pushed the futures up to 5415.75 at 3:47. The ES traded 5514.00 as the 3:50 cash imbalance showed $967 million to sell, traded up to 5515.24 at 3:54, and then sold off to 5500.75 at 3:57 before trading at 5502.25 at the 4:00 cash close.
After 4:00, the ES traded up to 5508.75 and settled at 5503.00, up 4 points or +0.15%. The NQ settled at 19,209.20, up 34.75 points or +0.20%. The 10-year yield settled at 4.176%, and Bitcoin neared $70,000 after Trump mentioned he would create a national stockpile if elected. I think Bitcoin is going a lot higher.
In the end, the rally on Globex before the regular session used up the early buying power, leaving the ES susceptible to a decline. In terms of the ES’s overall tone, after the initial rally the NQ was pretty much offered all day. In terms of the ES’s overall trade, volume was lower at 1.687 million contracts traded.
Technical Edge
-
NYSE Breadth: 40% Upside Volume
-
Nasdaq Breadth: 48% Upside Volume
-
Advance/Decline: 42% Advance
-
VIX: ~16.50
Guest Post — Tradrr
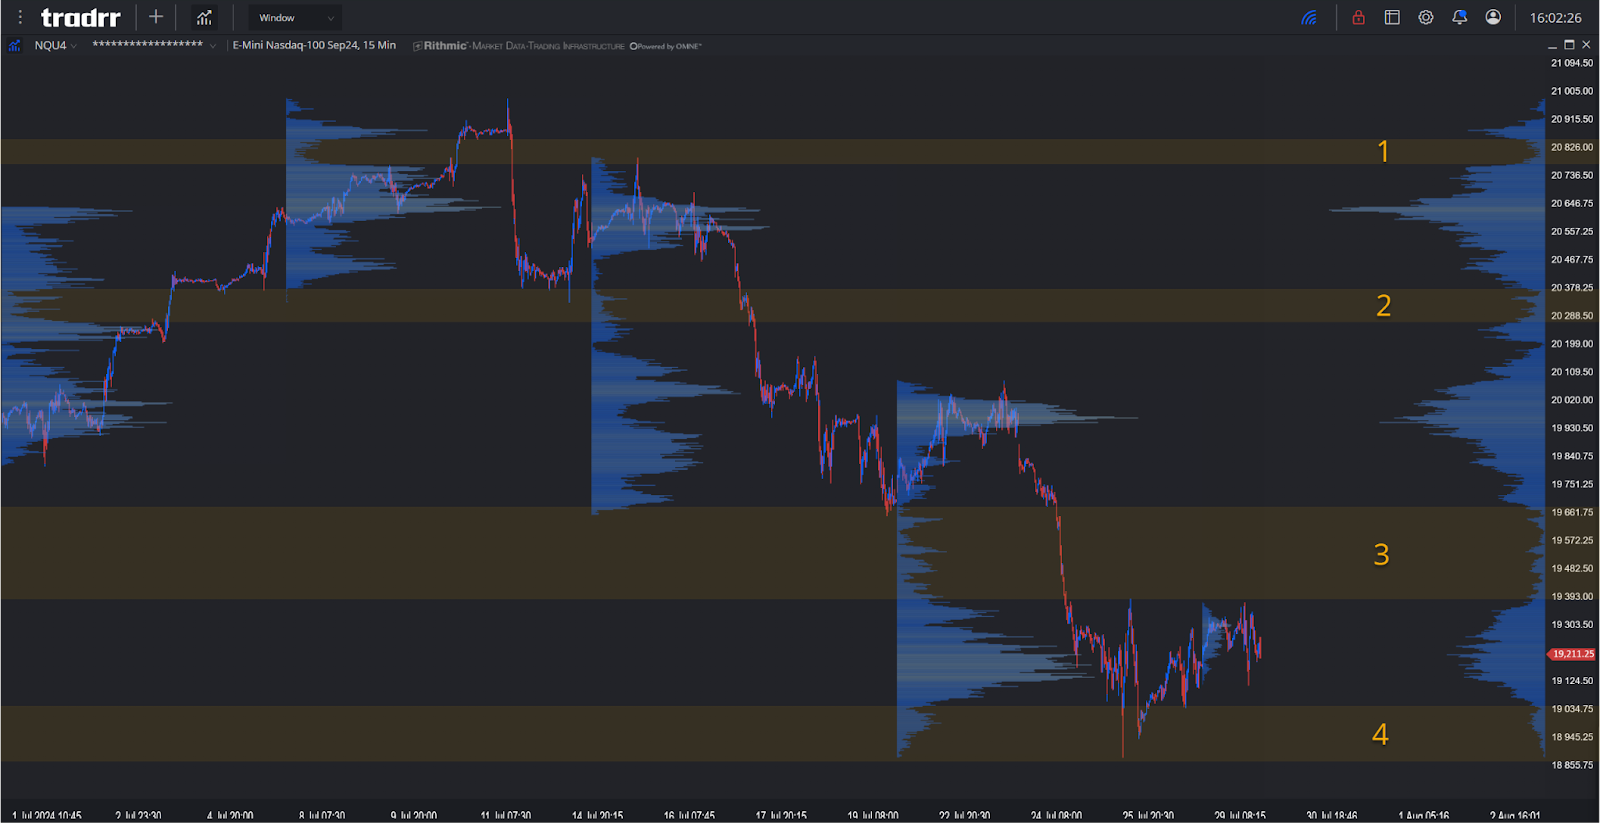
NQ
Considering the fundamentals for the week for Tech we have earnings coming in for MSFT, AAPL, AMZN and META. Should the message be mixed across these earnings we have the propensity to build up the node set from the previous week between zones 3 and 4.
Getting through zone 3 we could enter a large balance for the remainder of August if the POC of the composite gets pulled into the zones between 2 and 3. Considering zone 1 would be the gate to bullish one way trading once more and is probably not something heavily considered coming into August assuming volatility to taper off.
To learn more about Tradrr, please visit them here.
Economic Calendar
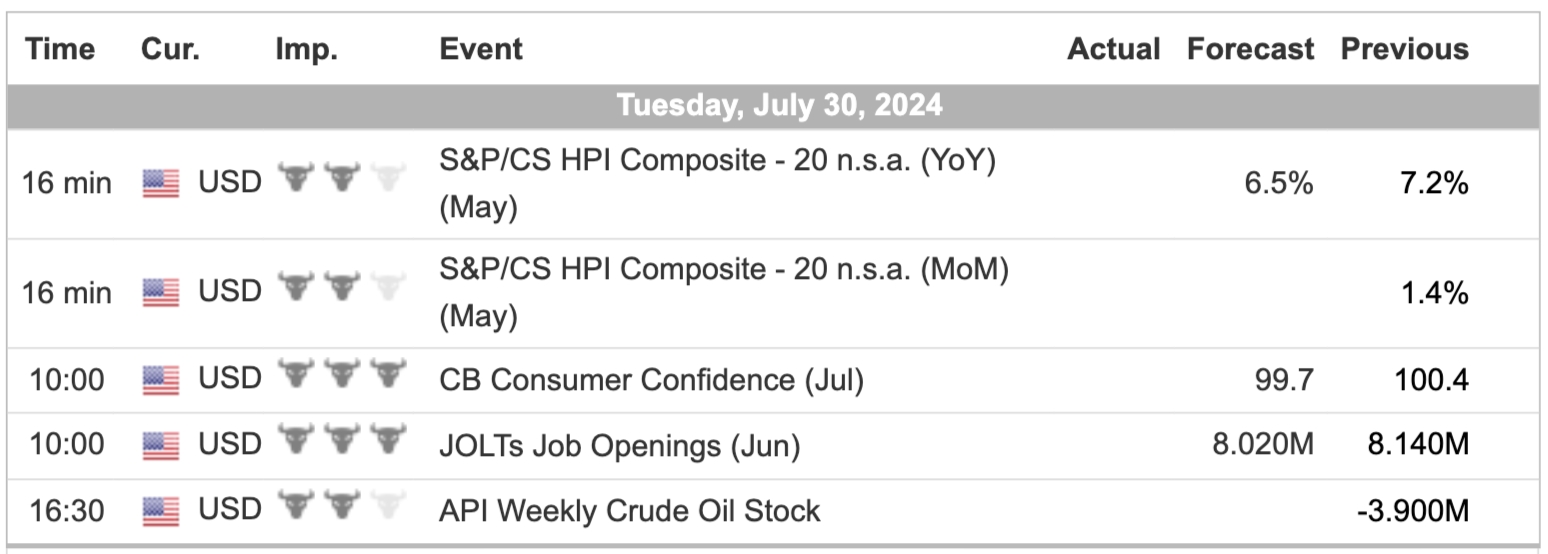
For a more complete Economic Calendar see: https://mrtopstep.com/economic-calendar/
Comments are closed