This post goes out as an email to our subscribers every day and is posted for free here around 2 PM ET. To get your real-time copy, sign up for the free or premium version here: Opening Print Subscribe.
Israel still holding. Weak hands folding.
Walgreens and True Value regrouping.
Follow @MrTopStep on Twitter and please share if you find our work valuable!
Our View
I am not surprised at all by the selloff—it was long overdue. Contributing to NVDA’s decline was Dutch chip maker ASML, which issued a cautious view on longer-than-expected chip delivery times. This dragged down Broadcom, AMD, Nvidia, and Intel, all of which fell more than 3%. While I pointed out that the ES had rallied 193 points in 5 sessions, the ASML news weighed on AI stocks throughout the day, making it difficult for the ES to rally. However, the ES held at 5850.00.
When you look at a YTD chart, it’s been one continuous new high after another. Breaking down the past 10.5 months, the average comes out to 4.381 new contract highs per month.
Our Lean
As of today, there are 19 days and 15 trading sessions left until the November 5th presidential election. The closer we get to the 5th, the more hypersensitive the headlines will become, with the Middle East remaining front and center.
Does the ES bottom today, or is the high in for now? If the big tech stocks remain weak, we could see a repeat of Tuesday’s price action. However, after being up on Monday and down on Tuesday (with Nasdaq down 1.4%), we might see some kind of “hump day” bounce. The elephant in the room is still the Middle East conflict.
As for ES levels, the 50% retracement of yesterday’s range is 5882.00, and the .382 retracement is 5889.55. On the downside, we are looking at 5850.00, 5834.90, the 38.2% retracement at 5825.55, the 50% level at 5818, and the .618 retracement at 5810.45, with the big figure down at 5800.00.
One last thing: less is better right now!
MiM and Daily Recap

Market Summary:
The ES rallied up to 5915.50, then sold off down to 5902.25, and rallied back up to 5913.75 at 9:25 AM before opening Tuesday’s regular session around 5911. After the open, the ES traded 5910.00, rallied up to 5914.00 at 9:32, then sold off to 5908.25 at 9:48. It rallied 5.25 points up to a lower high at 5913.50, and then sold off 35.75 points down to 5877.75 at 11:57.
After the drop, the ES rallied 13.25 points up to 5890.75, sold off 17.75 points down to 5873.00 at 1:30 PM, and then rallied 9.5 points up to 5882.50 at 1:45 PM. It then sold off 29.25 points down to 5853.25 at 3:09 PM before bouncing up to 5850.00 (Sunday night Globex low) at 3:39 PM. After that low, the ES bounced up to 5861.25, traded at 5860.25 as the 3:50 cash imbalance appeared, rallied to 5867.00 at 3:57, and traded 5863.25 on the 4:00 PM cash close. After 4:00 PM, the ES traded in a narrow range and settled at 5860.75, down 47.50 points or -0.80%. The NQ settled at 20333.25, down 286 points or -1.39%, the YM closed down -0.03%, and the RTY closed up +0.16%.
In the end, NVDA pushed the ES and NQ up on Monday, and NVDA sold them off after reporting earnings yesterday. In terms of the ES’s overall tone, the NQ was driving the market. Volume was better than Monday’s 900k, with 1.28 million contracts traded.


Technical Edge
Daily Market Recap 📊
-
NYSE Breadth: 46% Upside Volume
-
Nasdaq Breadth: 58% Upside Volume
-
Total Breadth: 52% Upside Volume
-
NYSE Advance/Decline: 49% Advance
-
Nasdaq Advance/Decline: 49% Advance
-
Total Advance/Decline: 49% Advance
-
NYSE New Highs/New Lows: 294 / 17
-
Nasdaq New Highs/New Lows: 292 / 96
-
NYSE TRIN: 1.29
-
Nasdaq TRIN: 0.70
Weekly Market Wrap-Up 📈
-
NYSE Breadth: 54% Upside Volume
-
Nasdaq Breadth: 53% Upside Volume
-
Total Breadth: 54% Upside Volume
-
NYSE Advance/Decline: 52% Advance
-
Nasdaq Advance/Decline: 51% Advance
-
Total Advance/Decline: 51% Advance
-
NYSE New Highs/New Lows: 367 / 70
-
Nasdaq New Highs/New Lows: 474 / 337
-
NYSE TRIN: 1.06
-
Nasdaq TRIN: 0.98VIX: ~19.53
Vix: 20.75 (up)
Guest Posts
David Dube Polaris Trading Group
@PolarisTrading
Prior Session was Cycle Day 1: Normal Cycle Day 1 (CD1) as the expected decline unfolded on a liquidation break of the key 5895 Line in the Sand (LIS) and fulfilled 5875 lower target. Further break of the 75’s sold price to establish a new cycle low at 5850. Prior range was 65 handles on 1.276M contracts exchanged.
For a more detailed recap of the trading session, click on this link: Trading Room RECAP 10.15.24
Check out the link to learn more about the Taylor Cycle and secure your FREE TRIAL.
…Transition from Cycle Day 1 to Cycle Day 2
Transition into Cycle Day 2: Market closed slightly off the session low at 5850, which will be used to measure the current cycle’s performance. Having closed low in the day’s range, selling momentum may spillover into today’s session before this cycle’s rally develops.
Key for today will be 5850 CD1 Low. IF bulls can hold and the relief rally unfolds, levels to consider are 5875 – 5880. Full reclaim of 5895 would certainly place shorts on “squeeze-alert!” Bears currently have ball control and will be looking to press lower to force more long-liquidation. Break of 5850 opens a trap door targeting 5835 – 5830 zone.
Our discipline of maintaining positioning that is aligned with market forces continues to serve us well, so stay the course.
As such, scenarios to consider for today’s trading.
Bull Scenario: Price sustains a bid above 5850, initially targets 5875 – 5880 zone.
Bear Scenario: Price sustains an offer below 5850, initially targets 5835 – 5830 zone.
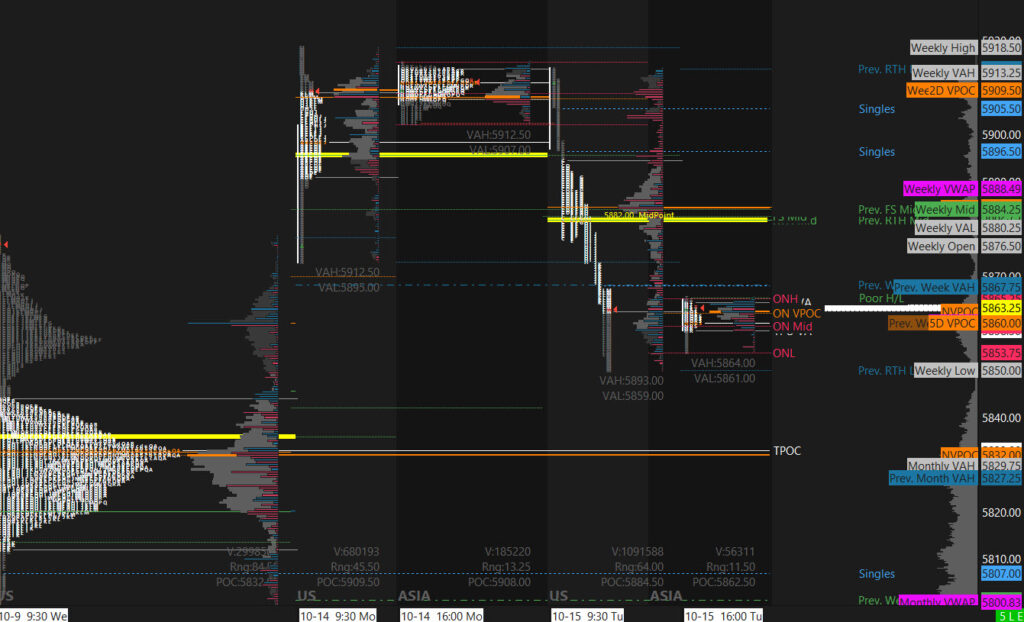
PVA High Edge = 5893 PVA Low Edge = 5859 Prior POC = 5980
ES (Chart Profile)
Thanks for reading, PTGDavid
PTG Trading Room Summary – October 15, 2024
The PTG trading room session on October 15, 2024, began with a comprehensive briefing by PTGDavid. He provided key links for participants, including access to the Polaris Trading Group’s website and resources such as the Daily Trade Strategy and Daily Range Calculator. After exchanging greetings with members, David highlighted significant trading activity, including an Open Range Short position that successfully reached target points.
David emphasized the importance of reading price action and staying aligned with market movements, focusing on critical levels like 5895 and 5875 to gauge potential market directions. As the day progressed, David outlined key phases in the trading cycle, pointing to bearish scenarios as prices approached critical support levels. He indicated that a break below 5875 could lead to further market declines.
The session included discussions around support levels and trading strategies based on current price action, signaling a cautious approach to market volatility. By the end of the session, the focus remained on the shifting dynamics between bullish and bearish trends, with a consensus leaning towards a bearish outlook under specific price conditions.
David also shared links to additional resources beneficial for understanding market movements and trading strategies.
S&P 500 — ES Futures
DTG Daily Preview
Discovery Trading Group is monitoring several key developments impacting market sentiment today:
-
Tech and Chipmaker Pressure: Nvidia, AMD, Intel, and other chipmakers are under pressure due to potential new US export restrictions to the Persian Gulf and weak ASML earnings, which also weighed down the global chip sector.
-
Market Movement and Indices: The PHLX Semiconductor Index (^SOX) fell 5.3%, leading to significant market cap losses globally for chip stocks. S&P 500 and Nasdaq both declined, with S&P down 0.8% and Nasdaq falling roughly 1%.
-
Earnings Season: Goldman Sachs and Bank of America showed strong Q3 performance. Walgreens, United Airlines, and other major companies have seen notable moves or announced positive developments. Earnings reports today include ABT, ASML, CFG, and others before market open, and CCI, SCX, EFX, and more after the close.
-
Alphabet-Kairos Partnership: Google is partnering with Kairos to build small nuclear reactors for powering AI data centers.
-
Economic Calendar and Volatility: Import Prices data is coming at 8:30 am ET. Volatility remains moderate, with the 5-day ES average daily range at 56 points.
-
ES Technical Analysis: ES established a new swing high after reversing on Tuesday. Discovery Trading Group is watching potential trendline resistances around 5922/25 and supports at 5883/86, 5746/49, and 5705/10.
No significant “whale bias” was noted overnight. The group sees opportunities for both bullish and bearish moves based on current trendlines.
ES – S&P 500 Futures – Daily

Week Ago

Today – So far the break out is holding. Watch 5864 for the hold
NQ – Nasdaq 100 Futures – Daily

Last Week

Now: Still has not broken out!
Economic Calendar – Full Calendar

Disclaimer: Charts and analysis are for discussion and education purposes only. I am not a financial advisor, do not give financial advice and am not recommending the buying or selling of any security.
Remember: Not all setups will trigger. Not all setups will be profitable. Not all setups should be taken. These are simply the setups that I have put together for years on my own and what I watch as part of my own “game plan” coming into each day. Good luck!
This post goes out as an email to our subscribers every day and is posted for free here around 2 PM ET. To get your real-time copy, sign up for the free or premium version here: Opening Print Subscribe.
Comments are closed