It’s Been a Runaway Train Into Today’s CPI Print
Follow @MrTopStep on Twitter and please share if you find our work valuable!
Every week, MrTopStep invites traders to an “Own the Close” contest where the closest guesstimate where the SPX will settle on Friday’s 4:00 cash close.
The winners get a free week’s access to the MrTopStep Chat and trading tools. Enter your guess now!
Our View
The S&P and Nasdaq are currently like a runaway train! Last night, I was discussing the qualities of a good trader with someone, and I mentioned that it’s about the ability to get knocked down and bounce back, turning trading mistakes into lessons. There’s no one-size-fits-all approach to trading. Some stick to basic charts — like me — while others use 10 or 15 indicators simultaneously. If that works for them, great, but for me, adding too many layers on my chart just leads to confusion.
What I do know is that the S&P and NASDAQ continue to outperform. Every dip — whether it’s 15 or 50 points — gets bought. Will that trend change today? I don’t think so, but I must admit, with the ES and NQ up so much, some funds might sell on the good numbers. If inflation numbers rise, we could see a swift and sharp drop.
While the big show today is the CPI number, investors will switch their focus to results from JPMorgan Chase, Citigroup, and Wells Fargo due Friday. According to data from the Federal Deposit Insurance Corp, banks are sitting on around $517 billion in unrealized losses on their balance sheets, which according to regulators is unusually high for 2.5 years. The problem for the banks is they bought government bonds and mortgage-backed securities when rates were low and had tons of customers during the pandemic, but now that the bonds have fallen, the carrying value of the bonds has declined as yields have gone up. Will this be reflected in Friday’s earnings? We shall see…
Our Lean
With the S&P up 18% and the Nasdaq Composite up 24% so far this year, what could alter this current trajectory? I’m uncertain.
I’m keeping an eye on potential weakness in mid-July, and I hear predictions of a significant drop… but a 5% decline seems substantial, and I don’t even foresee that. Is there downside risk today? My gut feeling says yes.
If there’s a big gap up, I might consider selling because of the significant anticipation and front-running into the print. On the downside, if the ES breaks, I’ll look to buy, but I’ll exercise caution and patience — timing is crucial, and so are stops.
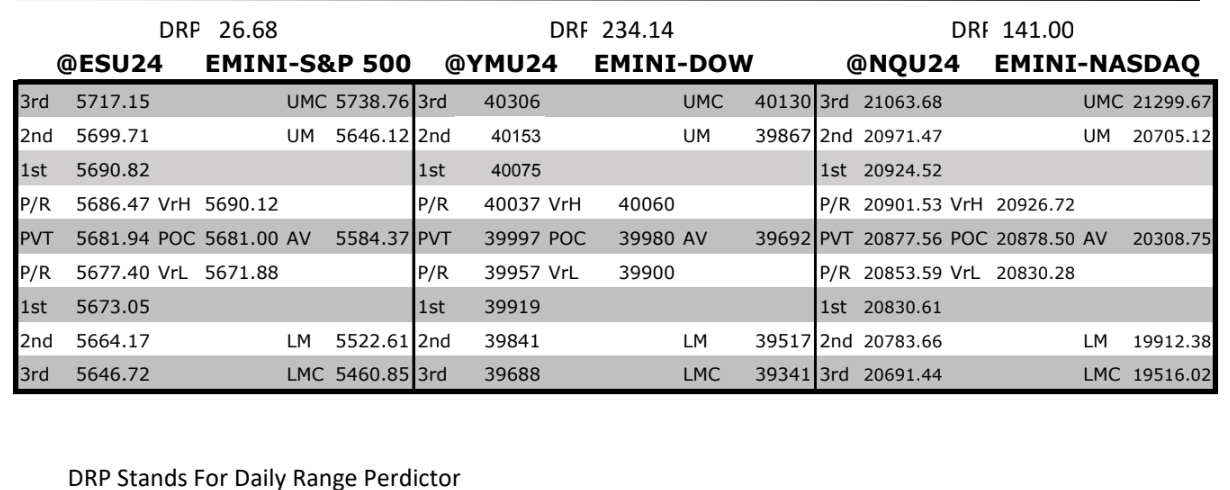
MrTopStep Levels:
MiM and Daily Recap
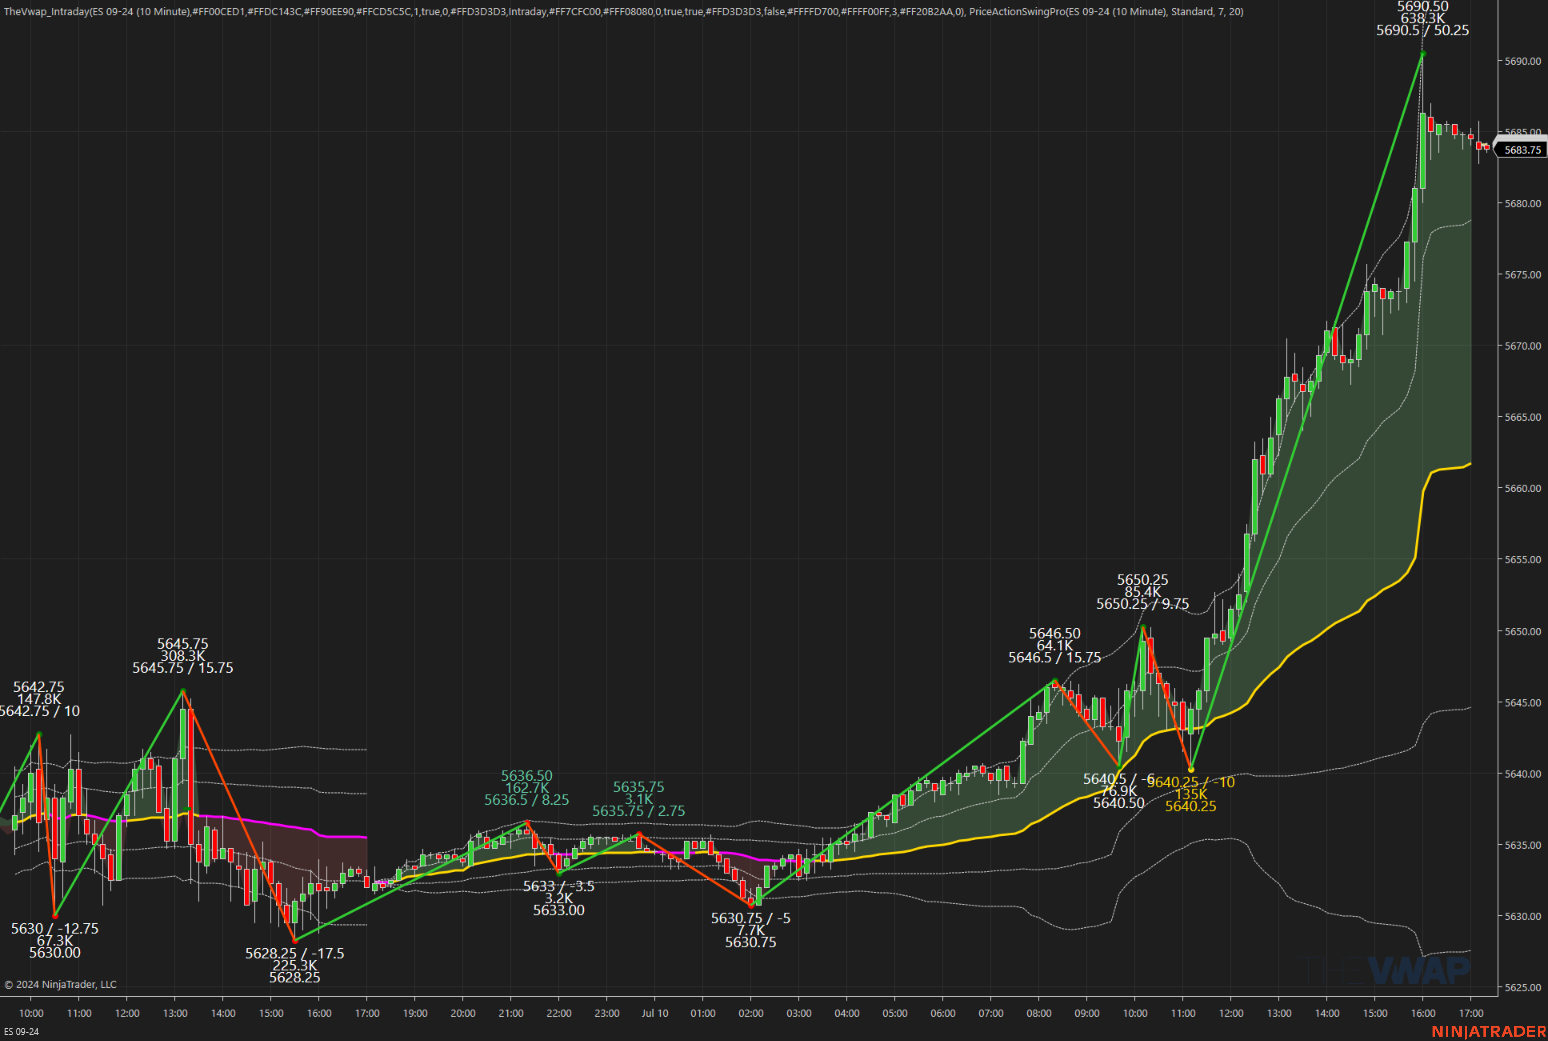
ES recap
The ES traded up to 5646.50 on Globex and opened Wednesday’s regular session at 4443.25. After the open, the ES traded 5644.50 and then sold off down to the early low at 5640.50 at 9:36 and then rallied 10 points up to 5650.25 at 10:12, traded down a few points and then made a lower high at 5650.00 and then sold off down to 5640.25 at 11:03. From there it rallied 12.5 points up to a new high at 5652.75 at 11:33, pulled back to 5649.25 at 11:51 and then rallied 30.25 points up to a new high at 5670.50 at 1:09 with 250k ES traded.
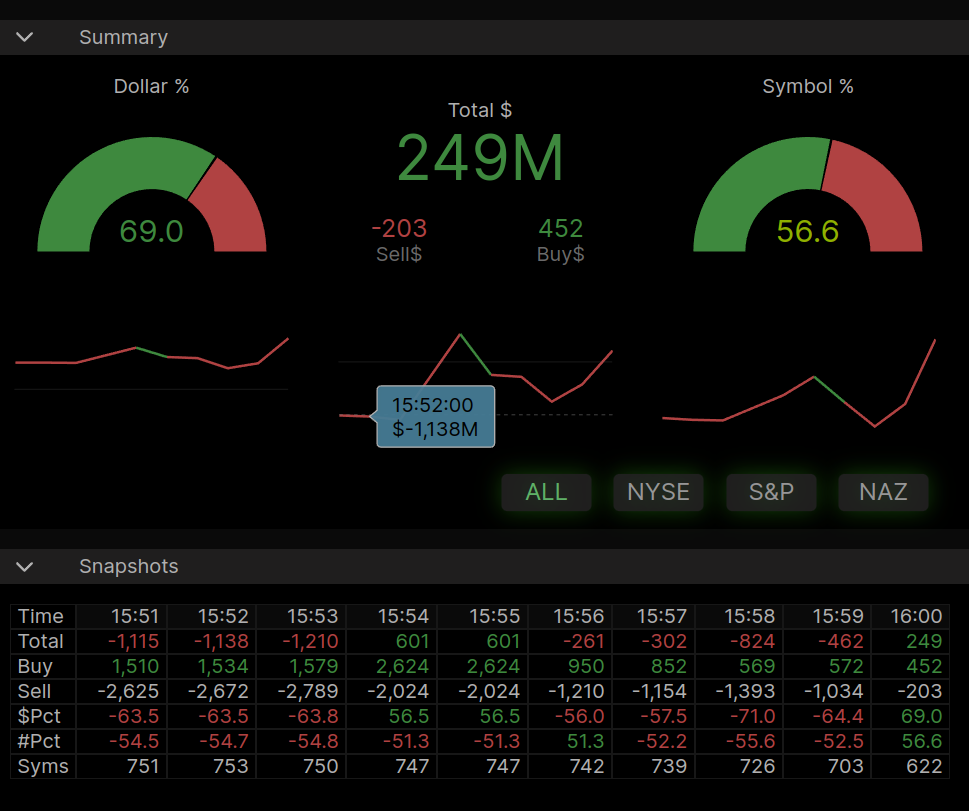
After the high, ES pulled back to 5664.00 at 1:27 and then rallied up to another new all-time high at 5671.75 at 2:07, pulled back to 5667.25 and then rallied up to 5681.25 at 3:49 and traded 5681.00 as the 3:50 cash imbalance showed $1.1 billion to sell. The ES traded up to 5690.50 at 3:59 and traded 5689.50 on the 4:00 cash close. After 4:00, the ES pulled back to 5683.00 and settled at 5684.50, up 52.5 points or +0.93%, the NQ settled at 20,896.50, up 206.25 points or +1.00% on the day. The ES made its 6th straight record close, its longest streak since 2021, and the tech-heavy Nasdaq Composite notched its 7th record in a row. Clearly, the money moving into stocks and the low volumes have created a melt-up trading environment.
In the end, I have one thing to say: DON’T FIGHT THE FED. In terms of the ES’s overall tone, it was firm. In terms of the ES’s overall trade, volume was better than expected at 1.11 million contracts traded. Mark my words, the volume will drop down to 750k to 800k/day in the weeks to come.
One of the things I try very hard not to do is get all cuckoo after a big run. With all the bullishness, we can’t forget how far the ES has gone. On November 26, 2023, the ES traded down to 4290, a 1,400 point move up. Closer in, on April 18, the ES was trading at the 5060 level, that’s a 630 point run. The current run has been a take-no-prisoners rally and has totally destroyed the shorts.
Technical Edge
-
NYSE Breadth: 76% Upside Volume
-
Nasdaq Breadth: 71% Upside Volume
-
Advance/Decline: 74% Advance
-
VIX: ~13
-
Up two straight sessions
-
ES

ES Daily
Economic Calendar
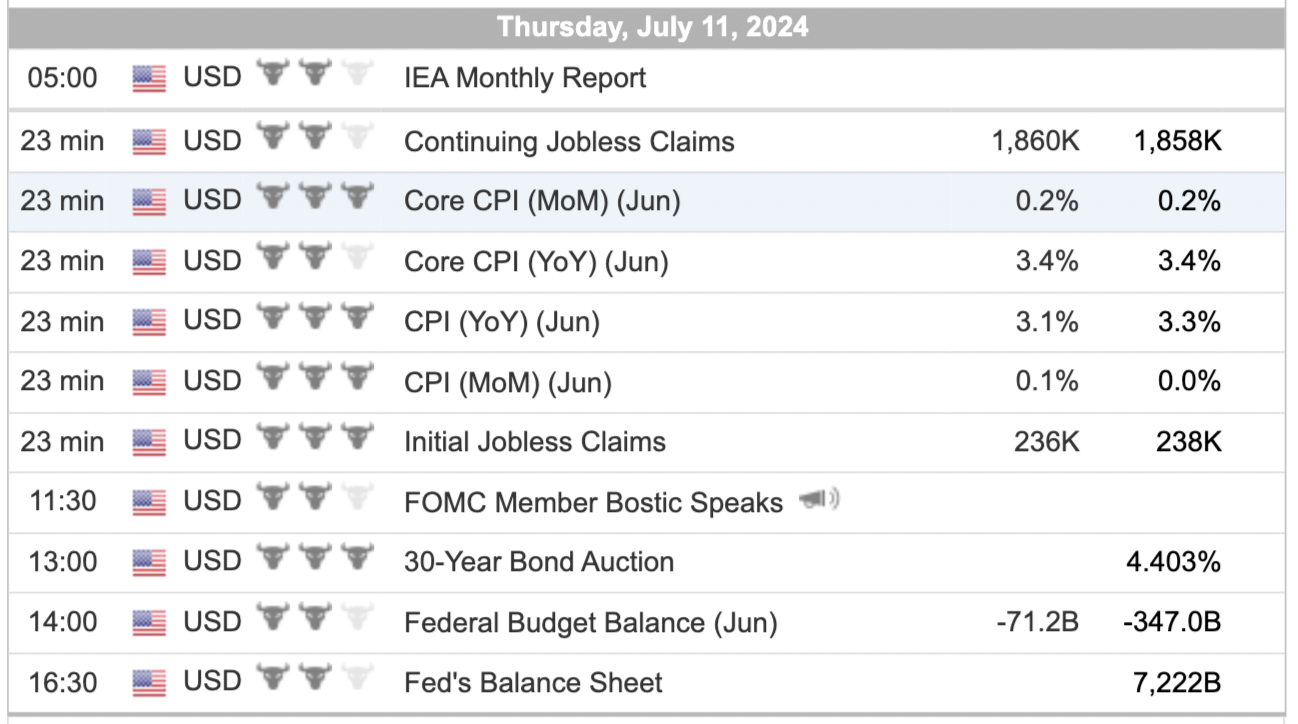
For a more complete Economic Calendar see: https://mrtopstep.com/economic-calendar/
Comments are closed