Follow @MrTopStep on Twitter and please share if you find our work valuable.
Our View
I think we have read the playbook pretty well over the last month. Like I always say, there has to be a happy medium between a gut feeling and what your charts are telling you.
The ES and NQ could not have looked better into the CPI release. I have always said, I am not here to tell you to buy or sell — that’s on you — but I do think there has to be some common sense or street smarts involved in trading and investing. After all, nothing goes up or down forever.
I was right about selling the news after the pop up to 5707, but the ES sold off after the number and the rotations and outright selling took over after the regular session open. Plain and simple the ES and NQ went too far too fast. The big deal for the day was the massive rotation.
Our Lean
If I bought the ES or NQ yesterday it was covering shorts. After the high on Globex, the drop and the lack of recovery, I followed my instincts about selling the CPI news. Too bad the ES sold off so much before the regular session open, because a big gap up would have been a great set up.
After we get past the bank earnings this morning, I think you sell the rallies. While I can’t rule out buying a lower open, my overall lean is to sell the rips. The 50% retracement of yesterday’s range is 5669 (and 5663 for those only trading the regular-hours session).
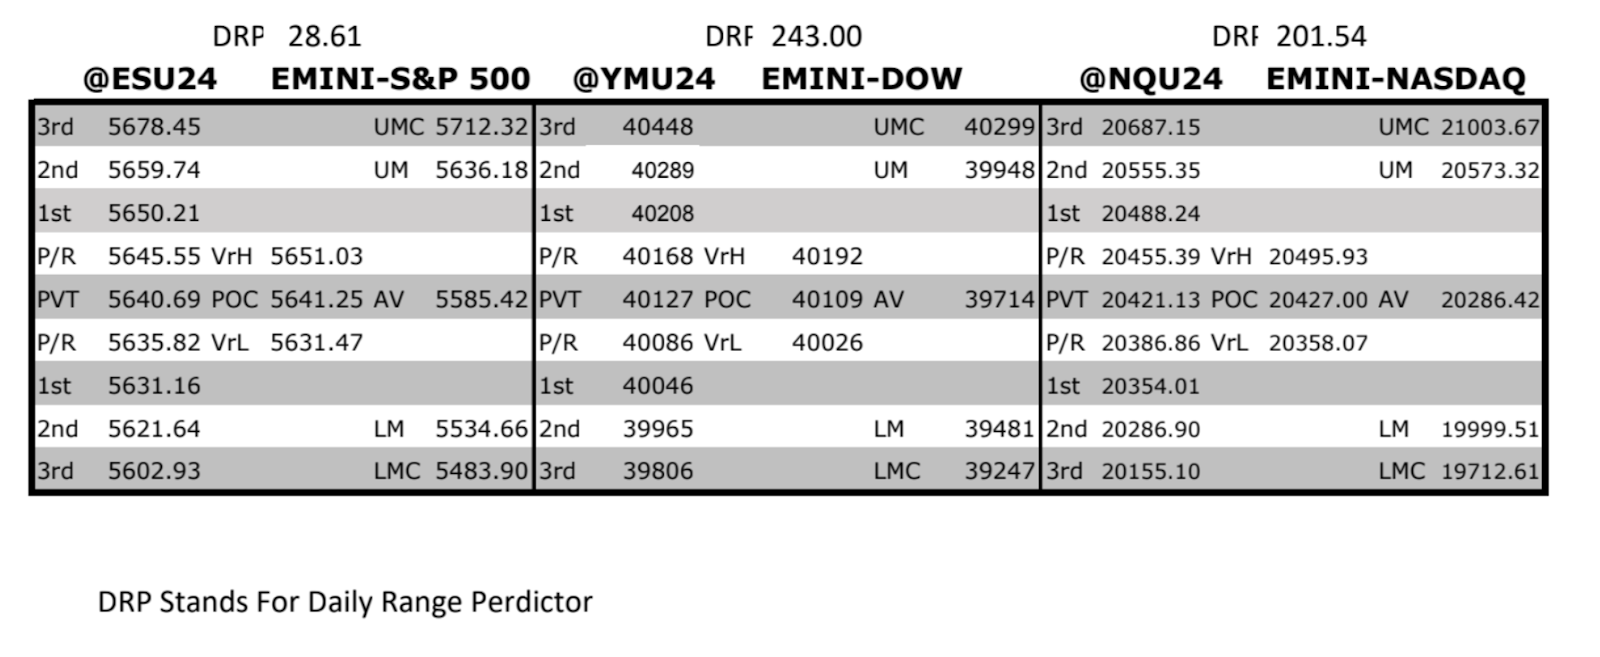
MrTopStep Levels:
MiM and Daily Recap
ES Recap
I knew going into yesterday’s CPI number that the Powell fix was in. They telegraphed it last month, and they did it again this week with the $5.5 billion to buy. I’m sure there will be sell-offs or pullbacks, but there will not be a 10% pullback before the election. As I have said many times, the Fed won’t let the markets sell off going into the election; it’s just how the game is played.
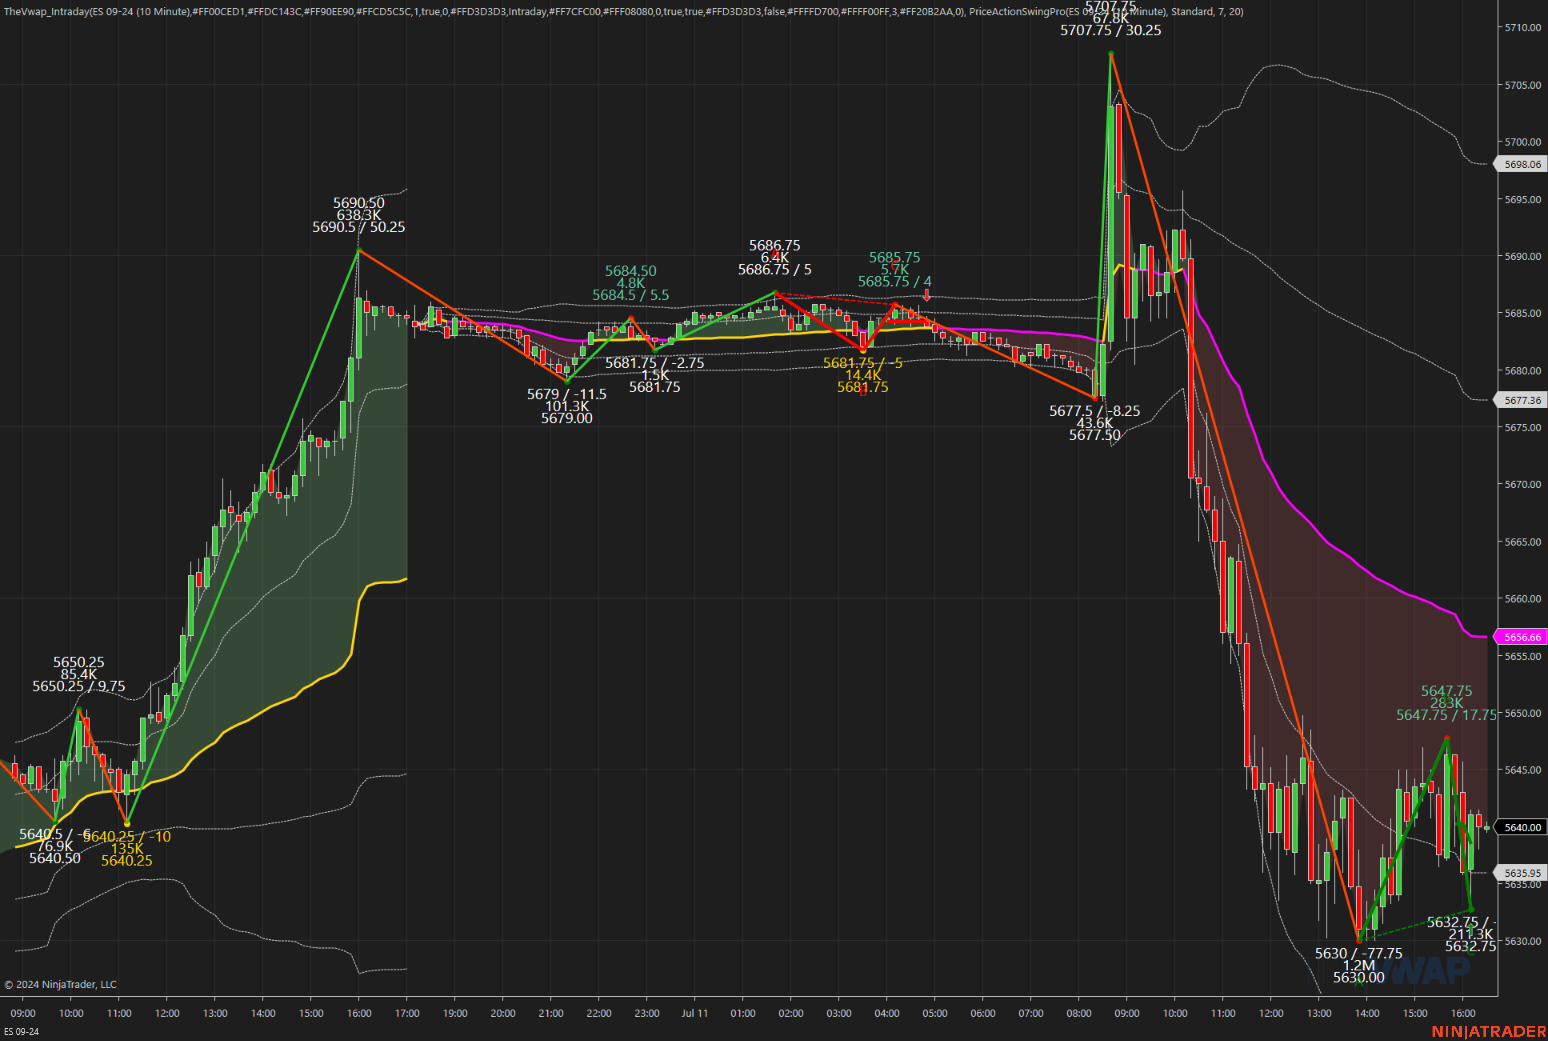
The ES traded down to 5677.25 at 8:21 am — the low on Globex — and then rallied up to 5707.75 at 8:36, sold off down to 5680.50 at 9:03, traded up to 5691.00, and opened Thursday’s regular session at 5698.75. After the open, ES traded up to 5699.75, pulled back to 5684.25, and rallied up to 5695.75 at 10:10. It then pulled back to 5689.25, made a lower high, and then collapsed down to 5668.75 at 10:25. It rallied back up to 5676.25 at 10:35, setting up a drop down to 5654.25. From the high to the low, 588.5k contracts traded.
After the low, the ES slowly rallied up to 5664.75 at 11:15 and then reversed back down to a new low at 5633.50 at 12:05, with a total of 907k ES traded from the high to the low. After the low, the ES rallied up to 5649.75 and then sold off down to a another new low at 5630.00 after the 30-year bond auction received a D rating. The ES then hung in a 3 to 4-point chop and traded up to 5644.75, then dipped down to 5630.00 at 1:50. After the low, the ES rallied back up to 5647.00 at 3:10, sold off down to 5636.50 at 3:30, and then rallied back up to 5647.75 at 3:40.
It traded back to the 5638.50 level and traded 5640.50 as the 3:50 cash imbalance showed $1.7 billion to sell and went up to $4.3 billion to sell, trading 5646.00 and then 5636.00 on the 4:00 cash close. After 4:00, the ES sold off down to 5632.50 and settled at 5640.00, down 44.5 points or -0.78%. The NQ settled at 20,432.75, down 461.25 points or -2.20%, while the yield on the 10-year note dropped to 4.192% from Wednesday’s 4.280%. The Russell 2000 (RTY) ripped, climbing 3.7% as the rotation into small caps gained steam.
In the end, they sold the news!!! In terms of the ES’s overall tone, the ES and NQ were under selling pressure all day. In terms of the ES’s overall trade, volume jumped with 235k traded on Globex and 1.665 million traded on the day session, totaling 1.9 million contracts traded.
Technical Edge
-
NYSE Breadth: 80% Upside Volume
-
Nasdaq Breadth: 67% Upside Volume
-
Advance/Decline: 85% Advance
-
VIX: ~12.50
Guest Post — Dan at GTC Traders
You Do Not Lose, What You Do Not Put in the Middle …
As we have stated before, our work at ‘GTC Traders’ concerns itself with assisting new and aspiring traders transform their trading; by focusing on professional Quantitative concepts to improve their trading so they can begin to make real headway in accomplishing the goals they set for themselves.
We find some traders have a hard time understanding that being ‘flat’ is absolutely a position. Some will try to argue against this point, saying that you should ‘always be trading’; and always have a position of some sort. Well, that is one approach.
But trading, really, is about placing positions while understanding risk models. And ‘flat’ is without question, is a ‘risk model’, and approach.
As the old Poker saying goes …
“You can’t lose, what you don’t put in the middle …”. A line Matt Damon used to great effect in the movie “Rounders”.
Regardless, it’s a truth that we try to teach new and aspiring traders. That is … there are times where ‘flat’ is the correct position. And anyone who says any differently? Quite frankly … quantitatively? they are wrong.
Let’s use a piece of research, as a means … not of ‘demonstrating a particular strategy’. That’s not the point of what we are going to demonstrate here.
Instead, use the following as a means of education to illustrate the point that we are making.
Long-Flat Educational Research
Let’s take a look at a Monthly Chart of the S&P 500 Index …
Monthly Chart – SPX
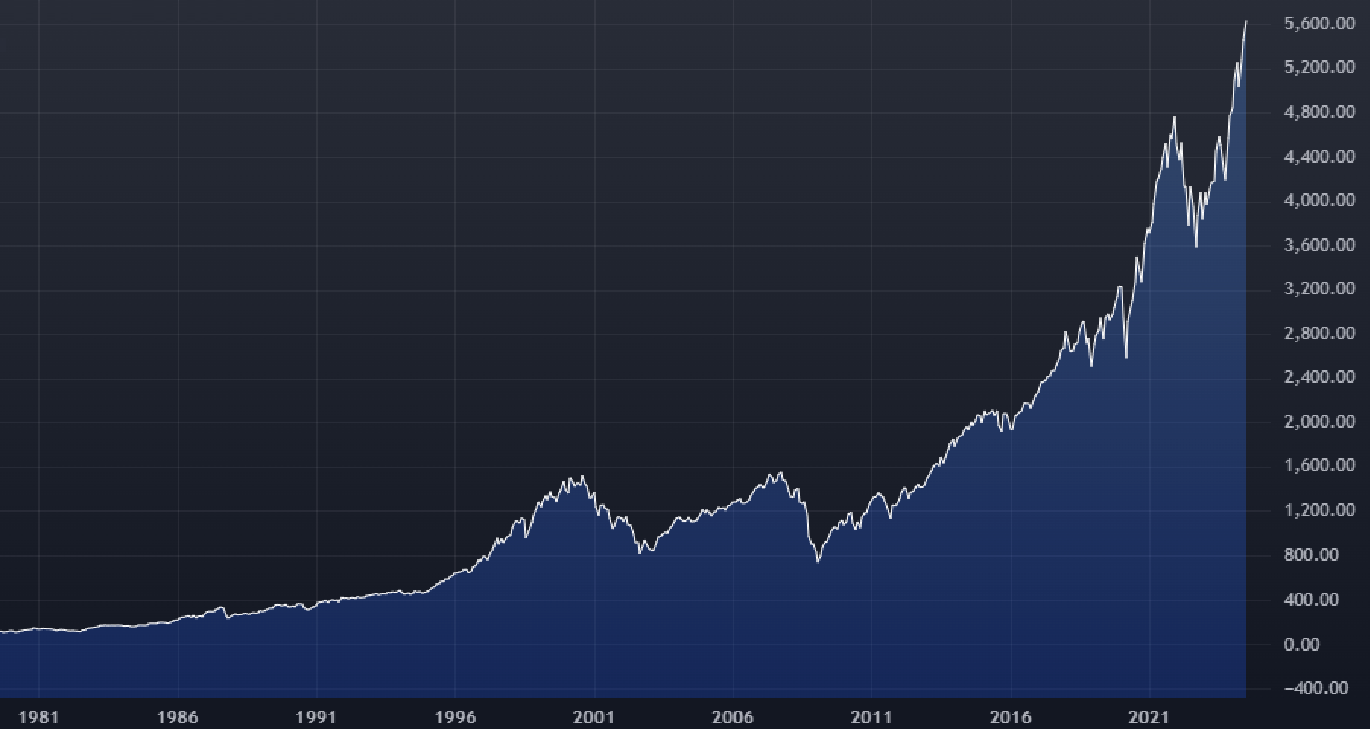
We all know the impressive performance of the S&P 500 Index.
We often marvel that ones are so concerned, with attempting to ‘beat’ the S&P 500 Index.
Given enough time … this is actually quite easy to do, if you can determine specific time periods that you should have no position, and ‘be flat cash’.
There are many varieties of Quantitative Model approaches. Long-Short. Long-Only. Short-Flat. And … wait for it … yes … “Long-Flat”. Ok, so let’s introduce a long-flat model. Remember, we are not doing this to ‘illustrate a strategy’. But to highlight a key concept as a piece of ‘education research’.
What if (the thesis), we took the above SPX, if we placed an Exponential Moving Average (EMA) on that chart. Let’s use … let’s say … a 13 period EMA.
DO NOT curve-fit that number. You could use 12. You could use 15. Thirteen is ‘not the secret a magic number’, and neither is an ‘EMA’ a secret magical technical tool. They are simply highlighters that we can use in this demonstration.
What if on the last day of the month … if the SPX < 13 period EMA? You went to flat cash. You had no position, and waited for another 30 days. Then, at the end of the 30 days, you check the SPX again. If it was < 13 period EMA, or ‘underneath’ that moving average? You stayed flat for the next 30 days. But if it closed above the 13 period EMA, or the SPX > 13 period EMA? You went long the SPX (Or SPY, or any other associated instrument), and stayed ‘long’ the SPX (Or SPY) for 30 days. And then checked again.
The point here, is this is a systematic way to be either ‘Long’? Or ‘Flat’.
And the real question, is does this have any benefit, and thus, does ‘being flat’ have any benefit?
Here are the results run since the 1990’s ..
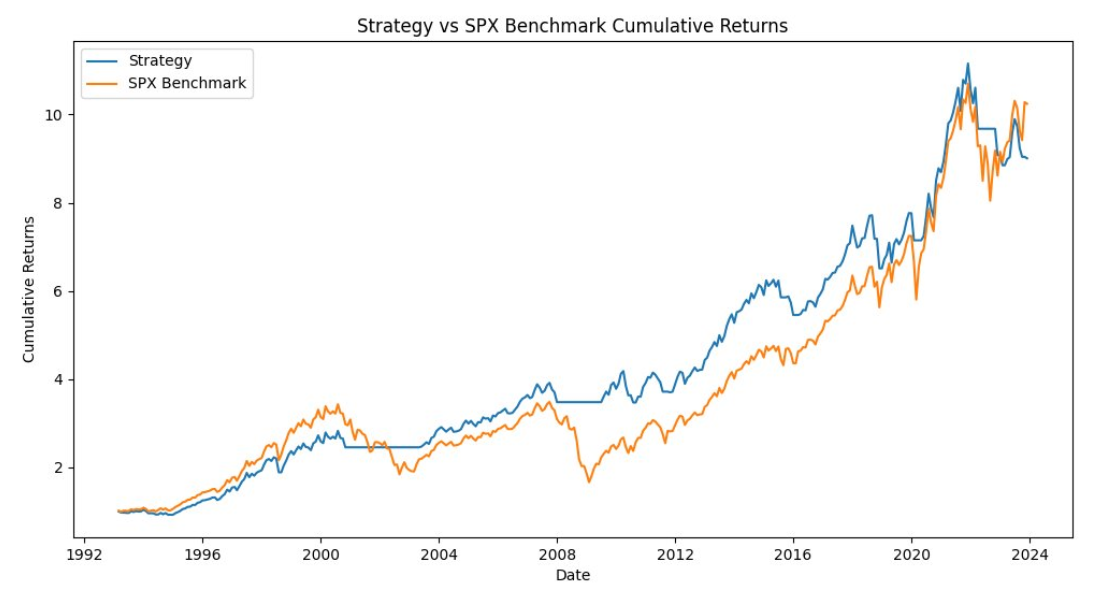
Notice anything?
Better risk adjusted performance. Sure, there were time periods where it got chopped up a little bit. Right around 2000. A little bit of chop near 2015. But overall? Around the same performance as the SPX in terms of basis points, with less drawdown. Better risk adjusted performance, than the SPX, and long stretches of time where it outright ‘beating’ the S&P 500 Index. The above missed almost all of the drama of the 2008 Financial Crisis.
And what if you went further back in time? Since, say, the 1920’s …
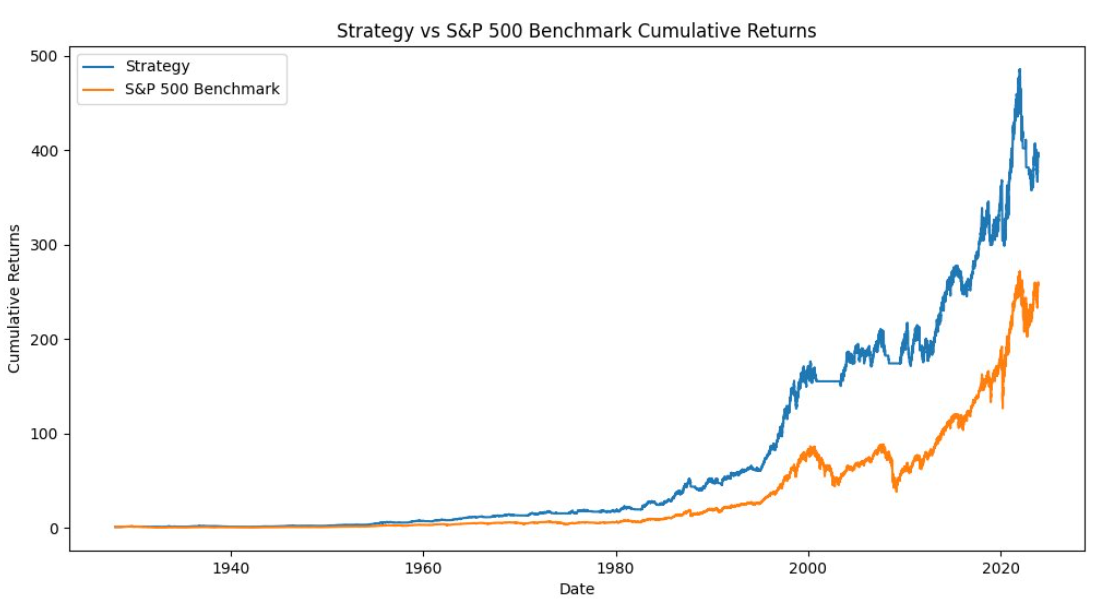
So what do you think, considering the above? Is being ‘flat’ a viable position?
We believe this illustrates that one can absolutely view ‘flat’ as a viable position to take if placed in context of another overall risk model.
Remember this piece, if anyone tries to tell you to ‘avoid being flat’, and to ‘always be trading’.
Stay safe, and trade well …
Economic Calendar
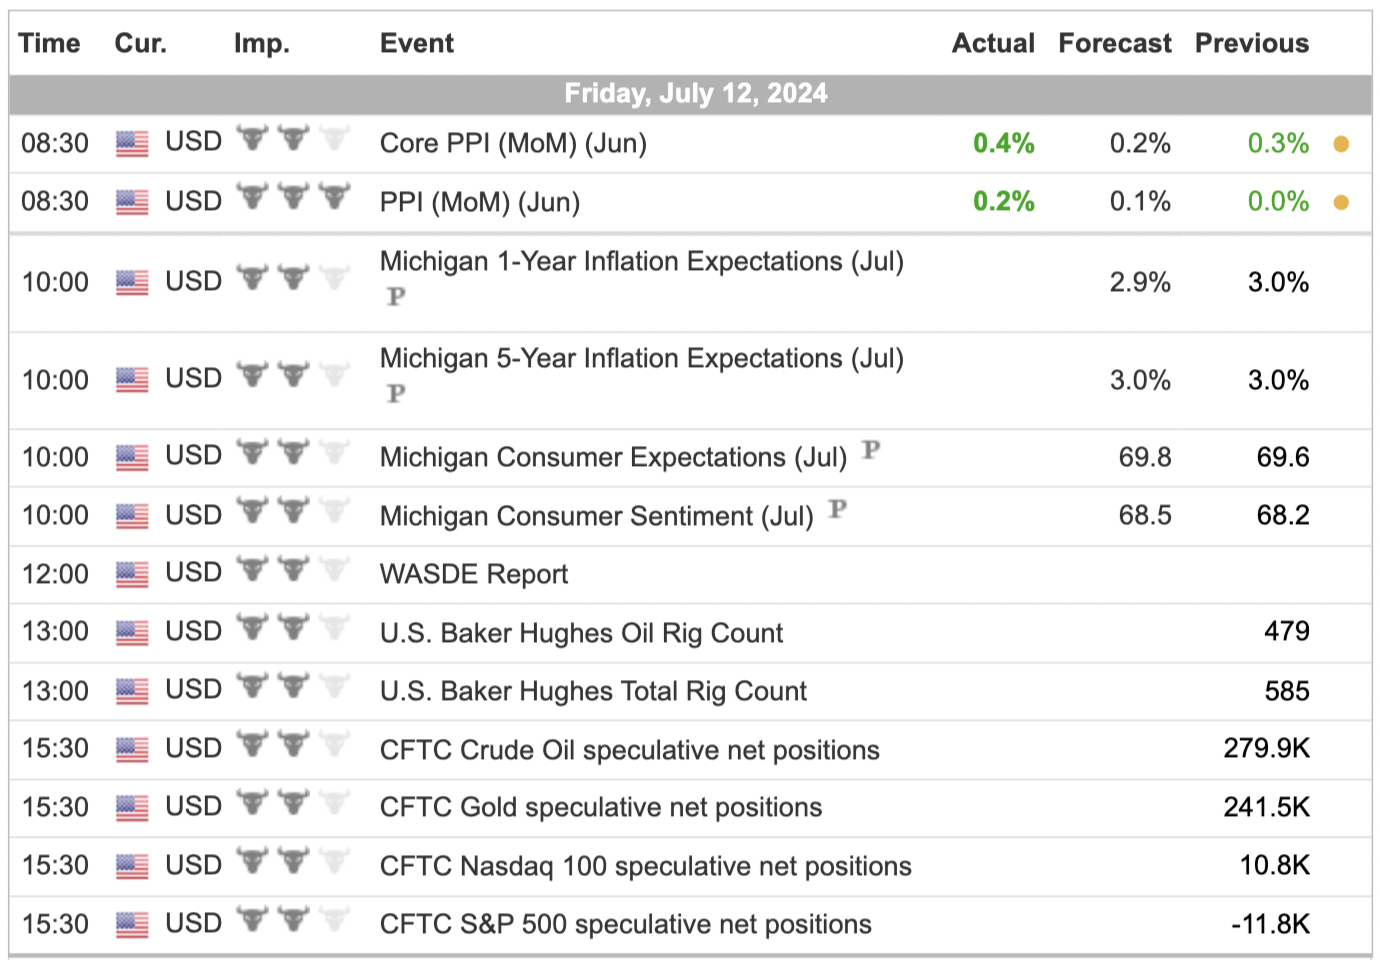
For a more complete Economic Calendar see: https://mrtopstep.com/economic-calendar/
Comments are closed