This post goes out as an email to our subscribers every day and is posted for free here around 2 PM ET. To get your real-time copy, sign up for the free or premium version here: Opening Print Subscribe.
Jobs Day, FRYday and a Market Full of Loose Screws
Follow @MrTopStep on Twitter and please share if you find our work valuable!
Our View
Today is the February jobs report, and we will see if the PitBull rule about looking for a low on Thursday before the FRYday expiration holds true. I think we all know it’s going to be another volatile trading day.

While China-related news has been relatively quiet, three major stories surfaced yesterday that highlight the country’s growing influence in both military intelligence and global finance.
The release of sub-meter resolution satellite imagery by a Chinese startup, which used AI to identify US jets at Prince Sultan Air Base, signals the end of the US monopoly on space-based intelligence and the era of hidden military buildups. Simultaneously, as global debt hit record highs in 2025, Beijing has pledged “iron discipline” to manage systemic risks—a stance that contrasts with surging US borrowing under the Trump administration.
Amid these tensions, Reuters reports that China is currently in talks with Iran to secure safe passage for oil and gas through the Strait of Hormuz, leveraging its role as Tehran’s top economic partner to stabilize critical energy flows during the ongoing conflict.
Our Lean
No matter what happens today, I think it will be risk-off going into the weekend. Can the ES and NQ still go higher? Sure. If there is a big gap down on oversize volume, my guess is we could see another early pop.
And after yesterday’s late China headline about working with Iran to secure safe passage for oil and gas through the Strait of Hormuz, if we see a big gap up on oversize Globex volume, I think you can sell the open or the first rally above the gap up.
What I can say is I do not get a warm, fuzzy feeling about the state of affairs and remain a pessimistic bull. The other thing I can say is that without the big China headline and the $.7 billion buy imbalance, the ES acted very weak before both showed up late in the day. It’s hard for me to believe no one knew about the buy imbalance.
Below are the Claude AI ES levels:
6,961.42
6,933.25 – 6,928.97
6,904.25 – 6,898.33
6,882.68 – 6,880.88
6,873.98 – 6,872.50
6,865.13 – 6,862.64
6,851.50 – 6,850.25
6,841.75 – 6,837.67
6,835.25 – 6,829.14
6,822.25
6,807.86 – 6,805.89
6,798.25 – 6,796.52
6,787.82
6,774.58 – 6,771.75
6,718.75 – 6,713.92
6,650.83
Peter Oppenheimer‘s recent research note from Goldman Sachs
It’s a measured caution rather than a doomsday call—highlighting elevated near-term risks but emphasizing resilience that differentiates today’s environment from the 2008 prelude.
To recap and expand slightly based on the latest reporting:
• Equity Risk Premia (ERP) Compression: Oppenheimer notes that global implied ERPs have dropped sharply, with many regions now at or near levels last seen in the 2007 run-up to the crisis (e.g., world average around low single digits like 3-4%, with US closer to 2-3% in some models). This low “extra reward” for stocks over bonds/T-bills leaves markets thinner on margin of safety—more prone to sell-offs on bad news.
• Near-Term Headwinds Driving Correction Risk:
• Valuations: Global equities are broadly expensive (above long-term averages in every major region, not just the US). S&P 500 forward P/E around 22x aligns with historical peaks.
• Geopolitics: Escalating Middle East tensions (Iran-related, potential oil/gas disruptions) add uncertainty.
• AI/Tech Anxiety: Massive Big Tech capex, fears of disruption to legacy businesses, and bubble-like speculation in AI narratives create vulnerability to “tech shocks” or disappointment in returns on investment.
These combine into a “significant headwind” for risk assets short-term, with correction risks deemed high (10%+ pullback possible, perhaps more at index level).
• Why Not a 2008 Repeat or Bear Market?
• No systemic leverage crisis: Private-sector balance sheets (households, corporates, banks) are healthy—unlike 2007-08’s debt overload.
• Economic backdrop supportive: Goldman forecasts solid global growth (~2.8%+), robust earnings (especially US and EM), no recession in base case.
• Historical context: Geopolitical shocks often cause short, shallow dips (median ~6% S&P drop over ~18 days before rebound).
• Outlook remains constructive: 2026 equities expected to deliver positive returns (global ~11% total return incl. dividends per Jan 2026 GS outlook), driven by earnings growth rather than multiple expansion. Any dip likely a “buying opportunity” with low odds of morphing into a protracted bear.
Oppenheimer’s track record adds credibility—he nailed the “sell America” rotation in 2024-25 (US underperformance vs. Europe/Japan) and has flagged AI parallels to past bubbles early. Still, this is probabilistic: markets could grind higher on earnings beats, or a trigger (e.g., worse Iran escalation or AI capex blowout) could spark that correction.

Guest Posts:

Get instant access to our partners’ real-time market data and insights not available anywhere else. Here is last night’s Founder’s note getting you ready for today’s market and explaining the constraints in yesterday’s market. – MrTopStep
Founder’s Note:
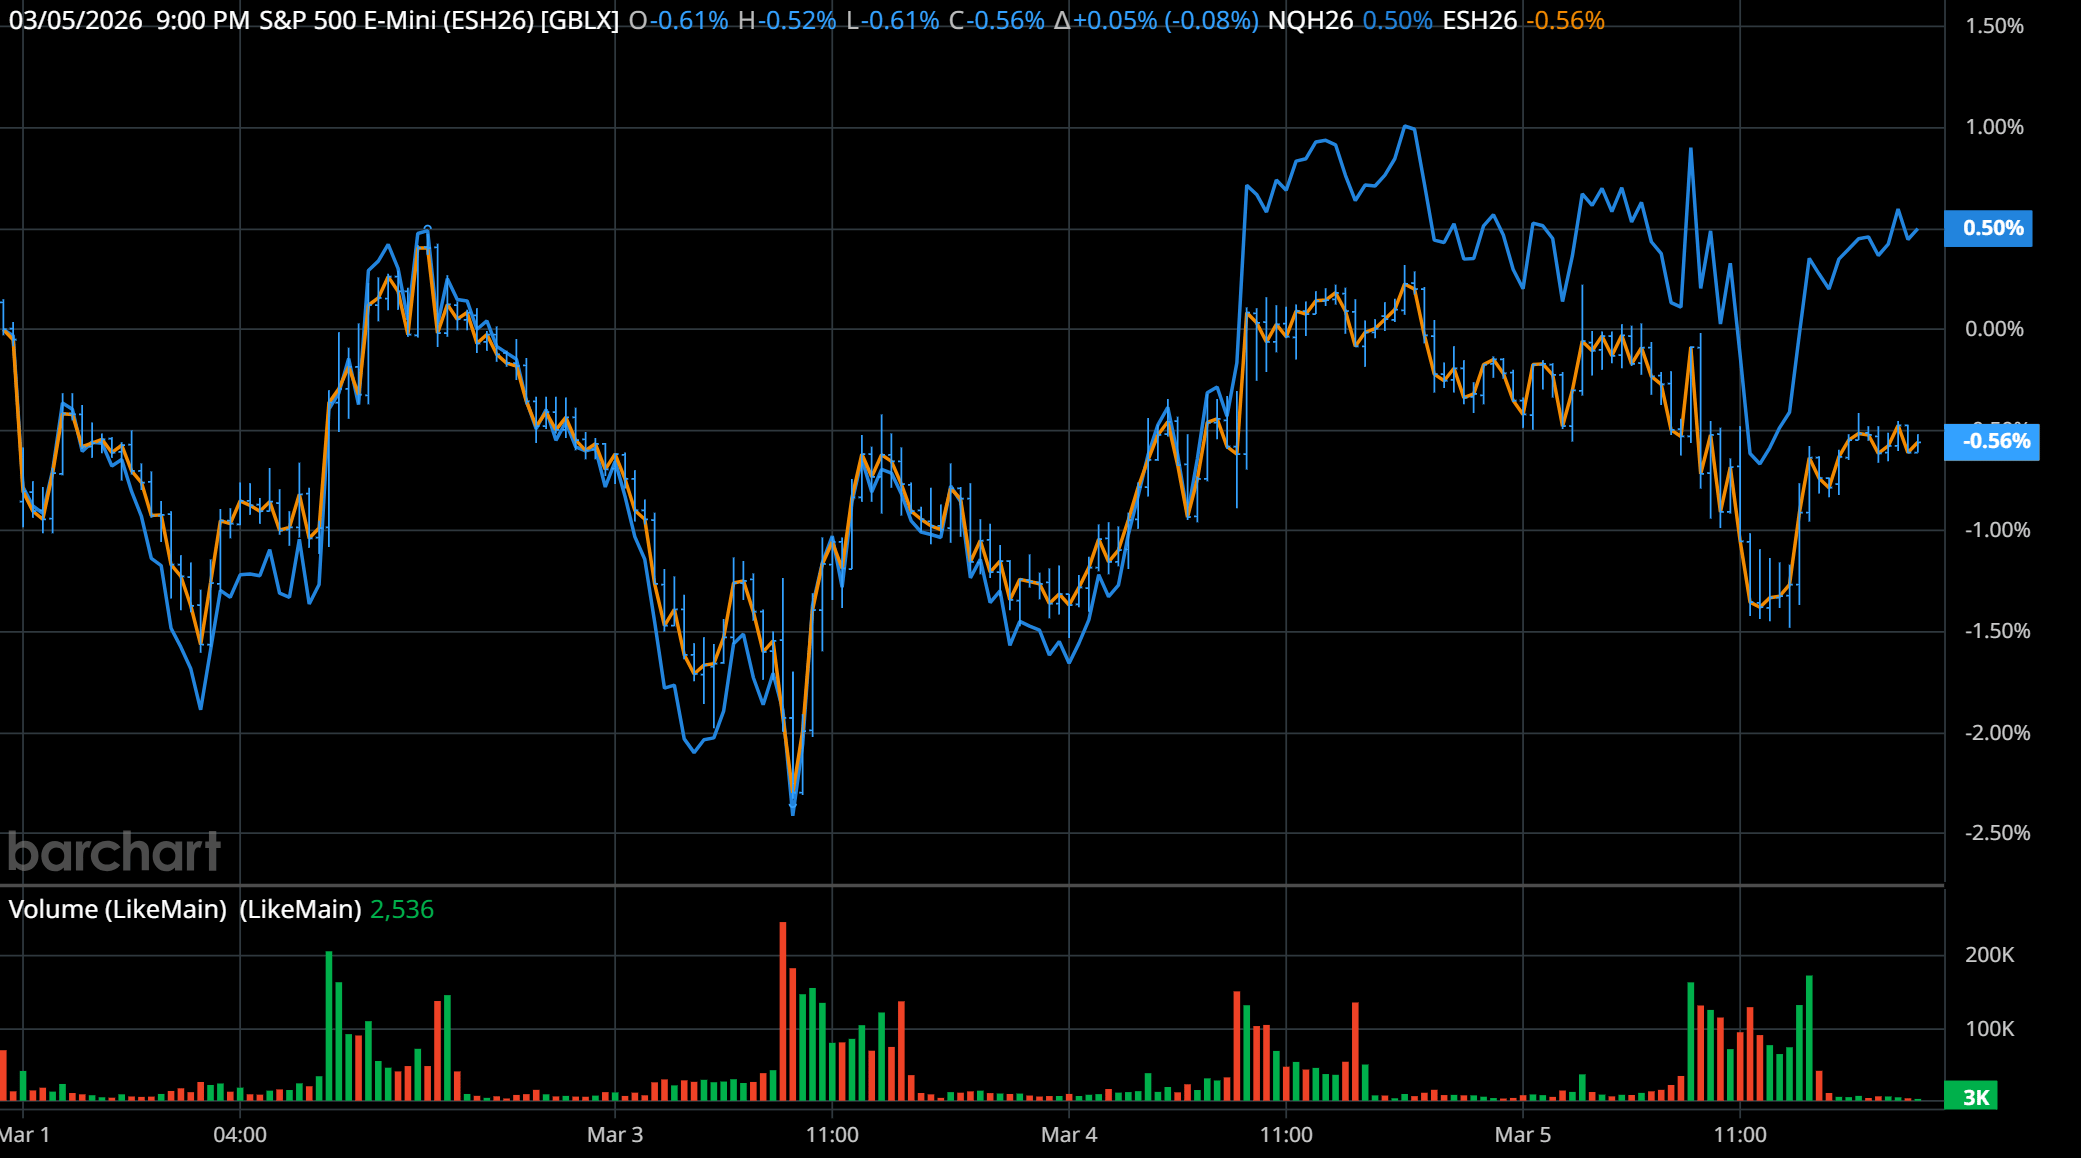
Futures are off 50bps with NFP at 8:30 AM ET.
Crude is another 7% higher, to post-conflict highs: WTI marked at $85
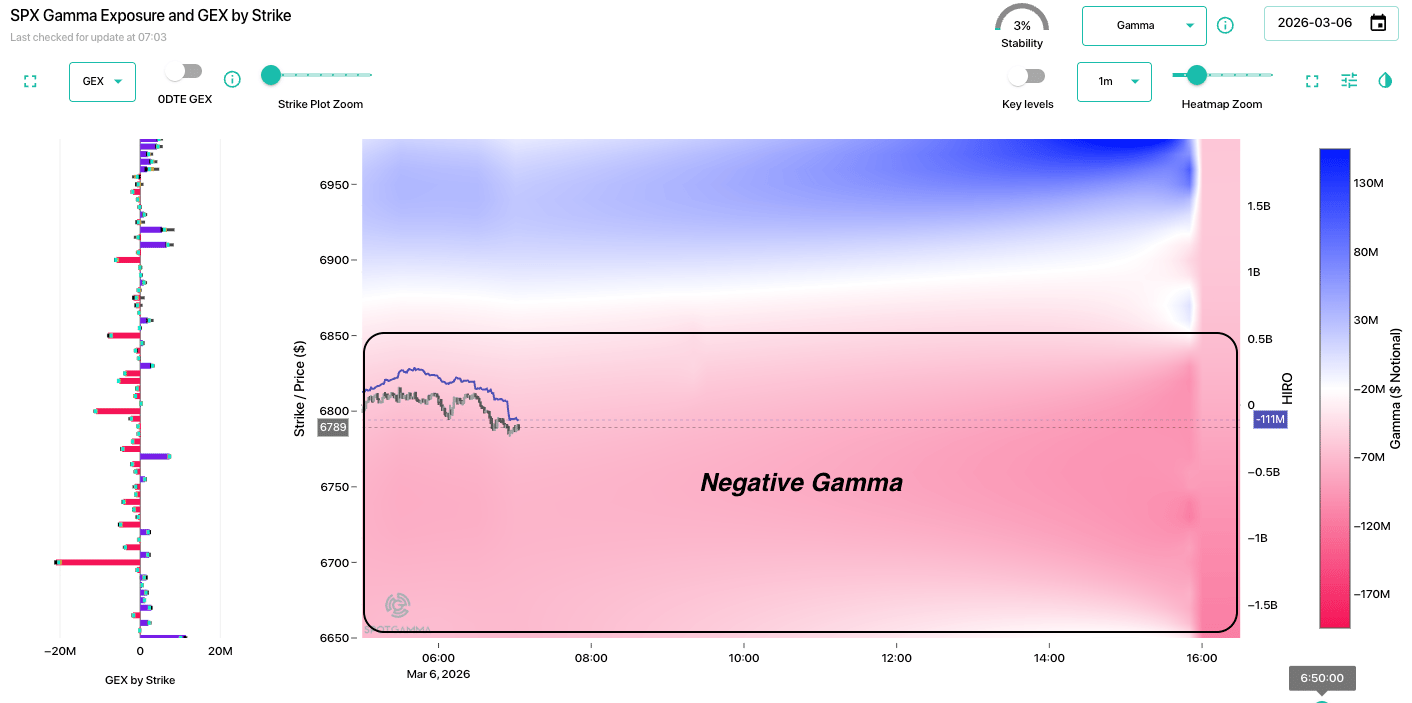
We are not sure what number the market bulls want out of NFP, and the reaction to positive numbers may be limited. On this point, resistance remains 6,875-6,900.
The gamma picture is the same as always: Negative gamma from ~6,875 down through 6,600s. This signals that the soft underbelly of this market remains in place, despite its repeated bounces from 6,800-6,700.
At the risk of sounding like overbearing parents (“Drink your milk!”, “Put on a sweater!”) we again warn you: this market is about managing risk to growing capital. Vols are only “warmed up” (not rich enough given the war), and there is a real lack of stability in the positioning. We’d argue that oil making fresh highs is a signal of increasing conflict.
Our lack of bullishness is due to the ongoing geopolitical conflict, and the likelihood that traders will want to watch their risk into the weekend. We continue to hold the core view that equity volatility is unlikely to come down until there is some cooling of the Iran situation. Higher oil, in the short term, screams higher vol.
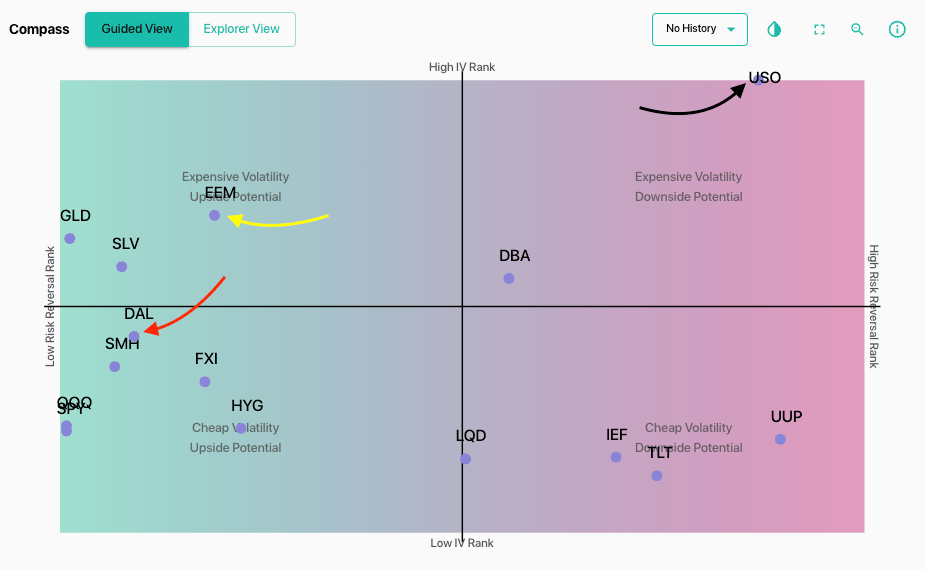
We saw airlines get smacked yesterday (-4%), which is arguably another signal of 1) higher energy prices and maybe some 2) business/travel disruption. With that, we see DAL (red arrow), for example, with heavy put skews and high IV.
On point 1, we note EEM (yellow), which is largely an East Asian basket (+50% China, Korea, Taiwan), but EEM vols are spiking sharply.
The point with noting this is that these sectors getting hit show traders concern for idiosyncratic risks. At some point maybe those more focused risks shift to equity exposure more generally.
©2026 TenTen Capital LLC DBA SpotGamma
All TenTen Capital LLC DBA SpotGamma materials, information, and presentations are for educational purposes only and should not be considered specific investment advice nor recommendations. Futures, foreign currency and options trading contains substantial risk and is not for every investor. An investor could potentially lose all or more than the initial investment. Risk capital is money that can be lost without jeopardizing one’s financial security or lifestyle. Only risk capital should be used for trading and only those with sufficient risk capital should consider trading. Past performance is not necessarily indicative of future results. VIEW FULL RISK DISCLOSURE https://spotgamma.com/model-faq/disclaimer/
Market Recap
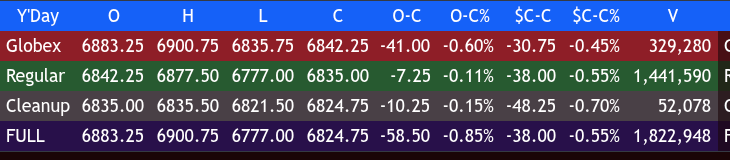
The ES traded up to 6900.75 and sold off down to 6835.75 just before the open, with 515k futures traded on Globex, and opened the 9:30 regular session at 6842.25, down 30.75 points or -0.45%.
After the open, the ES traded 6840.00, rallied up to 6866.75 at 9:35, sold off down to a higher low at 6843.00, rallied up to 6877.25 at 10:00, and then dropped 63 points down to 6814.25. The ES then rallied up to 6847.50 at 10:50, sold off down to 6811.25 at 11:25, rallied up to 6846.00 at 12:05, and then dropped 82.75 points down to 6781.25 at 12:55.
The ES at 2:23 sold off down to 6777.00 and then traded up to 6798.50 at 2:50, and not long after I posted this in the chat and Twitter:
Timing is everything
IMPRO : Dboy : [2:56:39 PM] : paid 6788.75 on 2 es
IMPRO : Dboy : [2:57:10 PM] : I think a rip is coming
IMPRO : Dboy : [2:57:29 PM] : run some weak short out
After a few small pullbacks, this headline hit the tape at 3:15:
[RTRS] – China in talks with Iran to allow safe oil and gas passage through Hormuz.
After the headline, the ES rallied up to 6826.50 at 3:25, during which a huge ES print of 16.9k contracts, or a $5.75bln notional, 140% larger than the largest print of the day. After the pop, the ES traded back down to 6813.50 after another headline hit the tape: TREASURY EXPECTED TO ANNOUNCE MEASURE AS SOON AS THURSDAY TO COMBAT RISING ENERGY PRICES THAT INCLUDES USING OIL FUTURES MARKET – SENIOR WHITE HOUSE OFFICIAL 3:30.
The ES then rallied back up to 6826.75 at 3:45. As I was live-streaming on Twitter, I said I thought there was going to be a big MOC buy, and the ES traded 6826.75 as the 3:50 cash imbalance showed $4.7 billion to buy. The ES rallied up to 6838.50 and traded 6835.00 on the 4:00 cash close.
After 4:00, the ES traded back down to 6821.50 at 4:49 and settled at 6835.25, down 40.75 points or -0.59%, down 1.16% over the last 5 sessions and down 5 of the last 6 sessions.
The NQH settled at 25049.50, down 78.75 points or -0.31%, down 4 of the last 6 and down 0.85% over the last 5 sessions. The YM settled at 47983, down 831 points or -1.67%, down 4 of the last 6 and down 2.68% over the last 5 sessions. The RTY settled at 2586.40, down 51.50 points or -1.94%, and has closed up a day down a day for the last 6 sessions and down 2.96% over the last 5 sessions.
In the end, it was another day of volatile trade since President Trump took office. In terms of the ES’s overall tone, the rotations were huge. In terms of the ES’s overall trade, volume was steady at 1.830 million contracts traded, with 510k coming from Globex.
As I have said several times, the war in the Middle East is far from over. U.S. markets dropped sharply, driven by the escalating Iran conflict and disruption in the Strait of Hormuz.
The Dow fell 1.6% (-785 points), S&P 500 -0.6%, Nasdaq -0.3%. CL surged: WTI +8.5% to $81.01 to the highest level since July 2024. Brent traded above $85 with the Hormuz effective closure trapping tankers, slashing Gulf output, and forcing refiners to seek alternatives.
Israel struck Tehran and Iran retaliated with missiles, and attacks spread to Azerbaijan and Saudi Arabia. Treasury yields rose for a fourth day on inflation fears delaying rate cuts, and NVDA and chip stocks dipped on reports that Trump drafted rules limiting global AI chip exports, but Nvidia closed slightly higher.
On Tap Today
8:30 am – U.S. Employment Report
8:30 am – Unemployment Rate
8:30 am – Hourly Wages
8:30 am – Hourly Wages YoY
10:15 am – San Francisco Fed President Mary Daly speaks
1:30 pm – Cleveland Fed President Beth Hammack speaks
MiM
Market-On-Close Recap
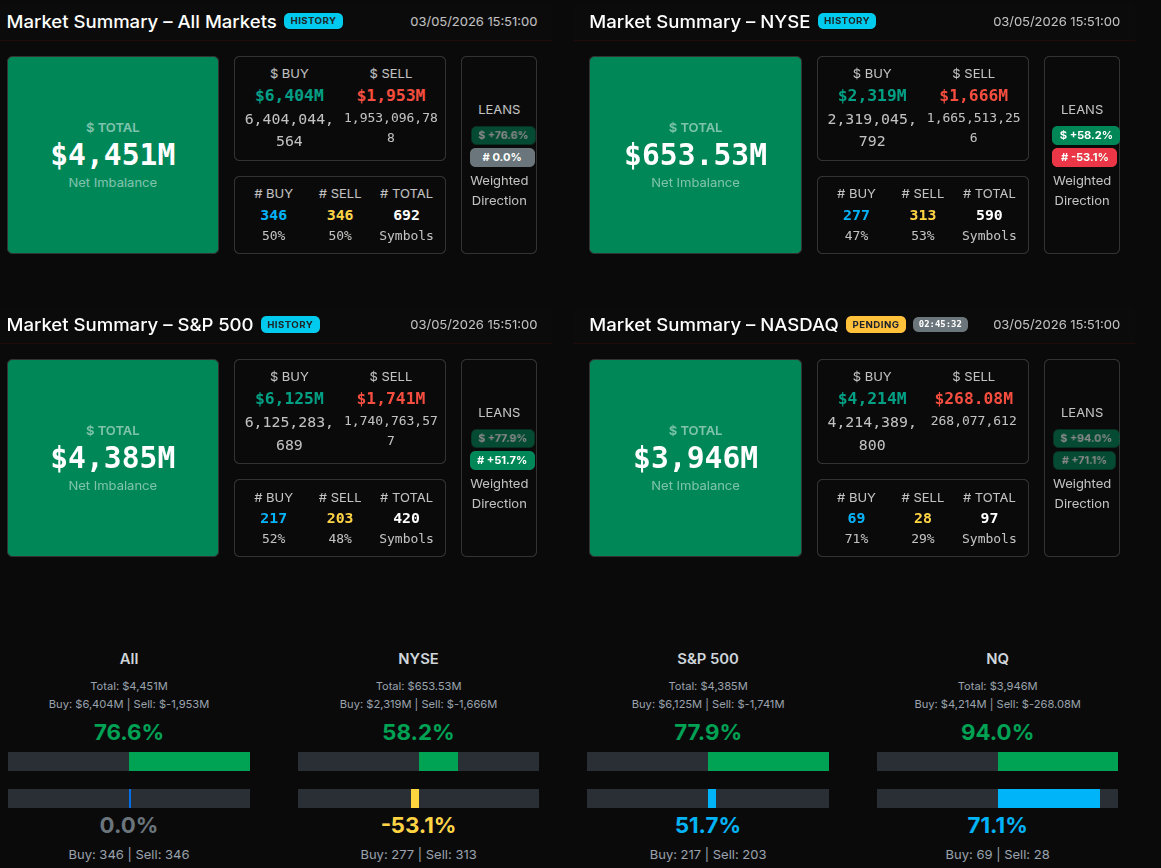
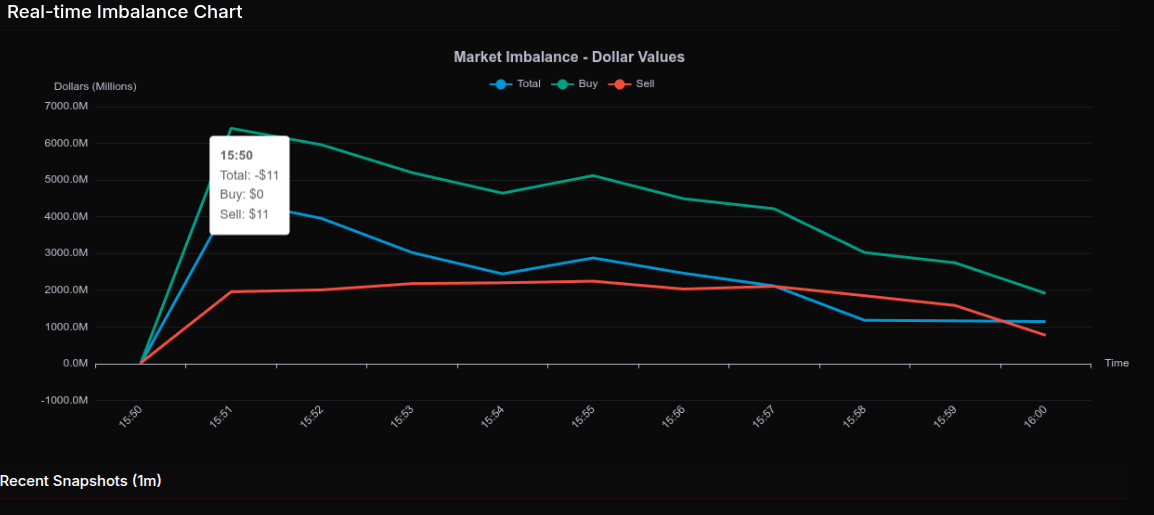
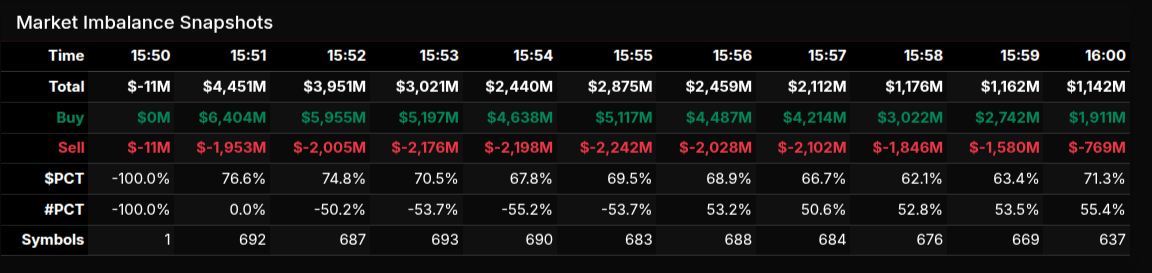
The MOC developed into a firmly buy-skewed close, but the path there mattered. At 15:50, the market was effectively flat to slightly negative at -$11M, with just one symbol on the board, so there was no meaningful directional read yet. One minute later, the imbalance opened in force as buy money surged to $6.404B against $1.953B for sells, producing a $4.451B net buy imbalance. From there, the tape stayed decisively positive into the bell, although the total steadily cooled as buy interest faded from its early peak. Net imbalance stepped down from $4.451B at 15:51 to $3.021B at 15:53, bounced modestly around 15:55, then faded to $1.142B by 16:00. Even with that moderation, the close still finished clearly buy-driven, with $1.911B to buy versus $769M to sell and a 71.3% dollar lean.
Index-level participation confirmed the tone. Nasdaq was the strongest market, showing a 94.0% dollar buy lean and a 71.1% symbol lean, which is particularly notable because anything above 66% signals more of a wholesale institutional buy program than a merely rotational flow. The S&P 500 was also strong at a 77.9% dollar lean, while the NYSE was more mixed, with a positive 58.2% dollar lean but a -53.1% symbol lean, suggesting internal rotation rather than broad-based urgency there.
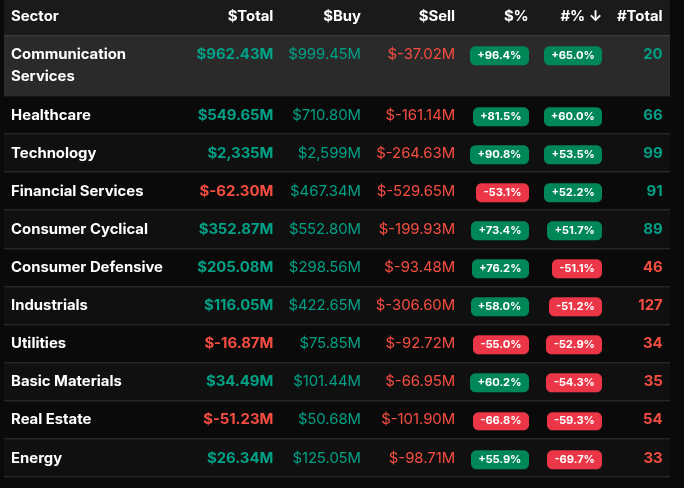
Technology led sector demand with a $2.335B net total and a 90.8% buy lean, while Communication Services posted 96.4%, another standout wholesale buy signal. Healthcare was also strong at 81.5%, and Consumer Cyclical came in at 73.4%. On the sell side, Real Estate registered -66.8%, marking a notable wholesale sell lean, while Utilities at -55.0% and Financial Services at -53.1% looked more rotational than outright liquidation.
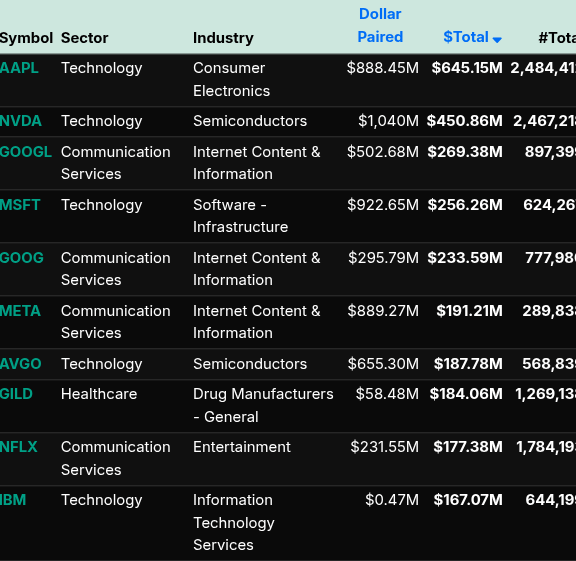
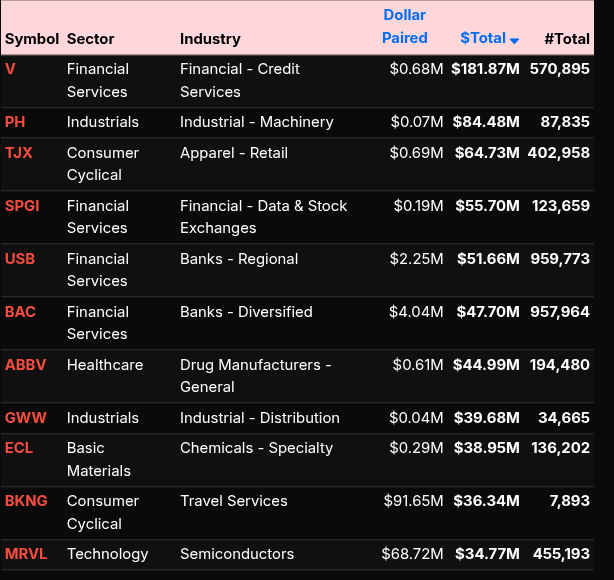
The biggest buy symbols were AAPL, NVDA, GOOGL, MSFT, GOOG, META, AVGO, GILD, NFLX, and IBM. Leading sells included V, PH, TJX, SPGI, USB, BAC, ABBV, GWW, ECL, BKNG, and MRVL. Overall, this was a tech-led institutional buy close with selective financials, real estate, and utility weakness.
ES Levels
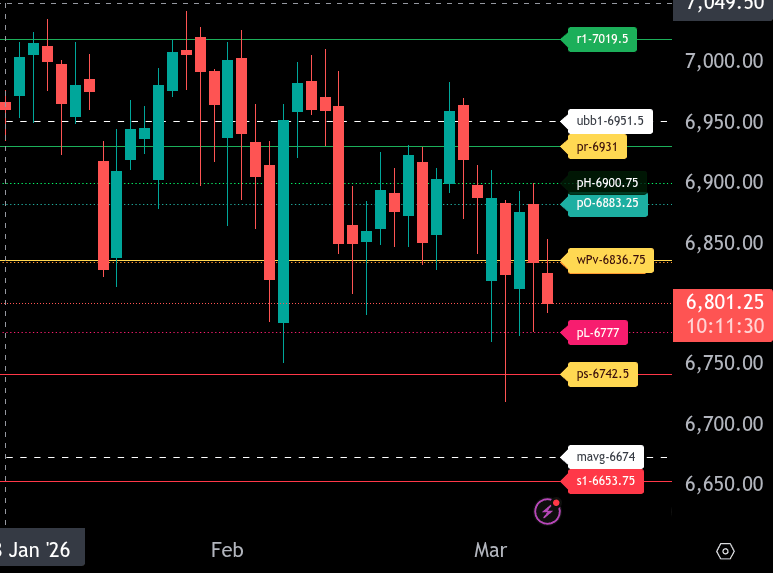
The bull/bear line for the ES is at 6836.75. That remains the key pivot for today. As long as price stays below this level, the tone remains bearish and rallies into that area can be faded unless buyers reclaim it and hold above.
ES is currently trading around 6800.75 in the Globex session, which keeps price below the bull/bear line and under pressure. The first support comes in at 6777.00. If that level breaks, the lower range target for today is 6742.50. A failure there opens the door to deeper downside toward 6674.00 and then 6653.75.
On the upside, resistance begins at 6836.75, then 6883.25 and 6900.75. If buyers can recover the bull/bear line and build above it, the next upside objective is 6931.00, which is the upper range target. Above that, 6951.50 becomes the next resistance level, followed by 7019.50 if momentum expands.
Overall, the ES remains weak while below 6836.75. Bulls need to reclaim that level to shift intraday sentiment back higher, while bears stay in control below it with 6777.00 and 6742.50 as the main downside targets.
NQ Levels
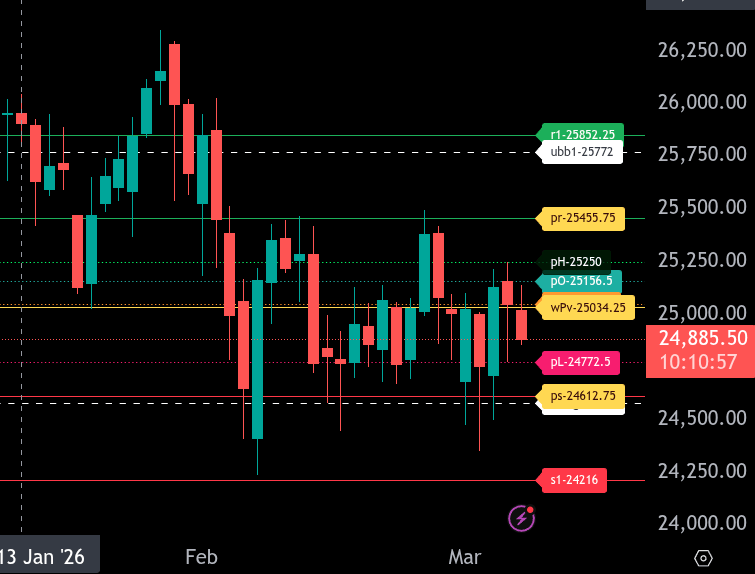
The bull/bear line for the NQ is at 25034.25. This is the key pivot for today. As long as price stays below it, the tone remains bearish and rallies into that area can be sold unless buyers can reclaim it and hold above it.
NQ is trading around 24885.50 in the current Globex session, which keeps price below the bull/bear line and below the nearby 25040.50 area. That leaves the market vulnerable to more downside pressure early in the session. The first support below is 24772.50, and below that, the lower range target comes in at 24612.75. If sellers push through 24612.75, the next downside reference is 24582.00, with deeper weakness opening the door to 24216.00.
On the upside, the first resistance is 25034.25. If NQ can reclaim that level, the next resistance levels are 25156.50 and 25250.00. Above that, the upper range target for today is 25455.75. If momentum remains strong above 25455.75, the next overhead levels to watch are 25772.00 and 25852.25.
Overall, the trend remains bearish while NQ is below 25034.25. Bulls need acceptance back above that line to shift the intraday tone, while bears stay in control on failed pushes into resistance and a move toward 24772.50 and 24612.75.
Technical Edge
Fair Values for March 6, 2026
-
SP: 5.63
-
NQ: 28.19
-
Dow: 25.78
Daily Breadth Data 📊
For Thursday, March 5, 2026
• NYSE Breadth: 28% Upside Volume
• Nasdaq Breadth: 54% Upside Volume
• Total Breadth: 51% Upside Volume
• NYSE Advance/Decline: 26% Advance
• Nasdaq Advance/Decline: 30% Advance
• Total Advance/Decline: 28% Advance
• NYSE New Highs/New Lows: 62 / 32
• Nasdaq New Highs/New Lows: 69 / 129
• NYSE TRIN: 0.91
• Nasdaq TRIN: 0.37
Weekly Breadth Data 📈
Week Ending Friday, February 27, 2026
• NYSE Breadth: 52% Upside Volume
• Nasdaq Breadth: 55% Upside Volume
• Total Breadth: 54% Upside Volume
• NYSE Advance/Decline: 43% Advance
• Nasdaq Advance/Decline: 46% Advance
• Total Advance/Decline: 45% Advance
• NYSE New Highs/New Lows: 446 / 178
• Nasdaq New Highs/New Lows: 576 / 554
• NYSE TRIN: 0.70
• Nasdaq TRIN: 0.68
Calendars
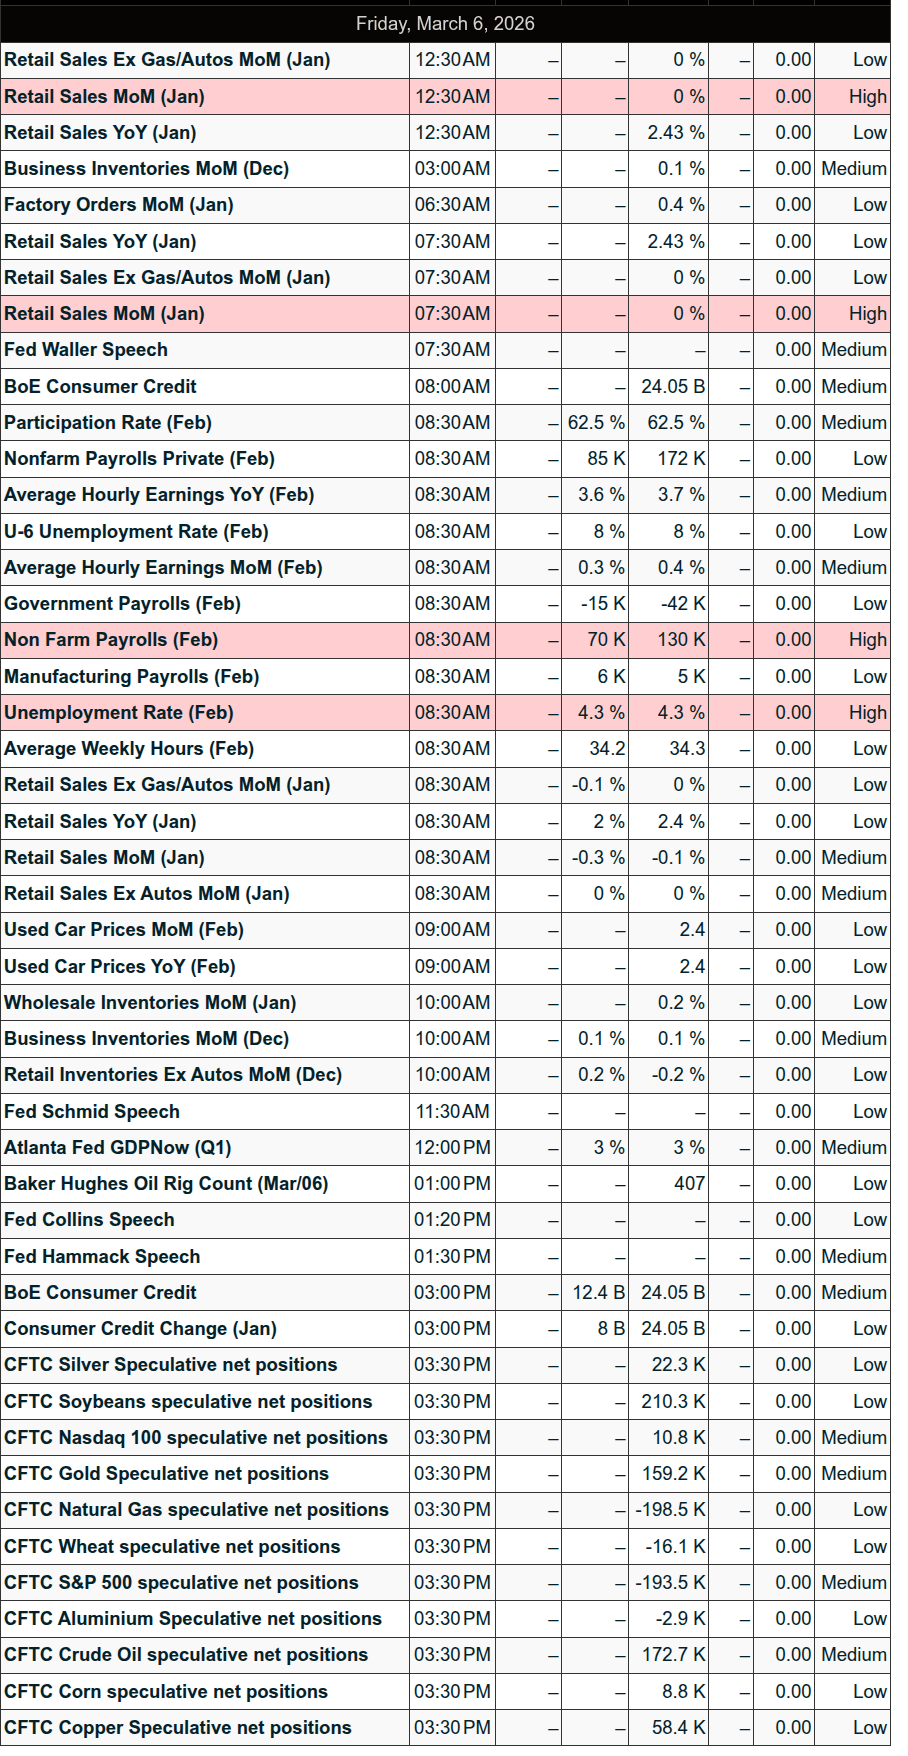
Economic Calendar Today
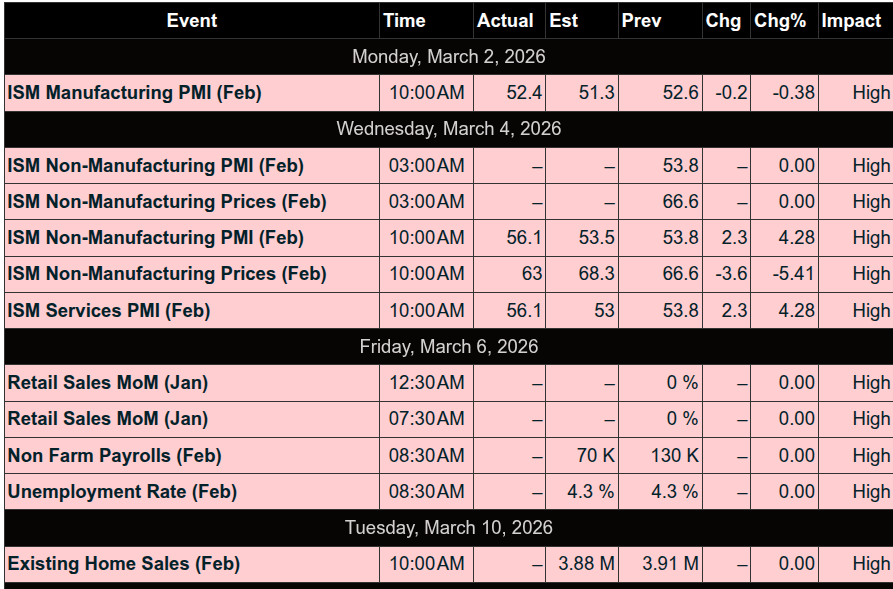
This Week’s High Importance
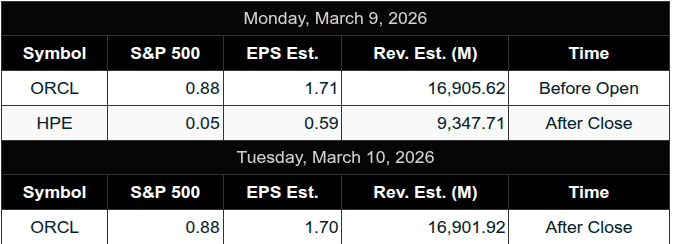
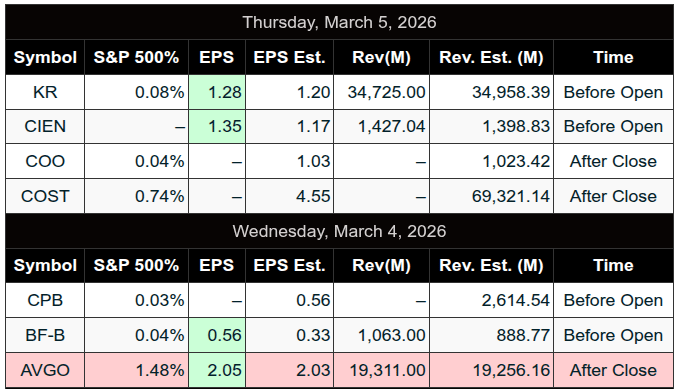
S&P 500 Earnings:
Upcoming:
Recent:
Trading Room News:
Polaris Trading Group Summary – For Thursday, March 5, 2026
The session began with David outlining a Cycle Day 1 framework, emphasizing the key pivot around 6885 ±5. The early plan was clear:
-
Bullish scenario: Acceptance above 6885 targeting 6910 → 6925 → 6940.
-
Bearish scenario: Acceptance below 6885 targeting 6865 → 6855 → 6835.
The room started the day focused and aligned with the plan, with members discussing levels and preparing for the open.
Morning Action – Early Support Trade Works
Shortly after the open, the market moved down into a key support zone around 6835, which had been highlighted in the Daily Trade Strategy briefing and reinforced by the Zero Gamma level around 6837.
-
The market tagged the 6835 area and quickly reversed, validating the pre-market analysis.
-
Multiple traders noted that other analysts had similar support levels, reinforcing confidence in the zone.
-
PeterN executed a PKB trade off the sweep of the overnight low.
-
Manny’s call of 6832–6837 support also produced quick +5 and +10 point gains.
This early reaction off support earned David the “PTG Kewpie Award Winner” for the accurate level call and provided the room with a strong start to the day.
Lesson reinforced:
When multiple analytical frameworks align on the same level, the probability of a strong reaction increases.
Mid-Morning – Bearish Rotation Fulfills Downside Targets
After the initial bounce, the market resumed its downward rotation.
David reminded the room of the Cycle Day 1 decline projection, targeting 6826–6820, which:
-
Was reached and fulfilled
-
Continued downward to the next projected level 6813, which was also tagged.
The room stayed focused on downside structure as the market continued trending lower.
Meanwhile, David noted that Crude Oil was the strongest instrument for the Open Range Breakout strategy, while ES and NQ struggled to gain traction, highlighting the importance of focusing on markets showing clean movement.
Lesson reinforced:
Sometimes the best opportunity is not forcing trades in choppy markets but recognizing when another instrument offers cleaner setups.
Afternoon – Key Support Battle
As the session progressed, David identified the next key downside levels:
-
6795
-
6775 major support
By mid-afternoon, price approached the 6775 zone, where David described “bulls attempting a goal line defensive play.”
This area became the session low around 6776, marking a successful defense by buyers.
For any sustained recovery, David highlighted 6800–6805 as the key resistance zone bulls needed to reclaim.
Late Day Rally – Imbalance Driven
Late in the session, the market staged a sharp rally from the lows, moving back toward 6825.
The move was largely attributed to:
-
Position squaring
-
A significant $4.7B MOC buy imbalance
Price ultimately pushed back toward Midpoint VWAP, providing a classic late-day recovery after an extended intraday decline.
Key Takeaways from the Day
-
Preparation Paid Off
The 6835 support level from the Daily Trade Strategy produced one of the cleanest reactions of the morning. -
Respect the Cycle Day Framework
The Cycle Day 1 downside projection (6826–6820) was fulfilled and led to continued downside follow-through. -
Alignment Increases Trade Quality
The early support zone was validated because multiple traders and systems identified the same level. -
Watch Key Support Battles
The 6775 area acted as the “goal line defense”, ultimately holding as the Cycle Day low at 6776. -
Understand Late-Day Flows
The afternoon rally was largely driven by MOC buy imbalance and position squaring, not necessarily structural bullish momentum.
Overall Tone of the Day
-
Strong early level-to-level trading
-
Excellent validation of pre-market strategy levels
-
Good reminders about patience, alignment, and capital preservation
David wrapped the session reminding the room that Friday is “Capital Preservation Fryday” — a day to trade selectively and protect the week’s gains.
DTG Room Preview – Friday, March 6, 2026
-
Market focus today: February Jobs Report at 8:30am ET alongside ongoing Middle East conflict developments.
-
Energy markets:
-
Oil prices up 18% this week, the largest surge since 2022.
-
Conflict has effectively halted tanker traffic through the Strait of Hormuz, which normally carries ~20% of global oil supply.
-
Diesel futures up over 40% this week; European low-sulfur gasoil futures up 44%.
-
U.S. retail gasoline prices up ~9% (AAA).
-
Goldman Sachs warns oil could rise above $100 if disruptions persist.
-
-
Government responses:
-
U.S. considering tapping the Strategic Petroleum Reserve.
-
Japan evaluating use of reserves; China prioritizing domestic fuel supply and suspending exports.
-
U.S. temporarily eased restrictions allowing India to purchase Russian oil.
-
-
Geopolitics:
-
Israel launched additional missile strikes; Saudi Arabia and Qatar reported intercepting missile/drone attacks.
-
Iran says it will not negotiate and is prepared for escalation, while the U.S. stated no plans for ground troops.
-
-
Corporate news:
-
Oracle (ORCL) planning thousands of layoffs to offset costs of a major AI data center buildout, with negative cash flow expected during expansion through 2030.
-
Anthropic plans a legal challenge after the Pentagon labeled the company a U.S. supply chain threat, risking $200M in defense contracts and partnerships tied to military AI systems.
-
-
Earnings: No major earnings until Monday after the close (HPE, CASY).
-
Economic calendar:
-
8:30am: Non-Farm Payrolls, Unemployment Rate, Avg Hourly Earnings, delayed Retail Sales
-
10:00am: Business Inventories
-
3:00pm: Consumer Credit
-
Multiple Fed speakers throughout the day.
-
-
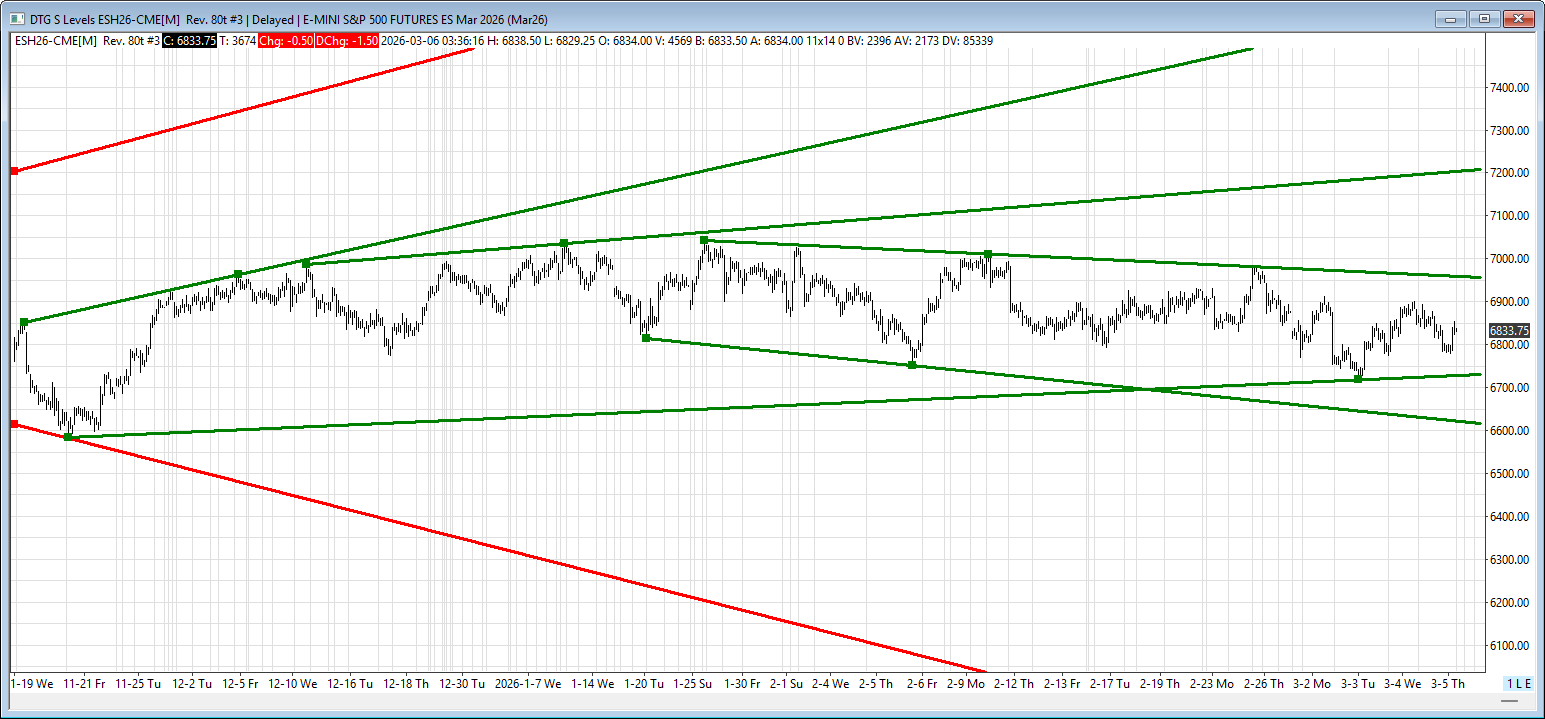
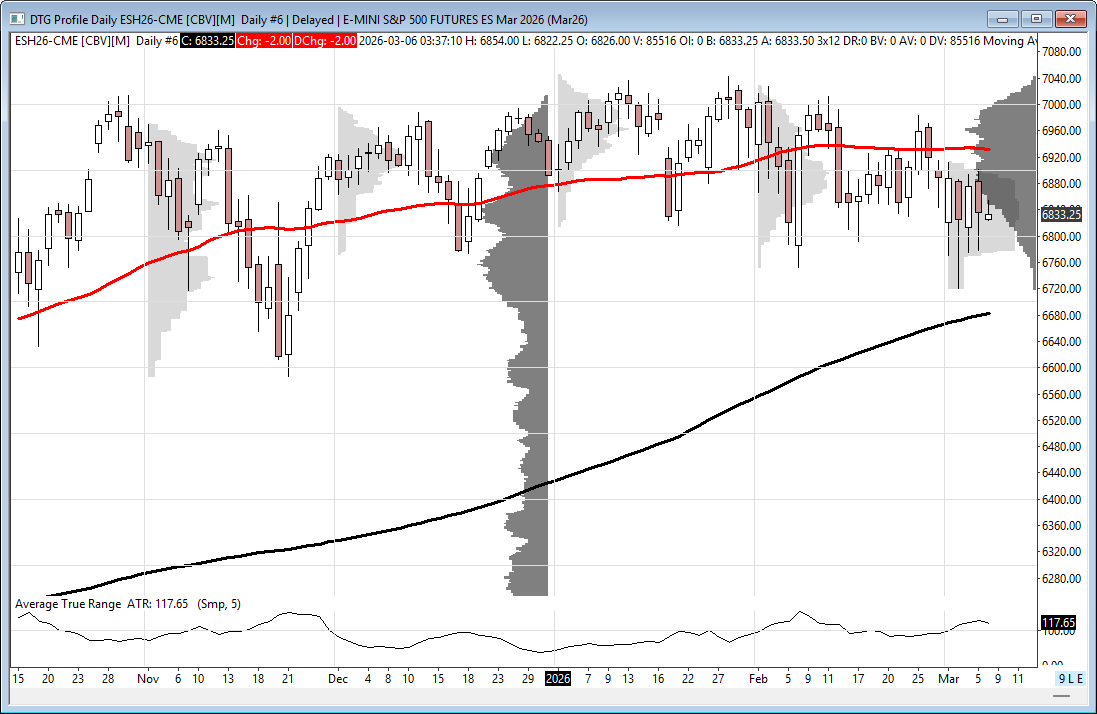
Market structure / ES levels:
-
Volatility remains elevated; 5-day average range ~127 points.
-
ES trading below the 50-day MA (6931) resistance and above 200-day MA (6683) support.
-
Key resistance: 6956–6959, then 7205–7210.
-
Key support: 6728–6733, then 6609–6614.
-
-
Other note: U.S. daylight saving time begins Sunday, shifting market hours one hour earlier for traders outside the U.S..
Affiliate Disclosure: This newsletter may contain affiliate links, which means we may earn a commission if you click through and make a purchase. This comes at no additional cost to you and helps us continue providing valuable content. We only recommend products or services we genuinely believe in. Thank you for your support!
Disclaimer: Charts and analysis are for discussion and education purposes only. I am not a financial advisor, do not give financial advice and am not recommending the buying or selling of any security.
Remember: Not all setups will trigger. Not all setups will be profitable. Not all setups should be taken. These are simply the setups that I have put together for years on my own and what I watch as part of my own “game plan” coming into each day. Good luck!!
Follow @MrTopStep on Twitter and please share if you find our work valuable!
This post goes out as an email to our subscribers every day and is posted for free here around 2 PM ET. To get your real-time copy, sign up for the free or premium version here: Opening Print Subscribe.
Comments are closed