This post goes out as an email to our subscribers every day and is posted for free here around 2 PM ET. To get your real-time copy, sign up for the free or premium version here: Opening Print Subscribe.
June Breakout: Why This Month Could Seal a Bullish 2025
Follow @MrTopStep on Twitter and please share if you find our work valuable!
Our View
There are a couple of heavy hitters up today for economic news. The Q1 final GDP will be a rear-looking view of the type of revisions to expect with GDP QoQ final to come in at -0.2. The first read was -0.3% on 4/30, then -0.2% on 5/29, so we are watching the trend on the final to get a better understanding of where we are coming from.
Durable goods orders are out at 8:30 am today, where we will get another glimpse of orders for manufactured goods. It has been a bumpy indicator with orders being pushed and pulled. Last read was -6.3% in April, with an expected rebound for today’s May look to be around 8%.
Below are some stats from our partner Handelstats.com. This is an end-of-June indicator that is setting up. June could provide an extended squeeze as the door come to a close. Reach out to Rich at https://www.handelstats.com/ to gain access to his best studies. Always timely and revealing.
June Performance in the SPX: A Historical Overview
Since 1970, the month of June has shown intriguing patterns within the SPX index. Over the last 55 years, June has ended higher 33 times and lower 22 times. However, when June surpasses the high of the first five months, the statistics become even more compelling.
This occurrence—June taking out the high of the first five months—has happened 23 times. Historically, in those instances, the year has ended higher 22 times, with only one year finishing lower. The current first five-month high for the SPX stands at 6147.43, and if June trades above this threshold, it signals strong momentum for the remainder of the year.
Digging deeper, when June closes the month above the high of the first five months, there has never been a down year. In fact, this scenario has occurred 16 times, and the average annual return following such a close has been an impressive 21.66%. These data points underline the significance of June’s performance in shaping positive annual outcomes within the SPX.
June Performance Statistics from Handelstats.com – HandelStats.com 2025©™
1. Frequency of June Ending Higher vs. Lower Since 1970
Outcome
Number of Occurrences
Percentage
Ended Higher
33
60%
Ended Lower
22
40%
2. Impact of June Surpassing the High of the First Five Months
Scenario
Occurrences
Annual Outcomes
Year Ends Higher
22
95.65%
Year Ends Lower
1
4.35%
Our Lean
We remain bullish going into the end of June, assuming that geopolitical news trends in a good direction. Less death and destruction, and more getting on.
Our Lean: If you find a good pullback, take it. There are plenty still trapped to the short side as we ride to all-time high territory.
MiM and Daily Recap
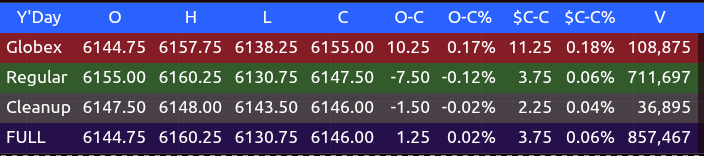
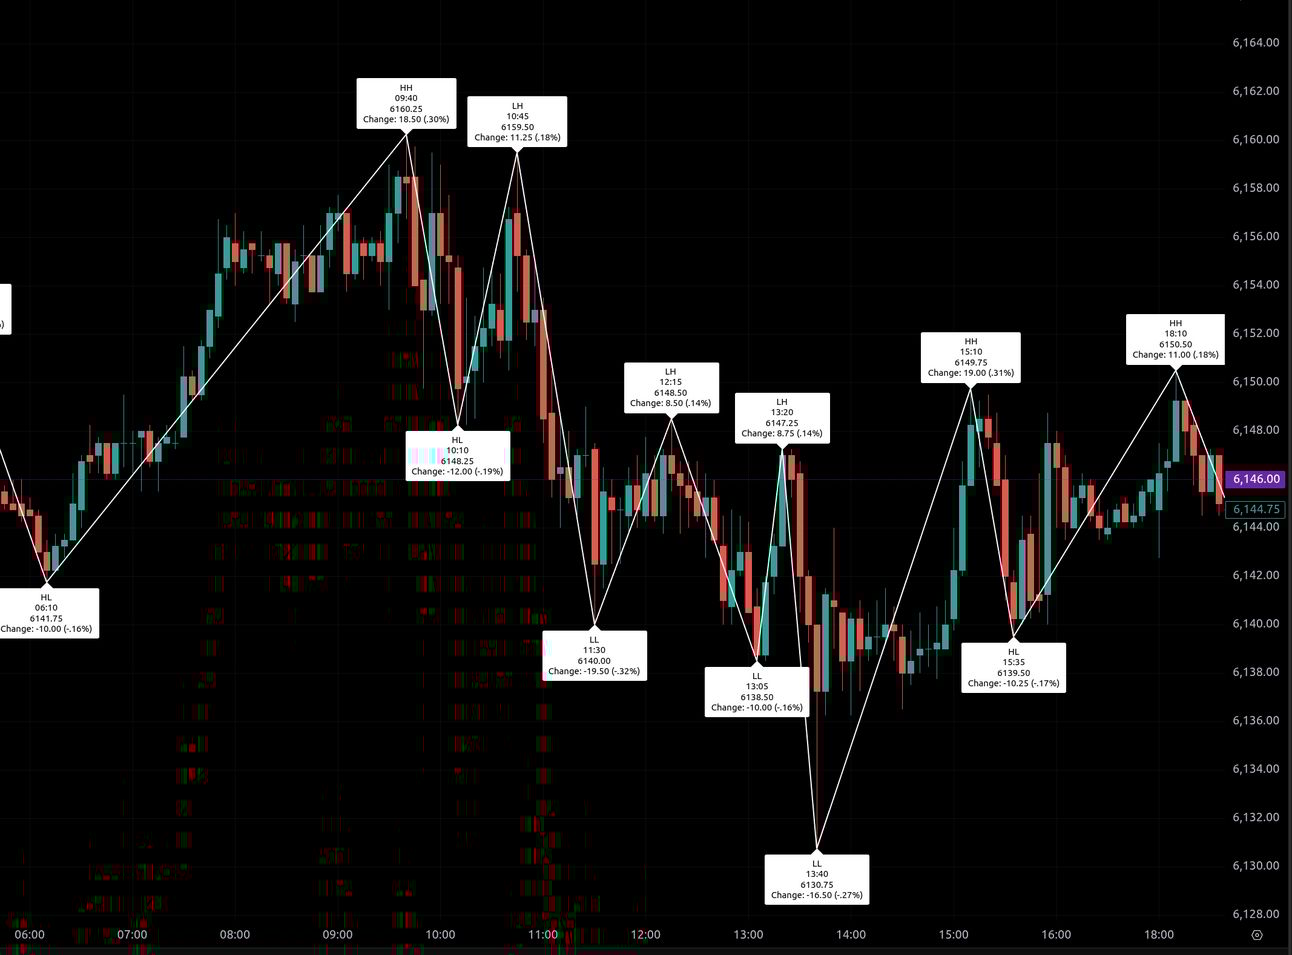
Wednesday’s ES session opened the regular hours at 6155.00 following a modestly positive overnight Globex session that saw prices climb from a 6144.75 open to a 6155.00 close (+10.25, or +0.17%). Early premarket strength carried into the open as ES extended upward to a morning high of 6160.25 at 9:40 AM, marking an 18.50-point gain (+0.30%) from the 8:15 swing low at 6144.00. However, this strength quickly faded.
Sellers stepped in and drove price down to a low of 6148.25 by 10:10 AM, then further to a deeper low of 6140.00 at 11:30 AM, completing a 22.50-point retracement (-0.37%) off the morning peak. A midday rebound attempted to stabilize the session, lifting price to 6148.50 at 12:15 PM and 6147.25 at 1:20 PM, but both attempts formed lower highs, suggesting continued downside pressure.
A secondary leg lower dropped to a session low of 6130.75 at 1:40 PM, marking a full 31.75-point reversal (-0.52%) from the morning high. From there, buyers staged a recovery into the late afternoon.
The bounce lifted price to 6149.75 at 3:10 PM, up 19.00 points (+0.31%) from the session low. After a pullback to 6139.50 by 3:35 PM, a final rally brought the ES to 6147.50 at 4:00 PM. The cash session settled at 6147.50, down 7.50 points (-0.12%) from the open, but up 3.75 points (+0.06%) from the previous day’s cash close.
Cleanup trading from 4:00 to 5:00 PM saw the ES drift sideways, ending at 6146.00, down 1.50 points (-0.02%) from the regular close.
Market Tone & Notable Factors:
Overall sentiment was mixed to bearish, marked by lower highs through the midday and early afternoon, and sustained pressure from sellers. Despite early strength and a modest overnight gain, the regular session failed to hold momentum, instead delivering a shallow but persistent decline.
Volume was low, with 711,697 contracts traded during regular hours and a total session volume of 857,467. The cash-to-cash move posted a modest gain of +3.75 points (+0.06%), while the intraday open-to-close movement reflected a net decline of 7.50 points (-0.12%), highlighting the struggle to sustain directional conviction.
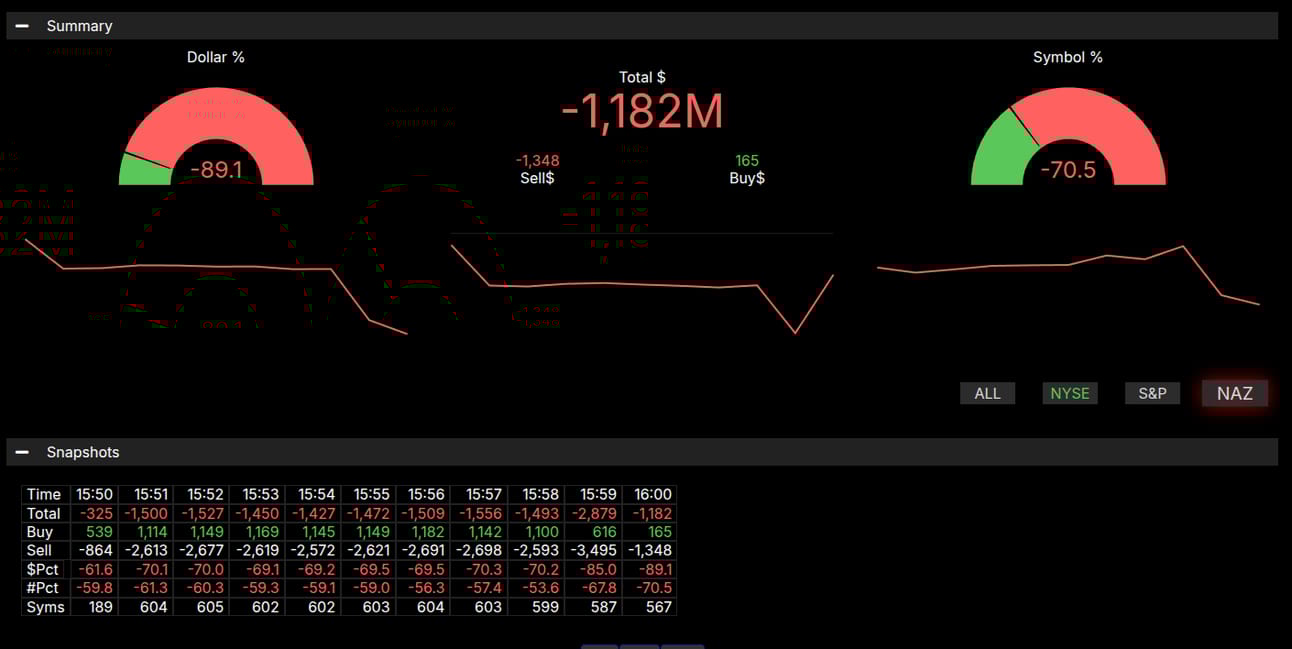
Notably, the Market-on-Close (MOC) imbalance data revealed a strong sell-side imbalance of $1.182B, with a symbol imbalance of -70.5%, crossing the meaningful threshold of -66%. This aggressive sell skew, visible in the final 10 minutes, aligned with the late-session weakness and likely capped the afternoon recovery. Despite several bounce attempts, the weight of the imbalance helped enforce a soft close and may continue to pressure futures into the next session.
Guest Posts:
Dan @ GTC Traders
Robust Trading Programs
At GTC Traders, every trade we execute is filtered through the lens of meticulously tested trading programs. Although we recognize that one could trade in a purely discretionary manner … our approach is to trade programs built to endure. The GTC Sample Portfolio comprises three distinct “accounts,” each crafted with a specific purpose:
-
Equity Fixed Income Hybrid Core Model: This model blends equities and fixed income securities to generate consistent monthly income. It prioritizes yield stability while carefully managing risk to deliver reliable returns for our clients.
-
Long-Short Valuation Model: Rooted in fundamental analysis, this strategy takes long positions in undervalued assets and short positions in overvalued ones, exploiting market inefficiencies to drive profits.
-
Short-Term Trading Book: This account runs multiple trading programs designed to capture short-term market movements. It combines technical indicators, sentiment analysis, and macroeconomic insights to seize fleeting opportunities.
While we apply discretion in our trading, every decision is grounded in trading programs that have undergone rigorous robustness testing. But what exactly does it mean to have a robust trading program, and why is it so critical in today’s markets?
What is Robustness Testing?
Robustness testing is the cornerstone of a reliable trading strategy. It’s the process of validating a program’s performance across diverse market conditions, ensuring it’s not just a fluke tied to historical data.

A robust trading program is one that thrives in the face of uncertainty, delivering consistent results regardless of market shifts. Key testing methods include:
-
Out-of-Sample Testing: Evaluating the strategy on data not used during its development to confirm its effectiveness in real-world scenarios.
-
Walk-Forward Optimization: Periodically re-optimizing parameters using only historical data available at the time, mimicking live trading conditions.
-
Stress Testing: Subjecting the strategy to extreme market events, such as volatility spikes or economic shocks, to assess its resilience.
-
Parameter Sensitivity Analysis: Testing how changes in input parameters (e.g., indicator periods) affect performance, ensuring the strategy isn’t overly sensitive to specific settings.
A robust trading program isn’t a one-hit wonder. It is a program that performs reliably across time periods, market environments, and parameter variations. This is what separates a strategy that survives from one that crumbles under pressure.
2025: A Year of Macro-Economic and Trading Challenges
The year 2025 has been a crucible for traders. The World Bank reports global growth slowing to 2.3%, weighed down by escalating trade barriers and policy uncertainty. The IMF notes persistent inflationary pressures, with global headline inflation hovering above target levels, complicating monetary policy decisions. Trade tensions, including tariff announcements, have fueled market volatility, with the S&P 500 suffering one of its worst starts in history, dropping 5.1% by March 2025, though recovering to a modest 0.51% year-to-date gain by May, according to S&P Global.
These conditions … slowing growth, sticky inflation, and policy-driven volatility … create a minefield for trading programs. Strategies that rely on stable trends or predictable data can falter when faced with such unpredictability. The question for traders is: How do you know your program remains effective when new, out-of-sample data from 2025 tests its limits?
GTC’s Performance in 2025
At GTC Traders, our answer lies in the robustness of our programs. Despite the turbulent markets of 2025, our three accounts—Equity Fixed Income Hybrid Core Model, Long-Short Valuation Model, and Short-Term Trading Book—have not only stayed within their expected performance variance but have outperformed the S&P 500 Index. While the S&P 500 struggled with early-year losses and volatility, our programs navigated these challenges with precision, capitalizing on opportunities where others saw only risk.
This outperformance is no accident. It’s the result of our unwavering commitment to robustness testing. By ensuring our strategies are resilient to a wide range of market conditions, we’ve built systems that thrive in uncertainty. Whether it’s the steady income from our Hybrid Core Model, the value-driven gains from our Long-Short Model, or the agile trades in our Short-Term Book, our programs have proven their mettle in 2025’s challenging environment.
Build for Resilience
The markets of 2025 remind us that trading is not about predicting the future … it’s about preparing for it. A robust trading program is your greatest asset in navigating the chaos of global markets. It’s not enough to have a strategy that works in backtests; it must withstand the real-world tests of volatility, policy shifts, and economic surprises.
We urge every trader to ask: How robust are your trading models? Are they built to endure the storms of markets like those we’ve seen in 2025? At GTC Traders, our success stems from our relentless focus on robustness, and we encourage you to adopt the same mindset. Test your strategies, stress them, and ensure they can handle whatever the markets throw at them.
Until next time, stay safe … and trade well.
Technical Edge
Fair Values for June 26, 2025
-
S&P: 51.15
-
NQ: 218.12
-
Dow: 306.31
Daily Breadth Data 📊
For Wednesday, June 25, 2025
-
NYSE Breadth: 22.96% Upside Volume
-
Nasdaq Breadth: 48.85% Upside Volume
-
Total Breadth: 45.81% Upside Volume
-
NYSE Advance/Decline: 29.29% Advance
-
Nasdaq Advance/Decline: 36.26% Advance
-
Total Advance/Decline: 33.61% Advance
-
NYSE New Highs/New Lows: 58 / 25
-
Nasdaq New Highs/New Lows: 189 / 92
-
NYSE TRIN: 1.25
-
Nasdaq TRIN: 0.59
Weekly Breadth Data 📈
For the Week Ending Friday, June 20, 2025
-
NYSE Breadth: 48.20% Upside Volume
-
Nasdaq Breadth: 56.81% Upside Volume
-
Total Breadth: 53.47% Upside Volume
-
NYSE Advance/Decline: 49.03% Advance
-
Nasdaq Advance/Decline: 48.44% Advance
-
Total Advance/Decline: 48.67% Advance
-
NYSE New Highs/New Lows: 137 / 106
-
Nasdaq New Highs/New Lows: 327 / 266
-
NYSE TRIN: 1.02
-
Nasdaq TRIN: 0.39
S&P 500/NQ 100 BTS Trading Levels (Premium Only)
BTS Levels:
ESM2025
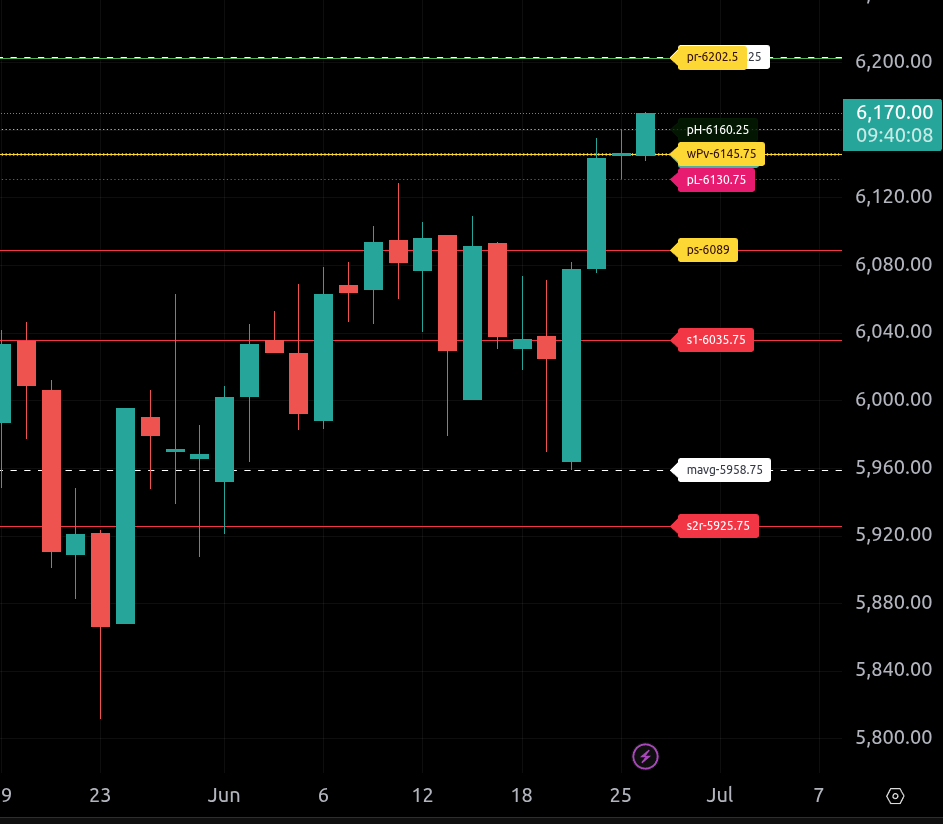
The bull/bear line for ES is at 6145.75. This is the pivotal level that will guide directional bias for today’s session. Trading above this level keeps bullish momentum in play; failure to hold it opens the door for downside testing.
As of now, ES is trading around 6169.75, showing strength above the bull/bear line. As long as the market remains above 6145.75, buyers may attempt to extend the rally.
The upper range target is at 6202.50. If bulls maintain control and push above yesterday’s high of 6160.25, this target comes into play. Beyond that, further resistance lies at 6255.75.
If sellers regain control, initial support comes at 6130.75, followed by a key downside zone at 6089.00. Breaking below that level would bring the lower range target of 6035.75 into focus. Should weakness persist, the next layers of support are at 5958.75, 5925.75, and 5702.25.
In summary, the trend remains bullish above 6145.75, with an eye on 6202.50 and 6255.75. A sustained move below 6145.75 could shift the tone bearish toward 6035.75 and potentially lower into the 5900s. Trade with discipline around the pivot.
NQM2025
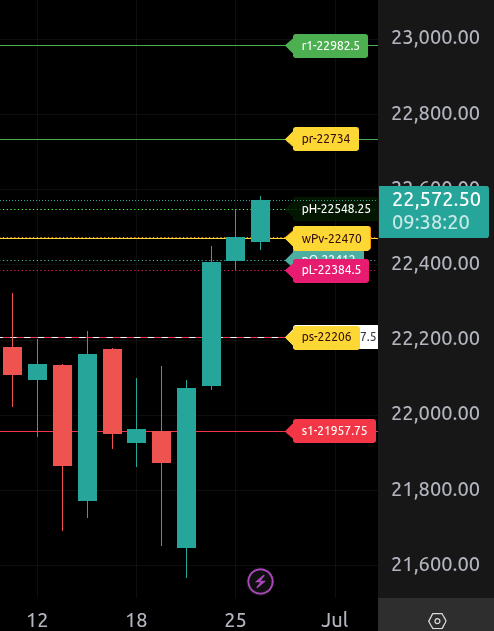
The bull/bear line for the NQ is at 22,470.00. This is the key pivot for the day. Holding above this line signals bullish momentum continuation. Below it, we shift toward a more defensive, short-bias setup.
Currently, NQ is trading around 22,570.50, which is well above the bull/bear line and indicates strength in the Globex session. If this strength persists into the RTH session, we target an advance toward the upper range target of 22,734.00. Should momentum continue beyond this level, the next resistance is at 22,982.50.
On the downside, the first support is the pH from yesterday at 22,548.25, followed by the bull/bear line itself. If that breaks, look for further pressure into the lower range target of 22,206.00. Below that, deeper support rests at 21,957.75.
The trend bias remains bullish above 22,470.00, but traders should stay nimble around that level as a failure to hold it could flip intraday sentiment back to the downside.
Trading Room News:
Polaris Trading Group Summary: Wednesday, June 25, 2025
Wednesday’s trading session in the PTG room reflected a measured and disciplined approach under the leadership of PTGDavid. The day opened with a bullish lean and a clear set of expectations based on Cycle Day 2 rhythms, anticipating a normal range movement.
Key Highlights:
-
Morning Strategy & Execution:
The day started with price action respecting the Daily Trade Strategy’s (DTS) target zone. The initial DTS target of 6155 was achieved early, confirming the bullish setup. Price movement stayed aligned with the MATD rhythm, and PTGDavid maintained a bullish bias until midday. -
Technical Education & Interaction:
A significant portion of the morning session was devoted to in-depth trader education. PTGDavid provided insights into institutional setups like the “Peek-a-Boo” (look below & fail) pattern. There was extensive interaction with a highly engaged group, especially a new participant (“anon”) who asked numerous high-quality questions. Topics included risk management, expected value, market structure, and professional trading experiences. -
Afternoon Action & Adjustments:
As the market tested the 6145 “Line in the Sand,” PTGDavid flagged a potential shift in sentiment. The price ultimately followed the Bear Scenario, hitting the 6135–6130 zone precisely as forecasted—demonstrating strong predictive alignment with DTS levels. -
Volume & Market Sentiment:
Volume by 2 PM reached 590k, indicative of the typical summer trading slowdown. Commentary turned more humorous and casual in the afternoon, reflecting the seasonal tone. A Market-on-Close (MOC) sell imbalance of $1.4B was noted, highlighting the end-of-day shift toward sellers.
Positive Outcomes & Lessons:
-
Precise execution of DTS targets showcased the value of disciplined scenario planning.
-
Traders benefited from a masterclass in institutional trade logic, particularly around market-making behavior, inventory correction, and the anatomy of poor highs/lows.
-
The room fostered an excellent learning environment, with newer traders gaining rare insights from David’s deep industry background.
-
Reinforcement of key concepts like “expected value” and sticking to trading rules during drawdowns provided valuable psychological resilience tools.
Closing Thought:
The day was a blend of profitable trade execution and rich educational value. With market conditions transitioning into slower summer rhythms, the room emphasized patience and adaptability—a fitting mindset for the season ahead.
DTG Room Preview – Thursday, June 26, 2025
-
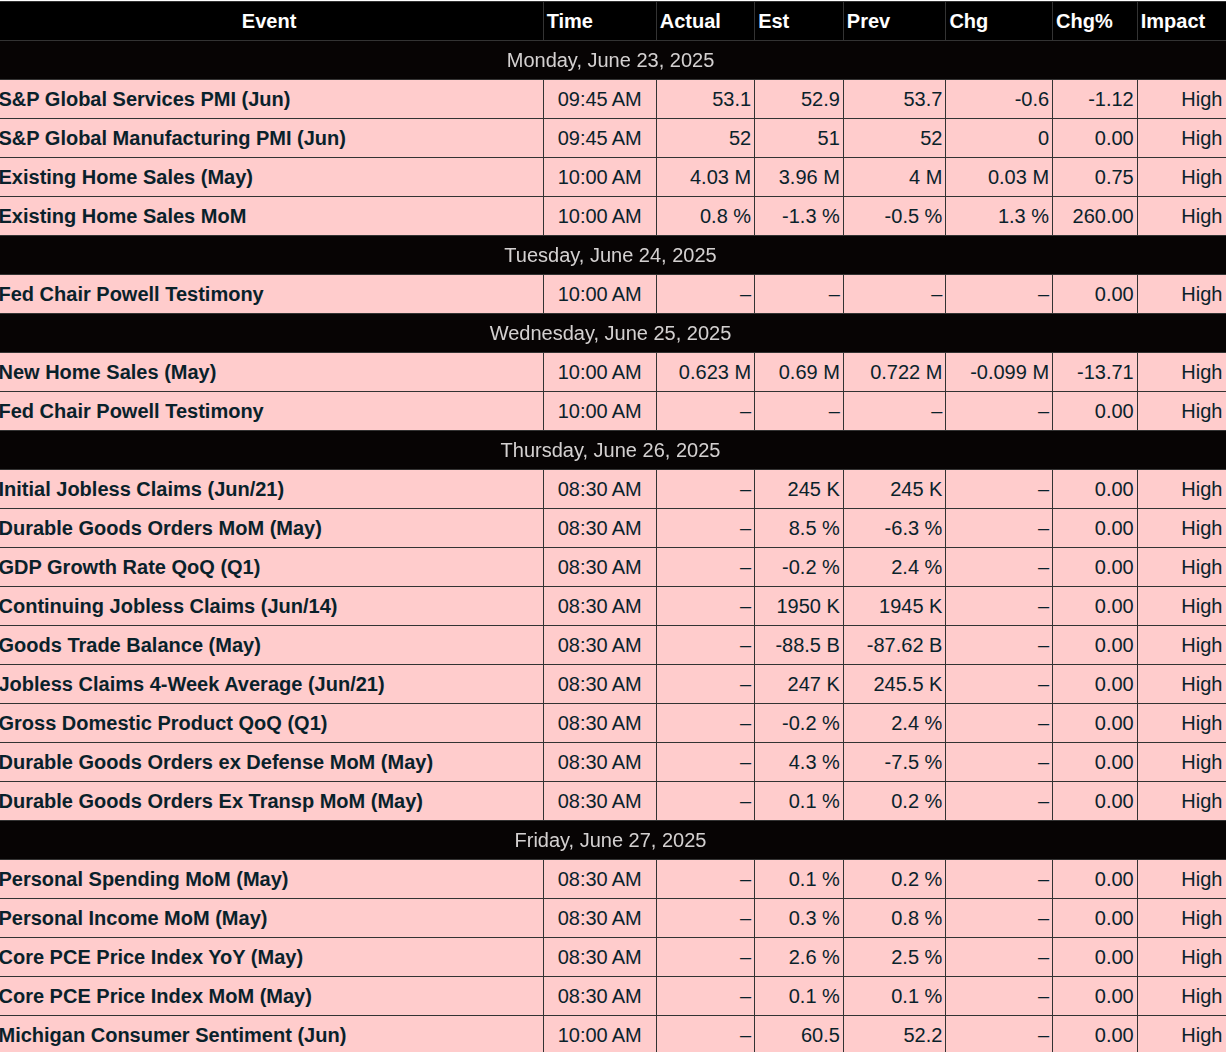
Macro & Fed: Markets waver as S&P 500 flirts with record highs. Fed Chair Powell remains cautious on rate cuts, citing tariff-related inflation still to come. Trump, frustrated with the Fed’s stance, may announce a successor to Powell as early as September.
-
Key Economic Data: Watch for tomorrow’s PCE inflation report. Today’s calendar includes GDP, Durable Goods, Jobless Claims (8:30am ET), Pending Home Sales (10:00am ET), and multiple Fed speakers.
-
Market Breadth Concerns: Only 3 of 11 S&P sectors have hit all-time highs, while the equal-weight S&P 500 lags by over 4%. This narrow rally suggests overbought conditions and potential for correction if leadership doesn’t broaden.
-
Nvidia Soars: NVDA jumped 4% to a record $154.31, hitting a $3.6T market cap. Loop Capital hiked its price target to $250, eyeing a $6T valuation.
-
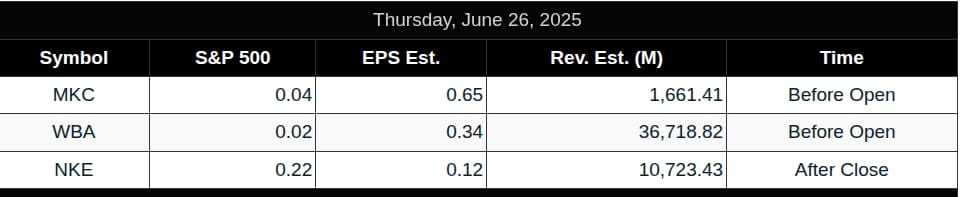
Earnings Watch: McCormick (MKC) reports premarket; Nike (NKE) after the bell.
-
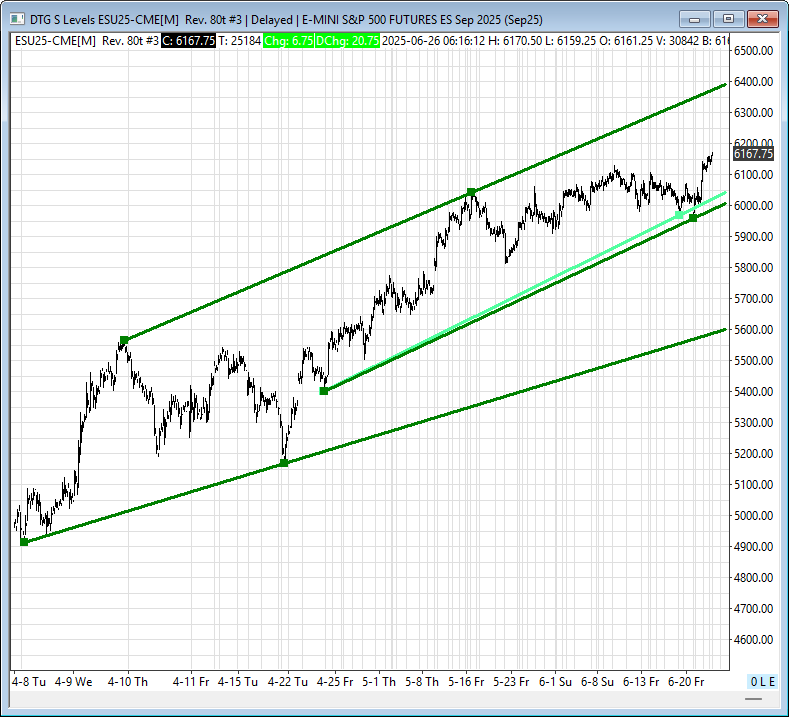
Technical Levels & Volatility: ES is mid-channel under the Dec ’24 high of 6285.75. Key TL resistance: 6385/90s; support: 6033/36s, 5998/01s. Volatility declined, with a 5-day average range of 78 points. No strong overnight whale bias.
Calendars
Economic Calendar Today
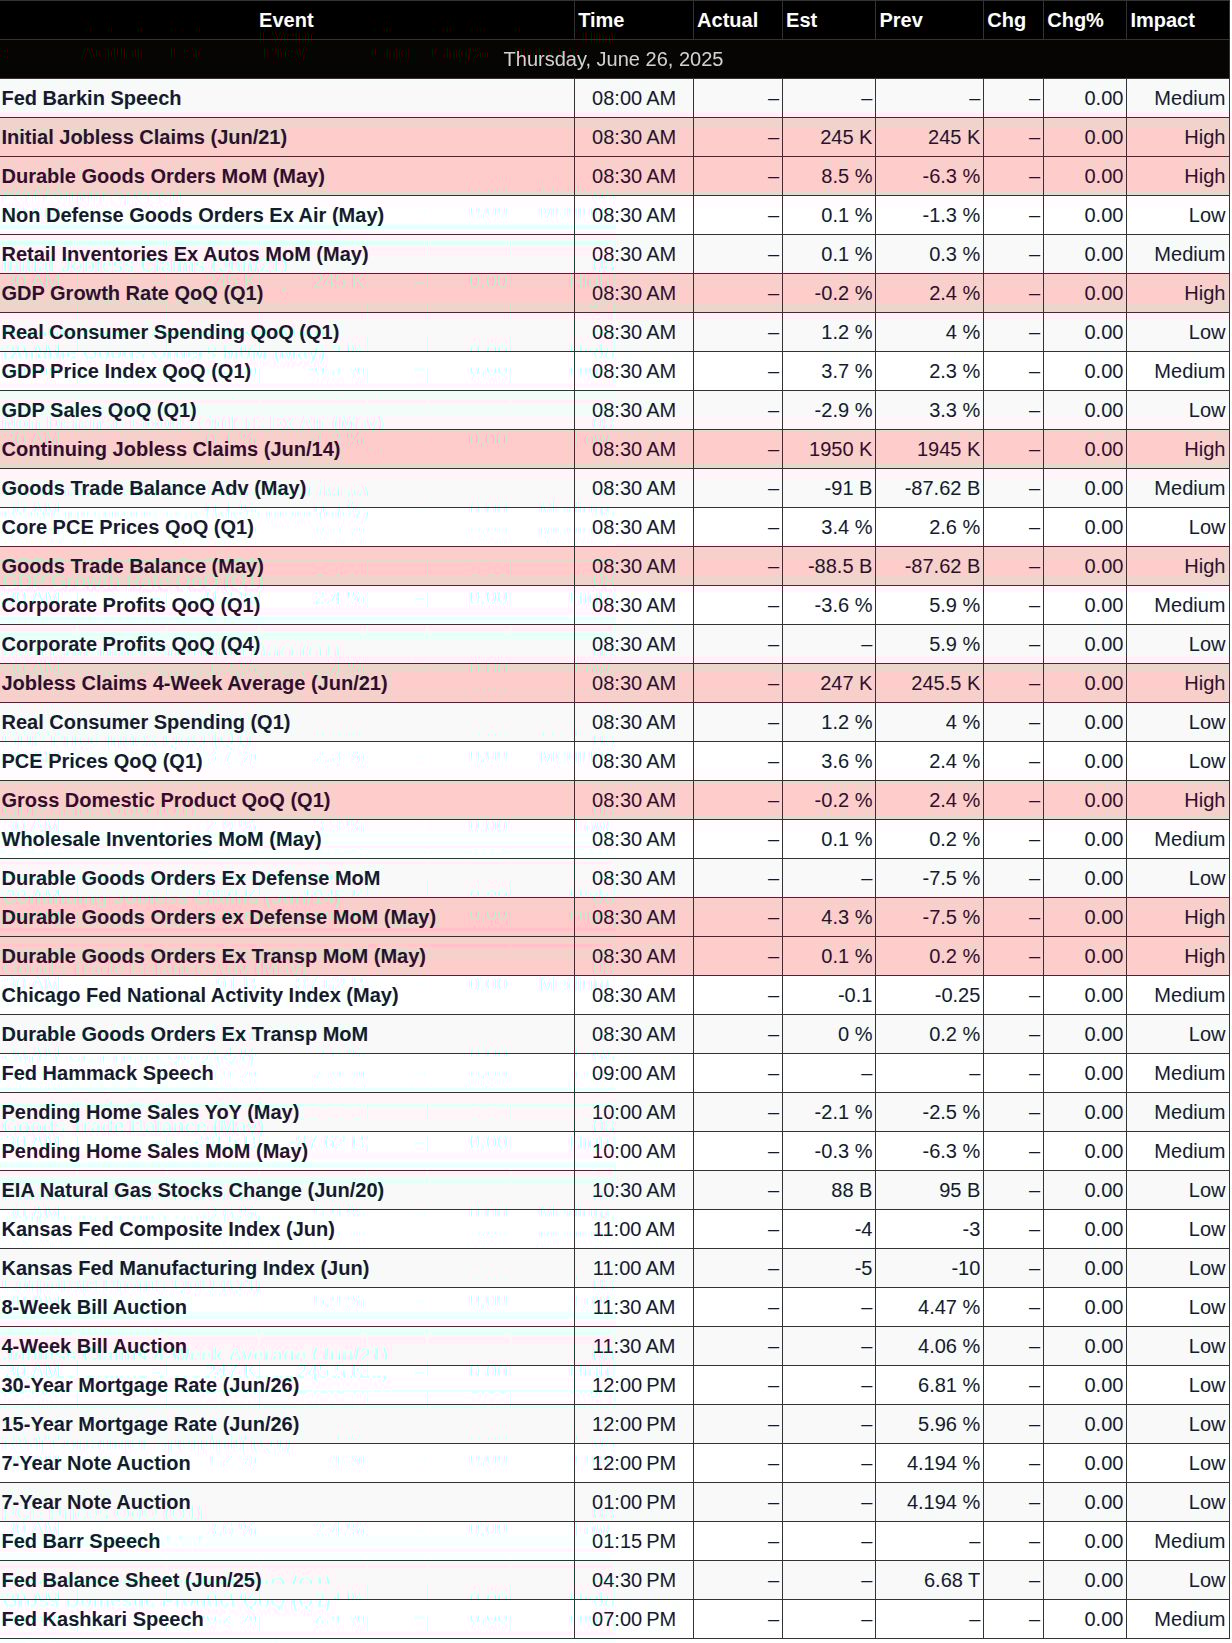
This Week’s High Importance
Earnings:
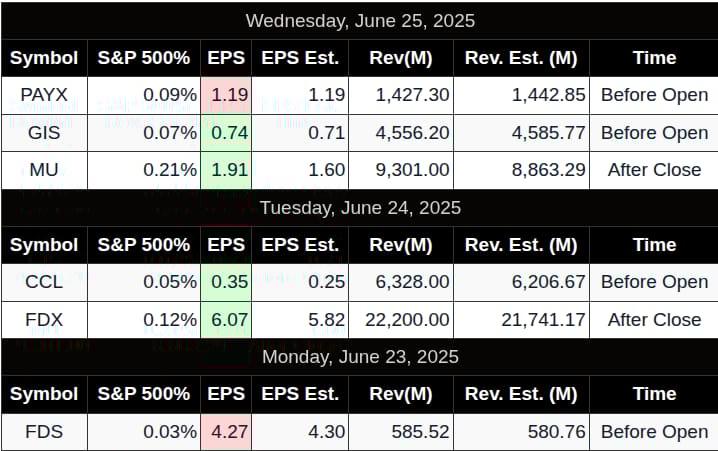
Released
Affiliate Disclosure: This newsletter may contain affiliate links, which means we may earn a commission if you click through and make a purchase. This comes at no additional cost to you and helps us continue providing valuable content. We only recommend products or services we genuinely believe in. Thank you for your support!
Disclaimer: Charts and analysis are for discussion and education purposes only. I am not a financial advisor, do not give financial advice and am not recommending the buying or selling of any security.
Remember: Not all setups will trigger. Not all setups will be profitable. Not all setups should be taken. These are simply the setups that I have put together for years on my own and what I watch as part of my own “game plan” coming into each day. Good luck!
This post goes out as an email to our subscribers every day and is posted for free here around 2 PM ET. To get your real-time copy, sign up for the free or premium version here: Opening Print Subscribe.
Comments are closed