This post goes out as an email to our subscribers every day and is posted for free here around 2 PM ET. To get your real-time copy, sign up for the free or premium version here: Opening Print Subscribe.
Juneteenth Market Pause: Decoding the ES Sell-Off and Fed’s Next Moves
Follow @MrTopStep on Twitter and please share if you find our work valuable!
FREE Two-Week Offer for the Opening Print Premium. Open up the Lean and other premium features for the next Two Weeks!
Our View
The ES traded 6045.00 on Globex and opened Tuesday’s regular session at 6065.00. It rallied up to 6081.00 at 11:15 am and that’s when I posted this in the chat:
IMPRO : Dboy : (10:58:33 AM) : acts funny.
The ES made a few lower highs and then slowly sold off down to 6030.00 at 2:40 PM. It did act funny. The ongoing clashes between Israel and Iran, combined with retail sales declining more than expected last month—shrinking 0.9% from April—added to the unease.
When I look back on my career at my S&P desk, handling just about every type of order, big or small, during some of the largest crashes since 1980, I can clearly say that out of all those time frames, I’ve never seen a time that resembles what we are seeing geopolitically. And when you throw in the U.S.’s economic problems, it’s even more alarming.
It’s easy for me to write about this, but it’s hard to make sense of it. As I write this, the nation’s debt is about to hit $37 trillion. Falling Treasury auction participation can signal reduced demand for government bonds, potentially leading to a liquidity problem. If fewer investors bid, the government may struggle to raise funds, driving up yields to attract buyers. Higher yields increase borrowing costs, straining public finances. This can also ripple into broader markets, tightening credit conditions and reducing liquidity as investors hoard cash or seek safer assets.
All of this is unsustainable, but the markets are overlooking it. The patterns remain the same: sell off, drop on Globex, open lower, and rally.
At 3:23, after trading in a narrow range for almost two hours, the ES started to go bid. This is right around the 3:25 time that I look at for a buy or sell program that usually helps determine the late direction. It’s kind of like a tip-off from the cash buyers or sellers on what’s to come at the 3:50 imbalance. The ES traded 6046.50.
Today, we will get a look at what the Fed has to say about the economy and interest rates. Powell and the Fed have been fumbling around since they lowered 0.50 bps on September 18, 2024. On September 26, the ESU made its high at 5,797.25. That was the first mistake, instead of just lowering 0.25 bps while inflation was rising. Then they came back and lowered 0.25 bps on November 7, which was clearly questionable. And then the Fed lowered another 0.25 bps on December 18, 2024—and the markets tanked and have been out of kilter ever since.
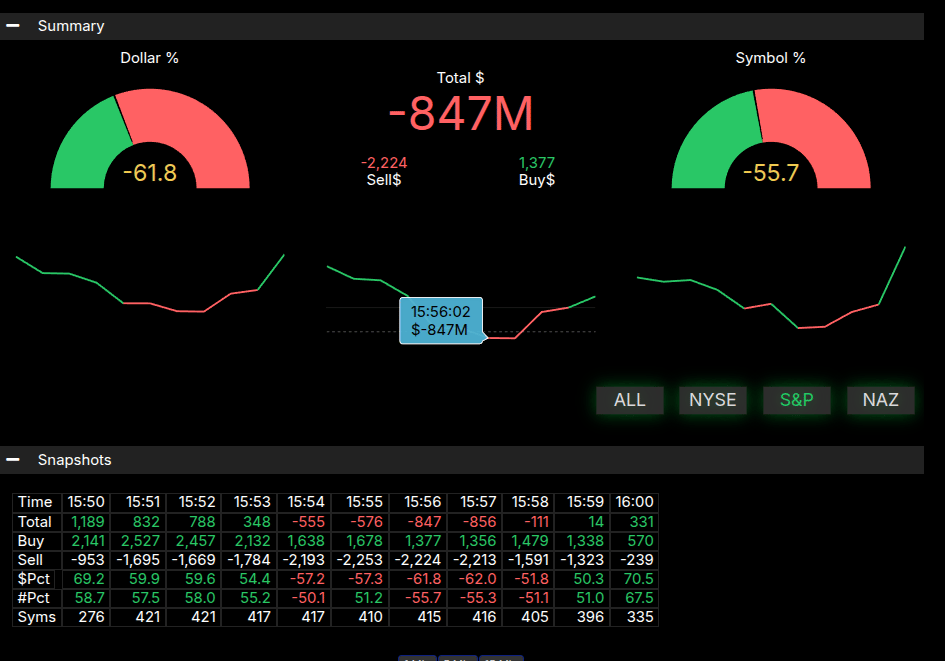
The 3:50 imbalance showed $870 million to buy, and the NASDAQ showed $1 billion to buy with a strong 77% symbol lean to the buyside. Both popped and then dropped, and the NYSE imbalance flipped to $904 million to sell.
In terms of the ES’s overall tone, it had a hard time holding the rallies. In terms of the ESU’s overall trade, volume was 1.16M.
There will be no regular cash session tomorrow. Globex will run from tonight at 6pm until 1:00pm tomorrow. Friday’s Globex session will begin tomorrow at 6pm. So no trading or charts between 1pm and 6pm tomorrow.
Our Lean
The markets were already vulnerable before the Israel/Iran conflict, and that showed yesterday. I don’t think the Fed will have much to say other than that rates will remain unchanged. This morning’s economic reports include May’s housing starts and building permits, which should give a glimpse of the U.S. housing market, along with weekly jobless claims.
The stock market will be closed tomorrow for the Juneteenth holiday.
Our lean: Most times when the ES closes weak, it rallies on Globex. We all know the reasons for the markets going down, and there is a clear case for going lower, but I don’t think that will be the case today.
If the ES gaps higher, I can’t rule out selling the open, but I think today is a “buy the pullbacks” day. However, if the ES can’t hold 6050, we could be looking at testing the 6000.00 to 5980 level.
From Jeff Hirsch – Stock Trader’s Almanac
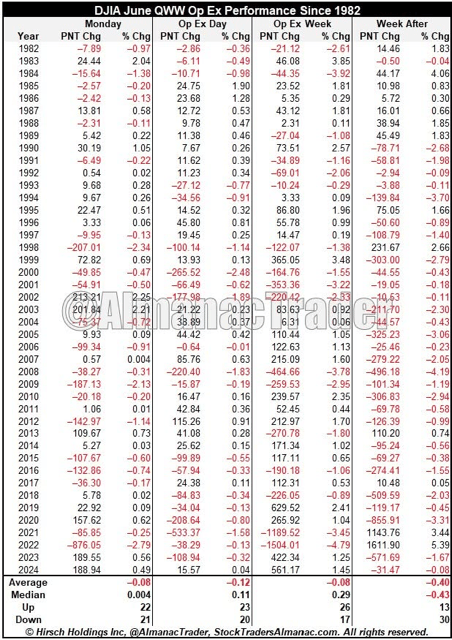
Volatile June Quad Witching Options Expiration.
Since 1982, DJIA, S&P 500 & NASDAQ have recorded average losses on Monday, Friday, and the week. DJIA horrendous week after down 29 of the last 35 Occasions.
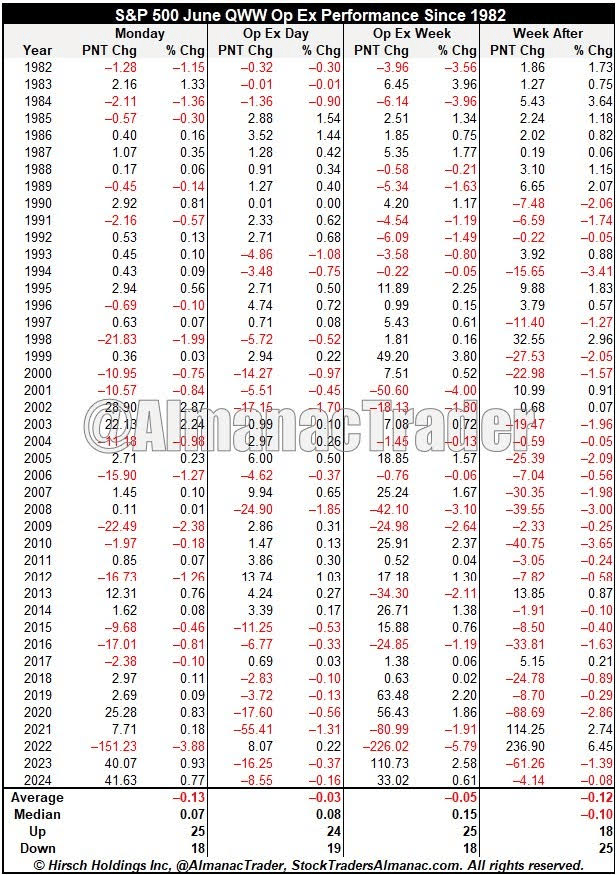
The second Quadruple Witching Week of the year brings on some volatile trading with losses frequently exceeding gains. NASDAQ has the weakest record on the first trading day of the week, down 23 times in 43 years. Quad-Witching Friday is usually better, S&P 500 has been up 12 of the last 22 years, but down 8 of the last 10.
Full-week performance is choppy as well, littered with greater than 1% moves in both directions. The week after June’s Quad-Witching Day is horrendous. This week has experienced DJIA losses in 29 of the last 35 years with an average performance of –0.81%. S&P 500 and NASDAQ have fared better during the week after over the same 35-year span. S&P 500 averaged –0.48%. NASDAQ has averaged -0.01%. Sizable gains in 2021 and 2022 during the week after improved historical average performance notably.
MiM and Daily Recap
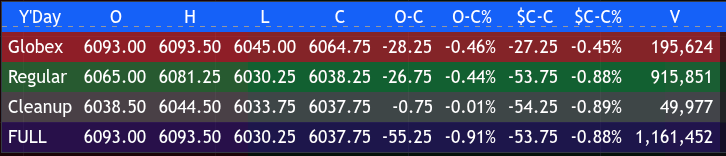
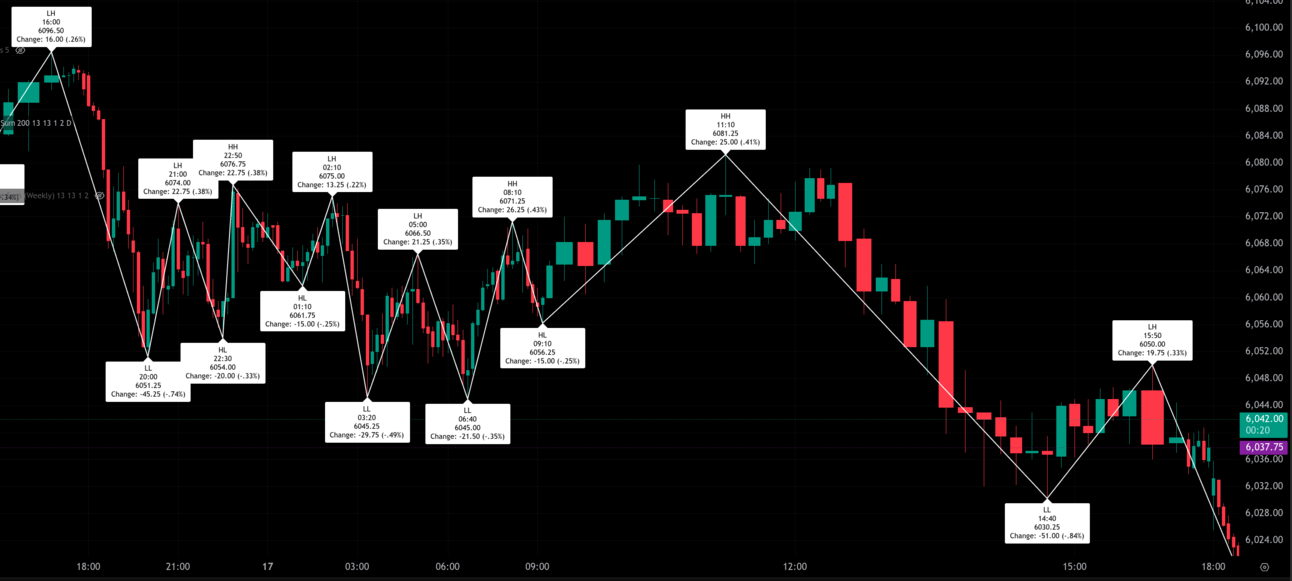
Monday night’s Globex session opened at 6093 and immediately began to fall off. Middle East activity led to a notable decline, bringing the S&P 500 futures to an overnight low of 6045.25 by 6:45 AM ET, representing a 47.25 point drop from the open. A subsequent rebound saw prices climb to 6071.25 around 8:10 AM ET. The overnight Globex session, which concluded at 9:30 AM ET, saw ES close at 6064.75, down 28.25 points from its open, and down 27.25 points or 0.45% from the prior day’s close. The Globex session high was 6093.50 and the low was 6045.00.
As the market transitioned into the regular session at 9:30 AM ET, ES opened at 6065.00. Post open, the market saw a strong upward push, reaching a high of 6079.75 at 10:10 AM ET. This was followed by a pullback to 6066.50 at 10:55 AM ET, a decline of 13.25 points. Another rally ensued, leading to a new intraday high of 6081.25 at 11:10 AM ET, a gain of 14.75 points from the previous low. However, this strength proved temporary. A significant reversal led to a sharp decline, pushing ES to 6065.00 at 11:35 AM ET, a drop of 16.25 points. The decline continued, with ES falling to a new session low of 6030.25 at 2:40 PM ET, a substantial decline of 49.00 points from the 11:10 AM ET high.
A late-day recovery attempt began from this low, pushing ES to a high of 6050.00 by 3:50 PM ET, a gain of 19.75 points. The regular session ultimately closed at 6038.25, reflecting a 26.75 point drop from its open. From the prior cash close to today’s cash close ($C–C), ES registered a decline of 53.75 points, equating to a 0.88% decrease. The cleanup session, from 4:00 PM to 5:00 PM ET, saw ES trade between a high of 6044.50 and a low of 6033.75, closing at 6037.75, which was down 0.75 points from its cleanup open. The full session recorded a high of 6093.50 and a low of 6030.25, closing down 55.25 points from its full session open.
The overall market sentiment for the day was decidedly bearish, with sellers maintaining control through much of the session, particularly after the late morning high. The day was marked by a series of lower highs and lower lows following the initial overnight weakness and a failed midday rally attempt. Total volume for the full session was 1,161,452 contracts, with the regular session contributing 915,851 contracts.
Market on Close (MOC) data showed a net sell imbalance of $847 million in total dollars. The dollar percentage indicated 61.8% on the sell side. While the overall symbol percentage registered at 55.7% leaning sell, a critical shift occurred at the 4:00 PM ET mark. The snapshot for the number of symbols on buy versus sell at 16:00 ET (4:00 PM ET) showed a significant 67.5% favoring the buy side, exceeding the notable imbalance threshold of plus or minus 66%. This strong late-day buying pressure on the close likely helped to stem further declines in the final minutes, pushing the ES slightly off its intraday low into the regular session close. Despite this late buying interest, the day concluded with a notable decline, as ES finished down 0.88% cash-to-cash. The outlook for the next session will likely focus on whether this late buying momentum can sustain or if the prevailing bearish trend continues.
Technical Edge
Fair Values for June 18, 2025:
-
SP: 54.46
-
NQ: 228.7
-
Dow: 332.01
Daily Market Recap 📊
-
For Tuesday, June 17, 2025
• NYSE Breadth: 25.54% Upside Volume
• Nasdaq Breadth: 37.43% Upside Volume
• Total Breadth: 36.05% Upside Volume
• NYSE Advance/Decline: 31.84% Advance
• Nasdaq Advance/Decline: 30.38% Advance
• Total Advance/Decline: 30.94% Advance
• NYSE New Highs/New Lows: 39 / 53
• Nasdaq New Highs/New Lows: 101 / 115
• NYSE TRIN: 1.34
• Nasdaq TRIN: 0.70
Weekly Market 📈
-
For week ending Friday, June 13, 2025
• NYSE Breadth: 48.74% Upside Volume
• Nasdaq Breadth: 66.83% Upside Volume
• Total Breadth: 61.34% Upside Volume
• NYSE Advance/Decline: 40.51% Advance
• Nasdaq Advance/Decline: 36.97% Advance
• Total Advance/Decline: 38.30% Advance
• NYSE New Highs/New Lows: 168 / 70
• Nasdaq New Highs/New Lows: 385 / 195
• NYSE TRIN: 0.70
• Nasdaq TRIN: 0.29
Guest Posts — Polaris Trading Group
Prior Session was Cycle Day 2: Normal CD2 as price consolidated throughout the session with the 6075 +- Line in the Sand (LIS) held as “key resistance.”
Afternoon weakness pushed price to close near the lows of the day. Contract Rollover volumes are now greater in the September (U) front month.
Mixed volumes, low volatility, narrow ranges made for sparse clean trading opportunities, unless your plan is for scalping. Directional traders found the morning session lean, while the afternoon session offered slightly better opportunities.
Range was 63 handles on 1.141M contracts exchanged.
FREE TRIAL link to PTG/Taylor Three Day Cycle
For a more detailed recap of the trading session, click on this link: Trading Room RECAP 6.17.25
…Transition from Cycle Day 2 to Cycle Day 3
Transition into Cycle Day 3: Price is currently above the CD1 Low (6000) as of this writing (7pm) and needs to trade above during RTH. This will satisfy the Positive 3-Day Cycle Statistic, that has an 90.40% historical performance track record.
Market closed near the LOD and selling momentum appears to be spilling over into the GLOBEX session.
The BIG Event today is of course the FOMC (preview above). Israel / Iran remains the “wild-card” for impactful market response should there be escalation of the conflict. We have it on the PTG Bingo Card, but hope it is not called out to be filled out. Stay vigilant!
Of course, nothing changes for PTG…Simply follow your plan. Take only Triple A setups and manage the $risk. ALWAYS HAVE HARD STOP-LOSSES in-place on the exchange.
PTG’s Primary Directive (PD) is to ALWAYS STAY IN ALIGNMENT with the DOMINANT FORCE.
As such, scenarios to consider for today’s trading.
Bull Scenario: Price sustains a bid above 6030+-, initially targets 6045 – 6050 zone.
Bear Scenario: Price sustains an offer below 6030+-, initially targets 6015 – 6005 zone.
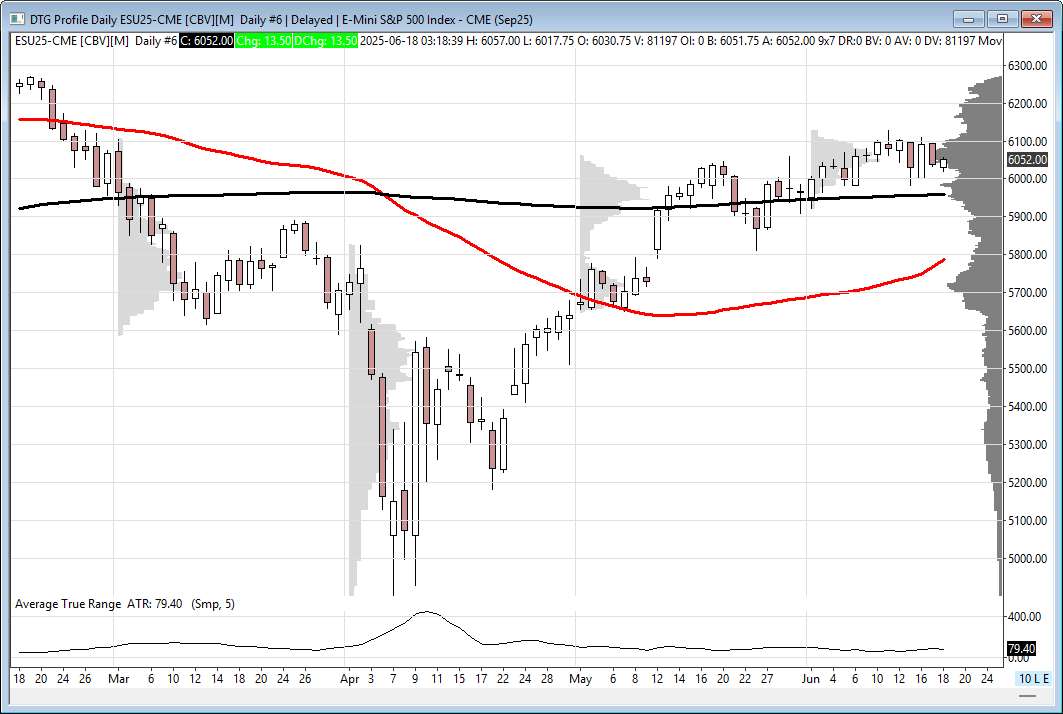
PVA High Edge = 6068 PVA Low Edge = 6034 Prior POC = 6040
ESU
Thanks for reading, PTGDavid
ES
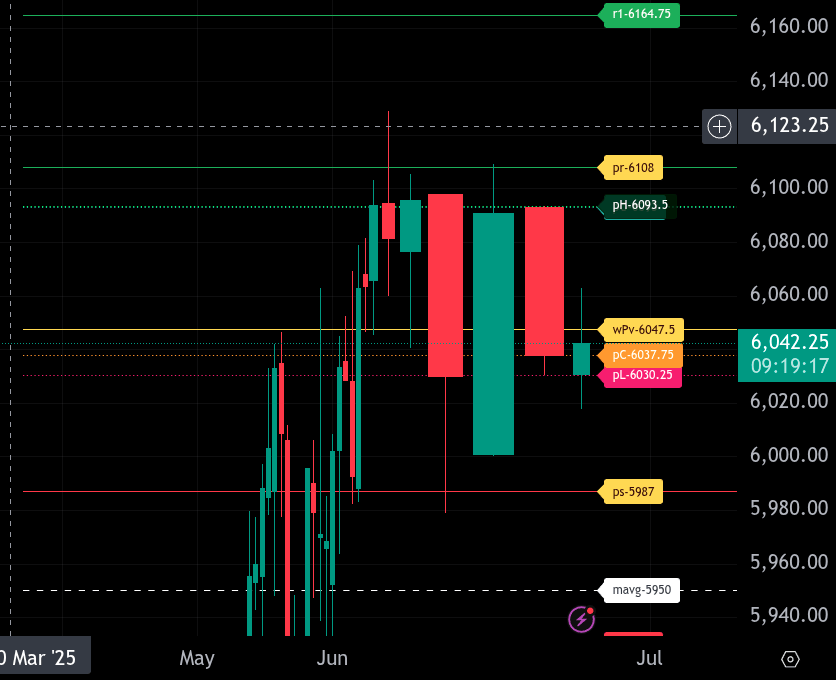
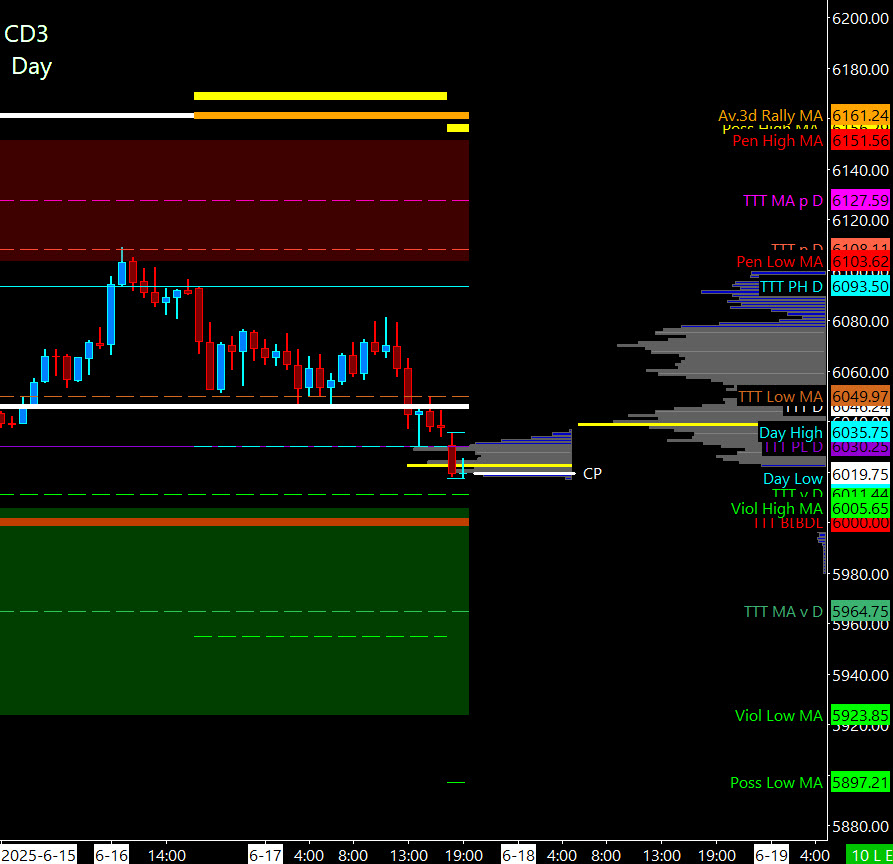
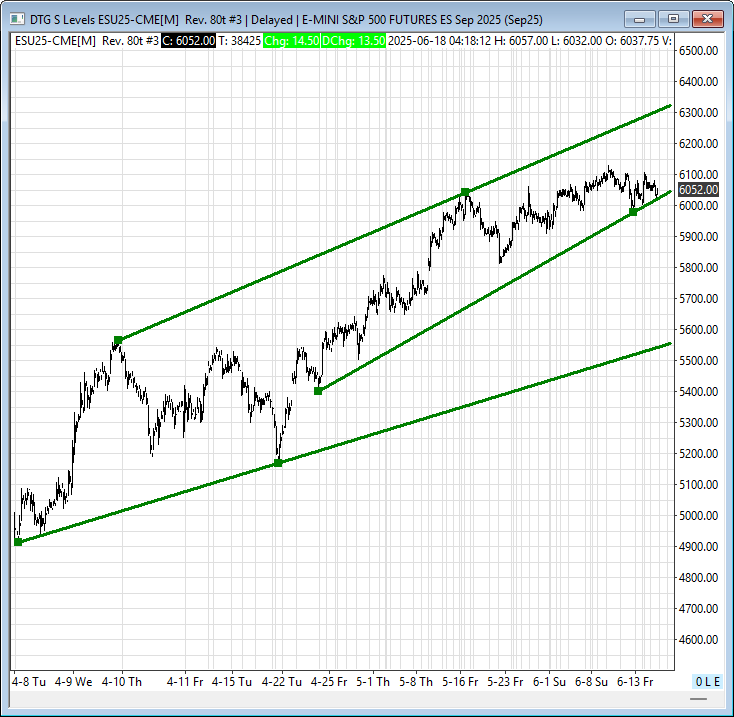
The bull/bear line for the ES is at 6047.50. This is the key level that must be reclaimed for bullish momentum to resume. Above this level, we look for potential buying opportunities on dips.
Currently, ES is trading around 6042.25, indicating weakness below the bull/bear line. If the price remains below this level, expect further downside pressure, targeting 6030.25 and 5987.00, our lower range target for today. A break below these levels could extend the decline towards 5950.00.
On the upside, resistance comes in at 6093.50 and then at 6108.00, our upper range target. If ES can reclaim 6047.50 and hold above, a test of these resistance levels is likely. Bulls need sustained strength above 6108.00 to confirm a potential reversal.
Overall, the trend remains bearish below 6047.50, and caution is warranted until this level is reclaimed.
NQ
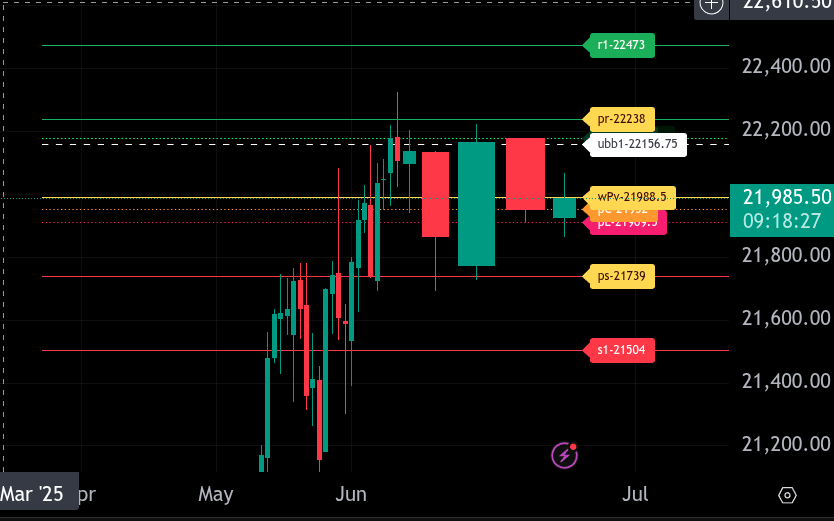
The bull/bear line for the NQ is at 21,988.50. This is the key level that must be reclaimed for bullish momentum to resume. Above this level, we look for potential buying opportunities on dips.
Currently, NQ is trading around 22,008.00, indicating strength above the bull/bear line. If the price remains above this level, expect further upside pressure, targeting 22,156.75 and 22,238.00, our upper range target for today. A break above these levels could extend the advance towards 22,473.00.
On the downside, support comes in at 21,907.50 and then at 21,739.00, our lower range target. If NQ cannot hold above 21,988.50, a test of these support levels is likely. Bears need sustained weakness below 21,739.00 to confirm a potential reversal.
Overall, the trend remains bullish above 21,988.50, and caution is warranted until this level is broken. Watching this line through today’s open will be an important indication for the trend of the day, especially with FOMC and geopolitical news dominating the markets.
Calendars
Economic
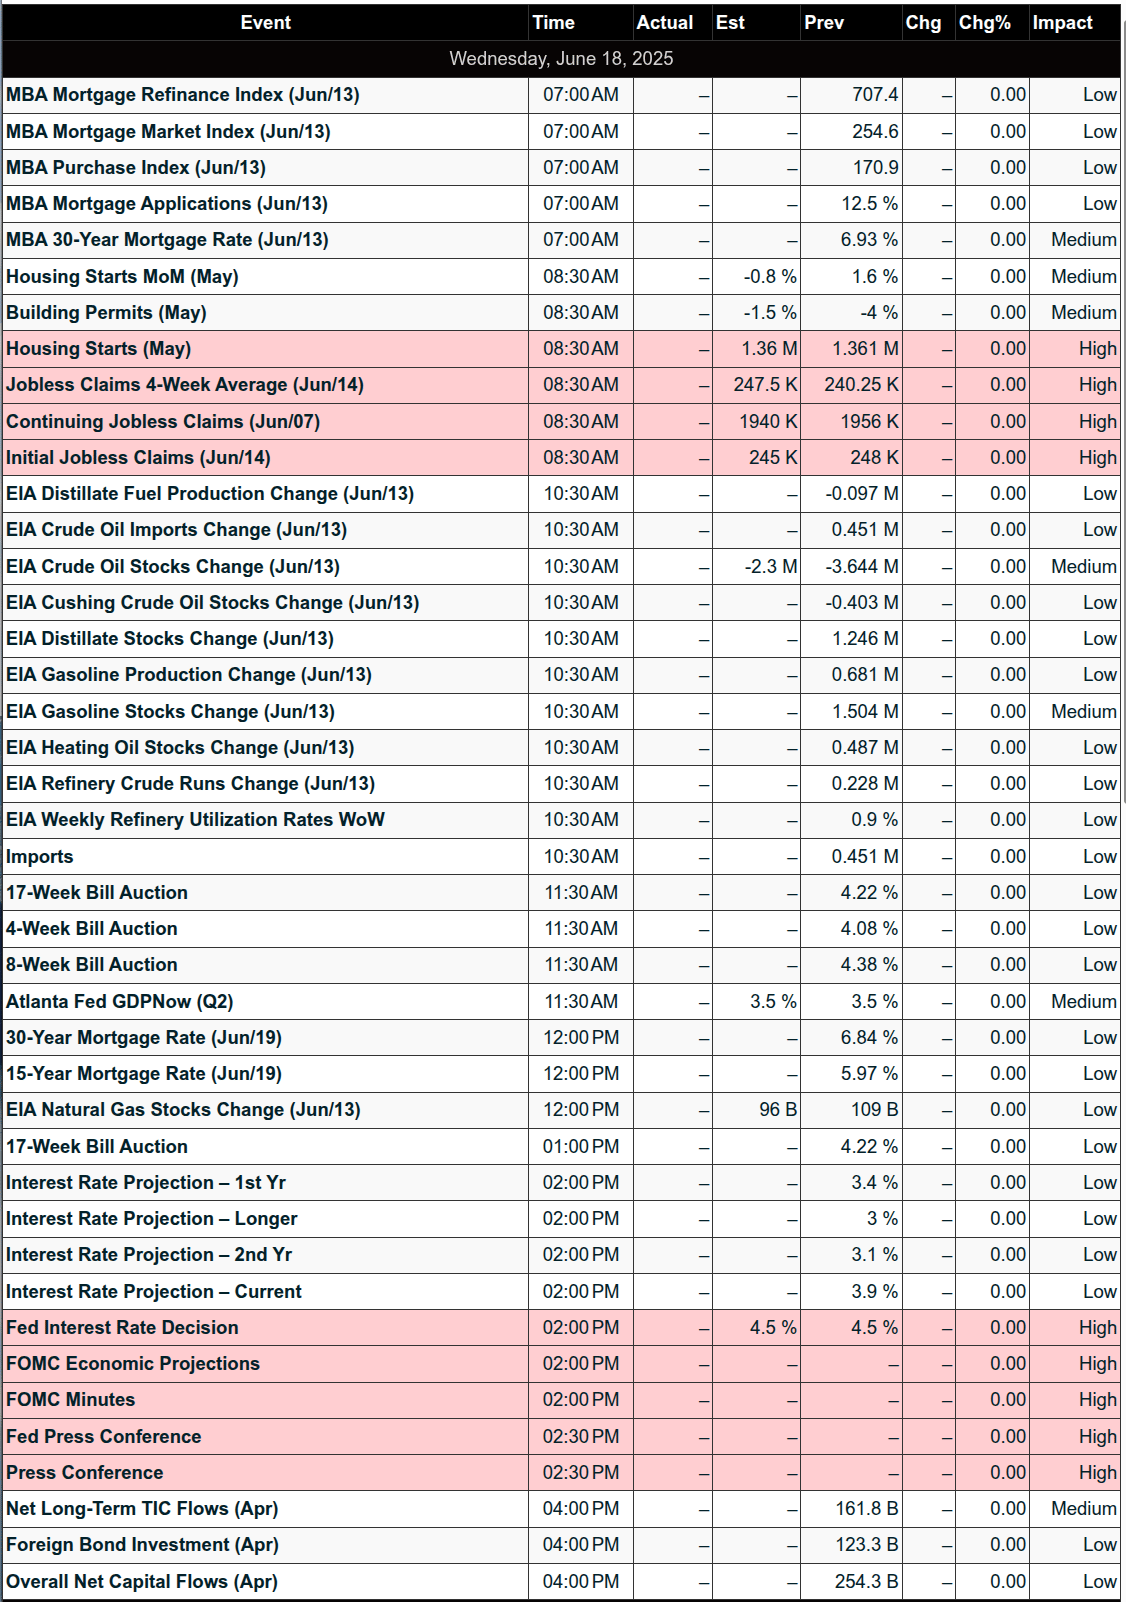
Today
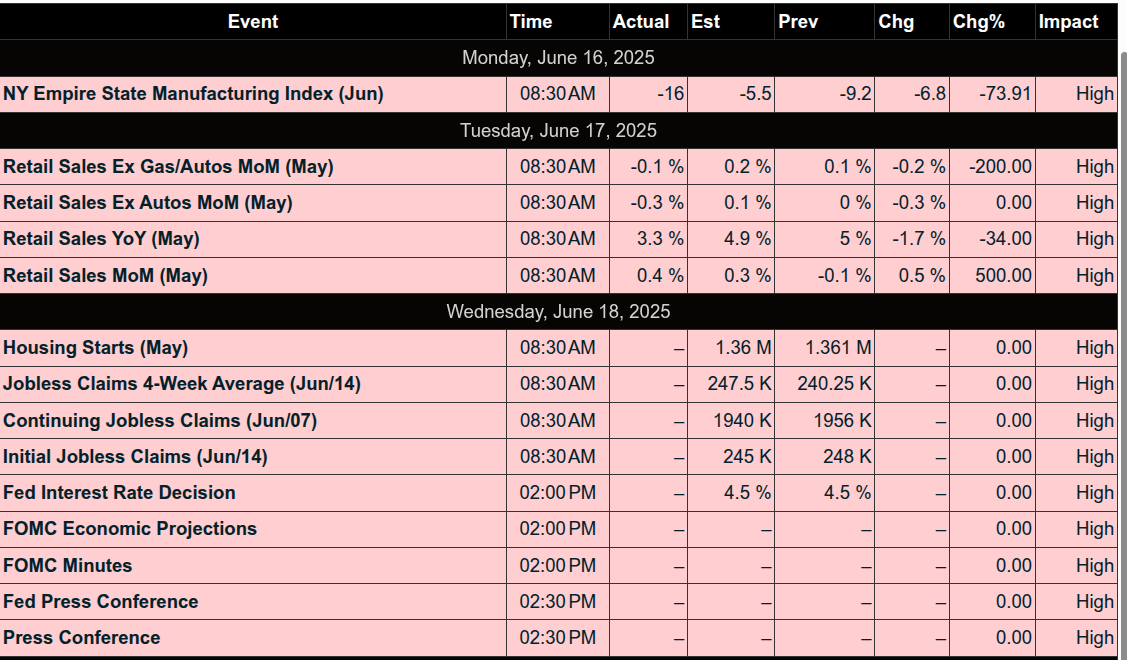
Important Upcoming / Recent
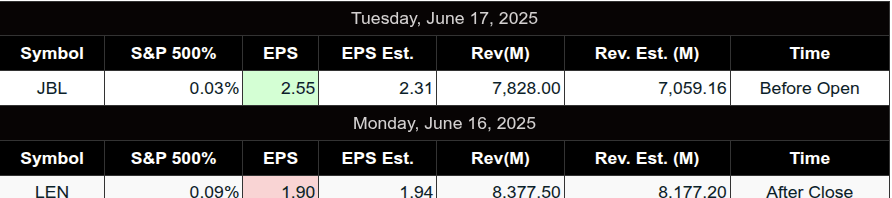
Earnings
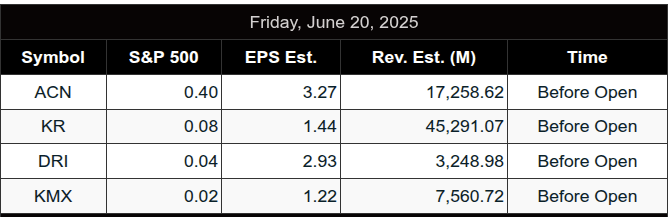
Upcoming
Recent
Trading Room Summaries
Polaris Trading Group Summary – Tuesday, June 17, 2025
Tuesday’s trading session was defined by caution and compression ahead of Wednesday’s FOMC decision. With heightened geopolitical tensions and VIX options expiration, the market opened with a bearish tone, yet quickly settled into a choppy, low-volatility range.
Morning Prep and Structure
David set the tone early, highlighting the S&P 6,000 level as major support, with a potential gamma-driven magnet zone around 6,050–6,060. Futures had pulled back ~60bps, largely driven by Middle East concerns, while market participants braced for VIX expiration flows and tomorrow’s FOMC meeting.
Trading Action
-
NQ Trade Highlight: A solid long probe in MNQ from 22054.75 to 22110.50 was captured in the morning — one of the few meaningful trades. This demonstrated adherence to strategy and nimbleness in a narrow tape.
-
CLQ (Crude Oil August) Long: Another highlight was the successful open range long trade in Crude, with all long targets fulfilled by mid-afternoon. This trade rewarded patient execution and recognition of the rollover dynamics.
Midday Notes
Price hovered around the 6075 LIS for much of the morning but failed to break out meaningfully, rewarding fade and scalping strategies over breakouts. David noted the rhythm wasn’t offering much, keeping him mostly sidelined aside from a few exploratory entries.
Afternoon Breakdown
The market broke lower into the 6035 area by early afternoon, validating the pre-identified 6032–6025 target zone. Buyers struggled to reclaim the 6045–6050 area, and although a $1B MOC buy imbalance gave bulls a slight lift, it was sold into quickly — what David humorously labeled an “IED” rather than a “bunker buster.”
Key Lessons & Takeaways
-
Patience Paid: David emphasized sitting out when the rhythm isn’t there. This is a critical lesson — discipline trumps action in tough tapes.
-
Scalping & Fading Over Breakouts: The day rewarded traders who faded edges rather than chased momentum.
-
Gamma and Volatility Awareness: Understanding the influence of VIX expiration and dealer positioning added critical context to today’s limited range and tight volatility.
Final Thoughts
With FOMC looming and the market clearly in “wait and see” mode, traders were reminded that not every day will offer big opportunities. Still, adherence to structure and setups delivered a few solid plays and valuable market reads.
Discovery Trading Group Room Preview – Wednesday, June 18, 2025
-
Market Closure Reminder: U.S. markets will be closed tomorrow, June 19, for a federal holiday. Normal trading resumes Friday.
-
Geopolitical Tensions: Rising global tension with President Trump’s calls for Iranian “unconditional surrender” and escalating Israel/Iran conflict is impacting sentiment. These events are contributing to market volatility and pushing oil prices higher, echoing pandemic-era supply chain cost increases.
-
Fed Watch: All eyes on the FOMC announcement at 2:00 PM ET, followed by Chair Powell’s press conference. Markets are looking for signals on 2025 rate cuts.
-
Economic Data: Key reports today include Jobless Claims, Building Permits, and Housing Starts at 8:30 AM ET, plus Crude Inventories at 10:30 AM ET.
-
Crypto Highlight: The Senate passed legislation supporting stablecoin innovation. Circle (CRCL), the leading U.S. stablecoin issuer, has surged 400% since debut.
-
Market Dynamics: No notable earnings today. ES 5-day ADR at 85.25 points; volatility remains high. Overnight large trader activity was light, with bullish bias ahead of the 8:30 AM data. ES held its short-term uptrend overnight.
Affiliate Disclosure: This newsletter may contain affiliate links, which means we may earn a commission if you click through and make a purchase. This comes at no additional cost to you and helps us continue providing valuable content. We only recommend products or services we genuinely believe in. Thank you for your support!
Disclaimer: Charts and analysis are for discussion and education purposes only. I am not a financial advisor, do not give financial advice and am not recommending the buying or selling of any security.
Remember: Not all setups will trigger. Not all setups will be profitable. Not all setups should be taken. These are simply the setups that I have put together for years on my own and what I watch as part of my own “game plan” coming into each day. Good luck!
This post goes out as an email to our subscribers every day and is posted for free here around 2 PM ET. To get your real-time copy, sign up for the free or premium version here: Opening Print Subscribe.
Comments are closed