Last Trading Day of the Year
4850 is still in play
Follow @MrTopStep on Twitter and please share if you find our work valuable.
Our View
There has been a small concentration of selling in the NQ in the last few days. The ES holds and back-and-fills, while the NQ goes offered.
I asked the MrTopStep room how many stocks made up most of the gains in the ES and one member said the Magnificent 7 made up 75% of the gains. The only thing I know is stocks are going out on a high and that’s a good thing.
The question is, will they keep going up in 2024? Only time will tell.
The PitBull said yesterday that he has seen the ES go out on its highs and fall on the first trading day of the year. I also remember that happening, but if volume remains low like it should, I still think we go higher.
I thought this was an interesting piece, with Tom Lee.
“Since 1950, there are 11 instances where the S&P 500 fell 20% and then climbed to within 1% of its prior all-time high,” says Lee in a new note. “Eleven of 11 times, the S&P 500 quickly made an all-time high.”
The median time it took to hit the record was seven days, and as long as 20 days. This would mean new highs in January 2024.
And it’s likely the market will make further gains: “The median max gain over the next 18 months is +22%. So yes, this is a launch point for further gains. There is only 1 instance, May 2007, that the max further gain was nominal (<5%),” writes Lee.
However, the usually bullish Lee has a warning. Seven of those eleven times saw the market consolidate with a pullback. These tend to be modest, often 2% to 5%, which in the current context may take the S&P 500 back down to 4,400-4,500.
Our Lean
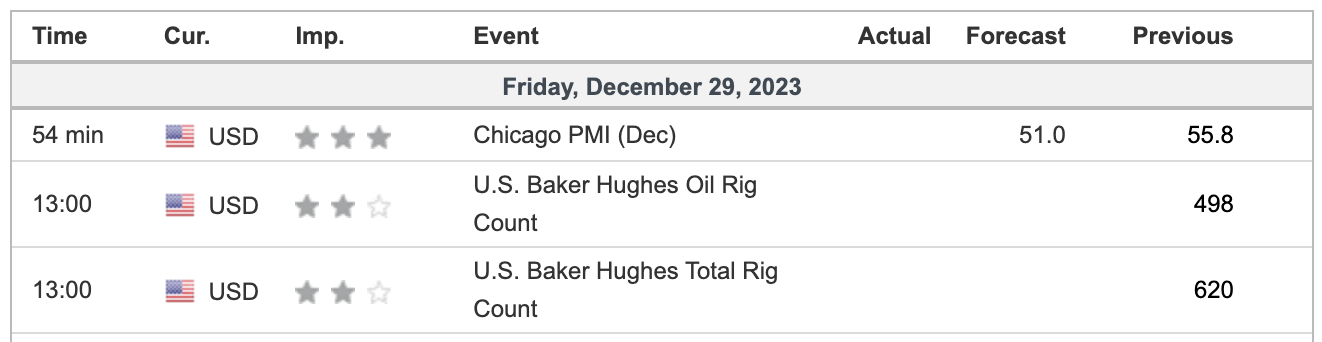
There’s something for everyone today: Chicago PMI, the last trading day of 2023, the FRY-day options expiration, and the end of the year rebalance.
Here is how this is going to go: A little movement in the first 45 minutes to the first hour, chop, chop, chop until late in the day when Mr Gamma meets Mr Rebalance. My guess is most of the buying has been used up, but that doesn’t mean we won’t see my 4850.
Be smart and do like the other 99% is doing…forget trading and go enjoy the day/weekend and New Years. Trading is our livelihood, but there’s also more to life than trading!
For those of you who like HandelStats levels, here they are:
-
Upside: Trade above 4830.25 targets settlement at 4833.50, above there 4835.25, trade and hourly close above there targets 4838.75. Trade and hourly close above there targets 4841.24, trade and hourly close above there targets 1sd at 4859.89 then weekly 1sd at 4861.55. Trade and hourly close above 4861.55 targets 2sd at 4886.28, trade and hourly close above there targets 4912.66.
-
Downside: Trade and hourly close below 4825.50 targets 4818.38, then 4811.25, then -1sd at 4807.11. Hourly close below there targets 4794.62, then 4794 and 4790, hourly close below there targets -2sd at 4780.72. Trade below there targets 4777.62, then 4774.25, hourly close below there targets 4765, then 4763.25, then -3sd at 4754.34.
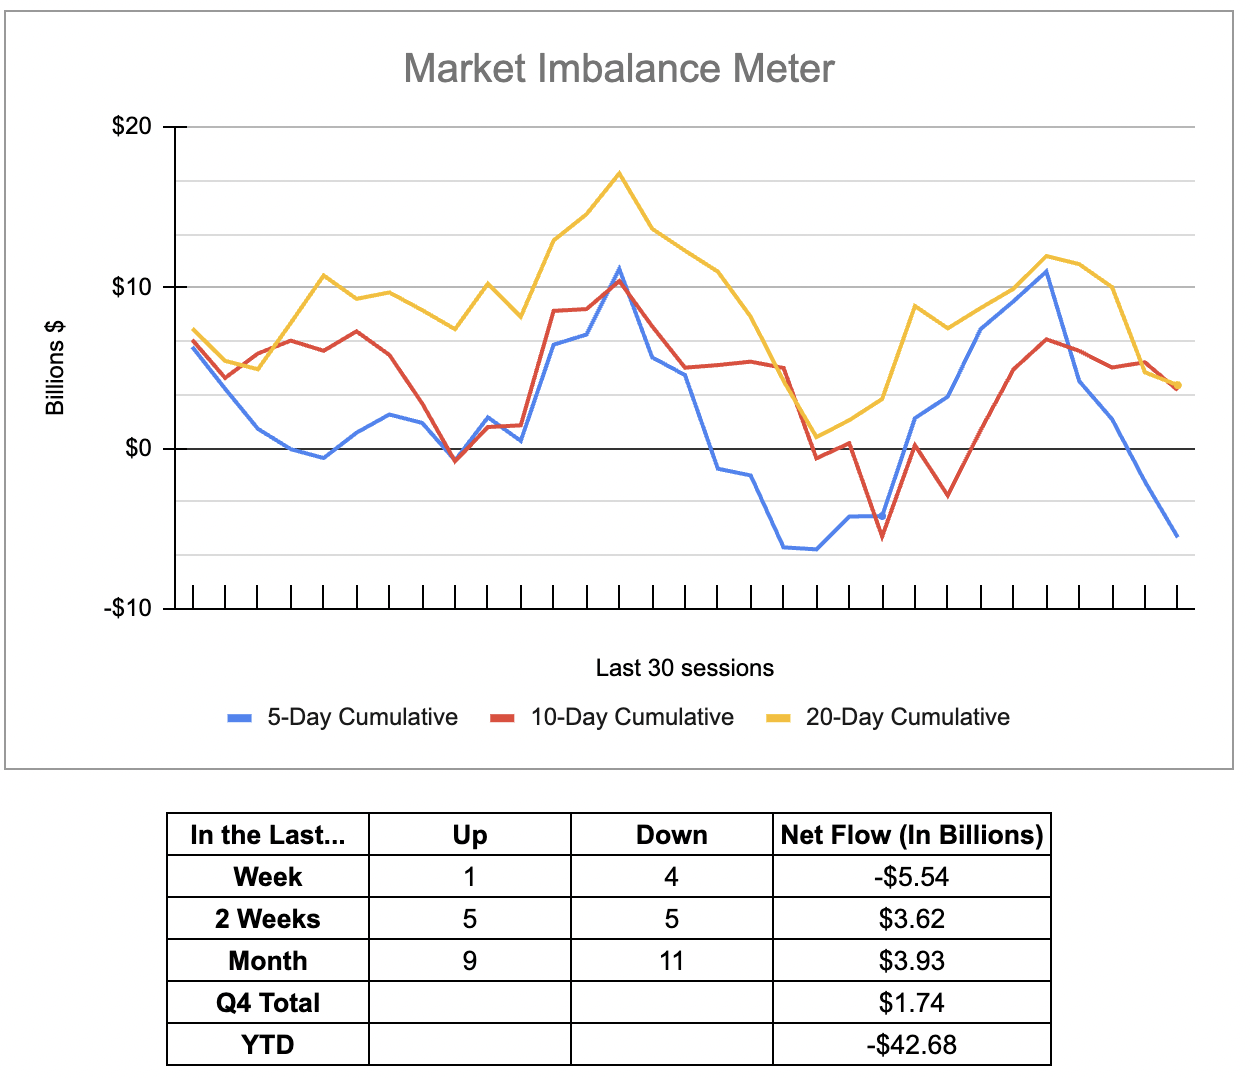
MiM and Daily Recap
ES Recap
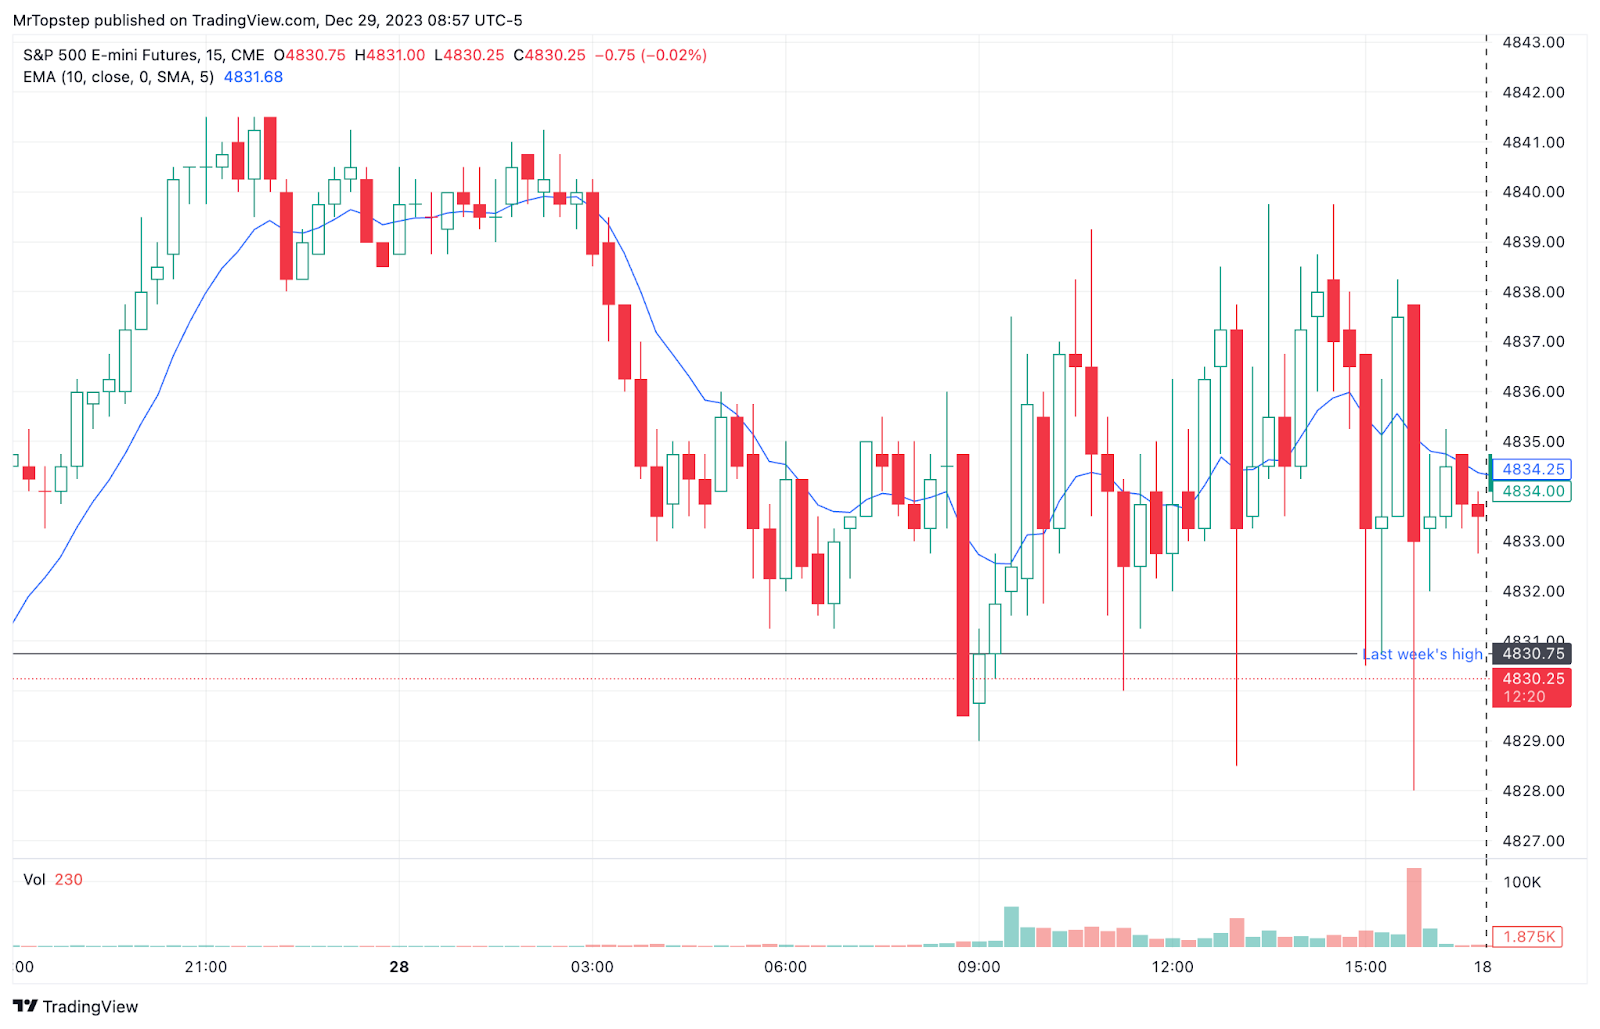
The ES traded up to 4841.50 on Globex and opened Thursday’s regular session at 4832.00. I could do all the little 4 to 6-point rips and dips, but why? The early high came in at 4839.25 at 10:54 and the ES traded down to 4828.50 at 1:07 and then traded up to a 4839.75 double top at 2:43.
From there, the ES sold off down to a higher low at 4830.50, traded 4836.25 at 3:25 as the early NYSE imbalance showed $189 million to buy. Up to that point, the other 90% of the day was stuck in a 4 to 7-point trading range all day. The ES traded 4834.75 as the final NYSE imbalance showed $2 billion to sell, dropped down to 4828.00 at 3:56 and traded down to a new low of 4832.75 on the 4:00 cash close. After 4:00 the ES chopped and settled at 4833.50 on the 5:00 futures close, down 1.25 points or 0.03% on the day.
In the end, yesterday will go down as a ‘no day’ — no trade, no volume. In terms of the ES’s overall tone, it was firm while the NQ was pretty much offered all day. In terms of the ES’s overall trade, volume was low: 134k traded on Globex and 718k traded on the day session for a total 852k contacts traded.
Technical Edge
-
NYSE Breadth: 55% Upside Volume
-
Nasdaq Breadth: 40% Upside Volume
-
Advance/Decline: 48% Advance
-
VIX: ~12.50
ES
Levels from HandelStats.com

ES Daily
-
Upside: Trade above 4830.25 targets settlement at 4833.50, above there 4835.25, trade and hourly close above there targets 4838.75. Trade and hourly close above there targets 4841.24, trade and hourly close above there targets 1sd at 4859.89 then weekly 1sd at 4861.55. Trade and hourly close above 4861.55 targets 2sd at 4886.28, trade and hourly close above there targets 4912.66.
-
Downside: Trade and hourly close below 4825.50 targets 4818.38, then 4811.25, then -1sd at 4807.11. Hourly close below there targets 4794.62, then 4794 and 4790, hourly close below there targets -2sd at 4780.72. Trade below there targets 4777.62, then 4774.25, hourly close below there targets 4765, then 4763.25, then -3sd at 4754.34.
NQ

NQ Daily
-
Upside: Trade above 17084.75 targets settlement at 17092.75 and 17093. Hourly close above there targets 17117.12, hourly close above there targets 1 sd at 17237.51. Hourly close above there targets 17269.75, then 1sd weekly at 17302.80, then 17304.75**, hourly close above there targets 2sd at 17382.27. Hourly close above there targets 17525.35*****.
-
Downside: Trade and hourly close below 17084.75 targets 17052.12, then 17015.25. Hourly close below there targets -1sd at 16947.99, then 16937.75, hourly close below there targets 16913, then 16901.75, then 16883 and 16875.50. Hourly close below there targets 16838.25, hour close below there targets -2 sd at 16803.23.
Economic Calendar
Comments are closed