This post goes out as an email to our subscribers every day and is posted for free here around 2 PM ET. To get your real-time copy, sign up for the free or premium version here: Opening Print Subscribe.
Follow @MrTopStep on Twitter and please share if you find our work valuable!
Our View
This week has a busy economic calendar, but also an overload of Fed speak. I think things have gone from bad to worse, and while I don’t need to look for things to tell me that, I thought the following stood out from Goldman Sachs, as most of the banks have tried not to scare their customers.
Goldman Sachs has issued several warnings regarding market corrections and shifting investment landscapes, most recently noting in an email on March 20 that it is eyeing the risk of a deeper market correction that may leave investors with “few places to hide.” This follows a “grim warning” from October 26, 2024, that “shocked Wall Street” regarding potential market instability, and a strategist alert that same month warning that annual S&P 500 returns could narrow to just 3% over the next decade due to high valuations and market concentration.
These shifting themes were foreshadowed in late 2023 when flow-of-funds expert Scott Rubner “pulled the plug” on the year-end rally, stating the dynamics of the “everything rally” had run out of steam, leading to a February 2025 observation that the era of U.S. stock out performance may be fading as returns broaden across geographies and sectors, making diversification and stock picking more critical.
I do think you have to keep this in perspective. As the market closed on Friday, the S&P 500 had rallied approximately 876% from its 2009 credit crisis low of 666, and approximately 197% from its COVID-19 pandemic low. The ES was up 28.71% in 2021, down 18.11% in 2022, up 29.29% in 2023, up 25.02% in 2024, and up 17.88% in 2025.
At the end of the day, I have an old saying: there is reason to be concerned, but in the grand scheme of things, the U.S. markets have gone up enormously. At some point, there will be negotiations that will end the war, but the big question is… when?
Our Lean
Despite a late-session “buy-the-dip” pop following the 4:00 PM cash close, the markets remain on edge as the ES 6500 level serves as a critical pivot point; a confirmed breakdown here could quickly target the 6300–6350 range.
This technical vulnerability is being exacerbated by a massive geopolitical escalation, with President Trump reportedly issuing a 48-hour ultimatum for Iran to reopen the Strait of Hormuz under threat of the “obliteration” of its power and water infrastructure. Iran has countered by vowing to dismantle U.S. and Israeli energy and IT assets across the Middle East, maintaining that the Strait will remain closed until their infrastructure is rebuilt.
Amidst this standoff, Tehran is attempting to fracture the opposition by granting “privileged status” and safe passage to partners like India while simultaneously demanding that all future oil transit be settled in Chinese yuan—a move designed to bypass U.S. sanctions and directly challenge the dominance of the petrodollar.
As if all of this wasn’t enough, Iran also shot two ballistic targets at the joint US-UK base on Diego Garcia not long after the UK government recently dismissed Israeli claims that Iran possesses the capability or intent to strike London directly.
Our lean: It has been hard to find the silver lining over the last three weeks, but it’s getting even harder going into the fourth week of the war, as there has been absolutely no let-up. Like I said over 10 days ago, Mohammed al-Bukhaiti, a senior Houthi official, said this past week, “Our finger is on the trigger. Yemen’s joining the conflict is only a matter of time.”
It’s 8:07 on Sunday, and the ES just traded down to 6533.00. That’s down 159.50 points from Friday’s late 6592.50 high after 4:00. I am going to stick with the same theme: I don’t doubt the ES and NQ can rally, but like all pops over the last 3+ weeks, they will get sold. Remember, 6500 is a critical juncture.
Claude AI ES Futures — S/R Confluence Map
MARKET CONTEXT
Price is in a statistically extended selloff. RSI at 25.43 and Stochastics K/D at 8.20/11.82 are both deeply oversold — readings not commonly sustained for long. Price is trading below the 20-day VWAP (6,698.75), below the SMA 50 (6,929.06), and outside the 20-day Value Area entirely, which signals the market is trading away from fair value to the downside.
A mean-reversion setup back toward 6,698–6,753 is technically plausible, but momentum remains bearish until price reclaims the Daily Pivot at 6,589.
RESISTANCE (above current price)
R 6,753.50 VAL · 61.8% Fib zone
R 6,742.73 61.8% Fib (golden ratio)
R 6,698.75 VWAP 20d · Weekly Pivot
R 6,655.09 Daily R1 · 78.6% Fib zone
R 6,646.43 78.6% Fib
R 6,589.42 Daily Pivot
CURRENT CLOSE: 6559.00
SUPPORT (below current price)
S 6,584.59 -2 Std Dev lower bound
S 6,581.50 Weekly S1
S 6,523.75 100% Fib · 20d + 5d low
S 6,493.34 Daily S1
S 6,462.57 -3 Std Dev lower bound
S 6,427.67 Daily S2 · Weekly S2
S 6,331.59 Daily S3
S 6,294.50 All-data low
RSI (14): 25.43 (Oversold)
Stoch %K / %D: 8.20 / 11.82 (Oversold)
VWAP 20d: 6,698.75
SMA 50: 6,929.06
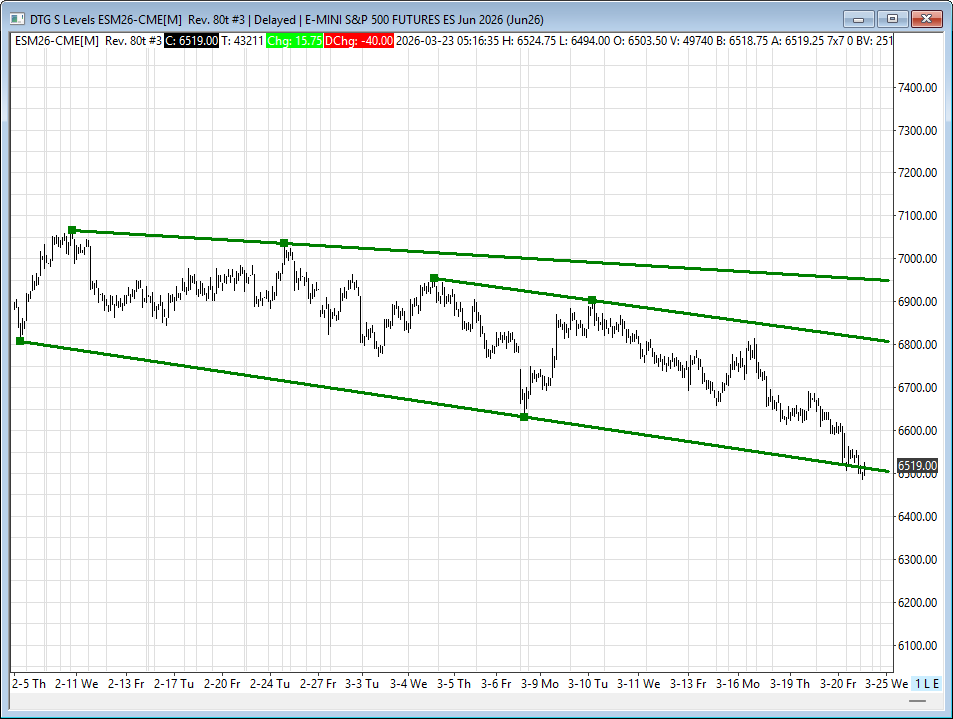
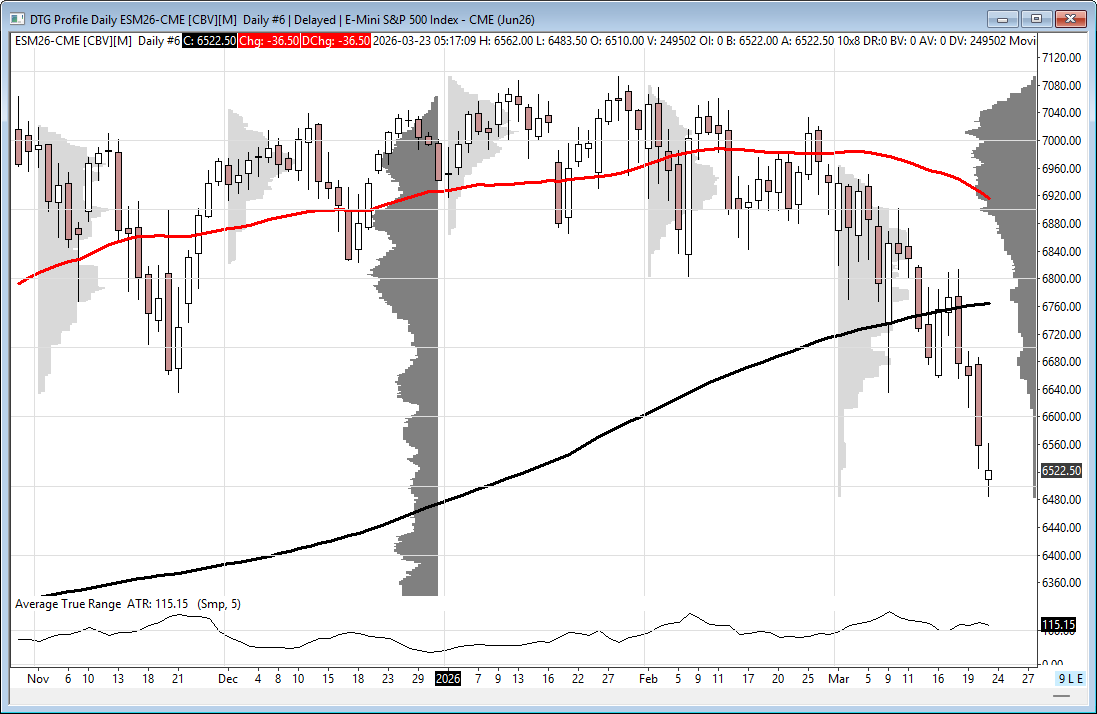
Market Recap
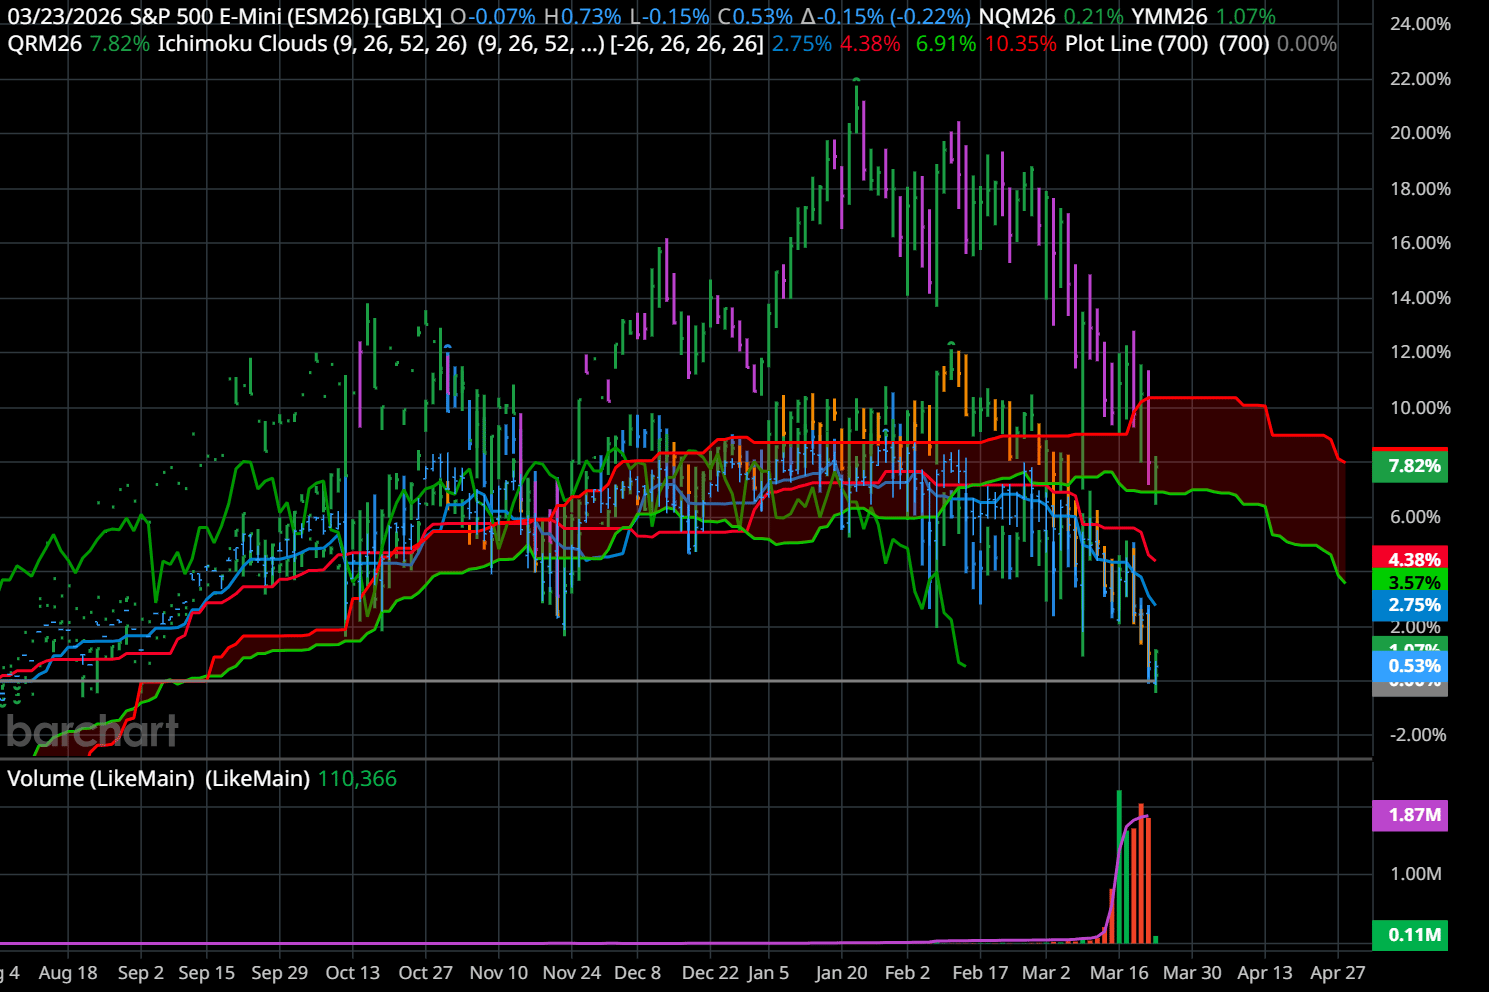
9-Month Chart of ES, NQ, YM, and RTY
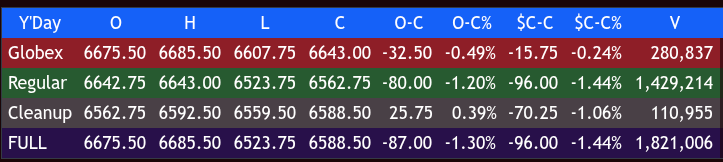
Its Friday morning, and the ES traded up to 6685.50 and then sold down to 6607.75 as Brent crude oil jumped 2% and a headline hit: Super Micro Computer ($SMCI) shares are tanking -25% premarket after allegations involving employees/co-founder in smuggling Nvidia chips to China, The ES opened the regular session at 6642.75, down 16 points or -0.24%.
After the open, the ES sold off down to 6622.50 at 9:35, rallied back up to a new high by 1 tick at 6643.00, sold off 52.75 points down to 6590.25 at 10:10, made a few small higher lows, and rallied up to 6611.00 at 10:35. It then sold off to a new low at 6587.50 at 10:50, rallied back up to 6617.75 at 11:20, and sold off down to a higher low at 6590.24 at 11:25.
The ES rallied up to 6616.25 at 12:20, sold off down to a higher low at 6595.25 at 12:50, rallied up to 6609.75 at 12:55, and sold off down to 6581.25 at 1:45. It then rallied up to 6593.00 at 2:00, and that’s when a big sell program hit that pushed the futures down to 6523.75 at 3:35.
Buy programs then started showing up, pushing the ES up to 6547.00 at 3:40. The ES traded 6537.50 as the 3:50 imbalance showed $5.5 billion to sell and went out to $10.9 billion to sell, rallied up to 6556.50, and traded 6562.75 on the 4:00 cash close.
After 4:00, the ES traded up to 6577.75 at 4:15, pulled back to 6658.00, then rallied up to 6592.50 at 4:50 and settled at 6,559.00, down 101.00 points (-1.52%); the NQ (Nasdaq 100 E-Mini Jun ’26) closed at 24,101.50, down 478.50 points (-1.95%); the YM (Dow Futures Mini Jun ’26) closed at 45,893, down 448 points (-0.97%); and the RTY (Russell 2000 E-Mini Jun ’26) closed at 2,455.00, down 57.10 points (-2.27%).
Everything Is Moving And Not Necessarily In A Good Direction
In the end, it was another day of violent price action with extreme moves in both directions. In terms of the index market’s overall tone, they were under attack all day. In terms of the ES’s overall trade, volume was steady but not large for the type of trade, with 1.834 million contracts traded.
Rates: Inflation fears on Friday pushed global bond yields higher and weighed on stocks. The 10-year T-note yield rose to a 7.5-month high Friday of 4.39%, the 10-year UK Gilt yield jumped to a 17.5-year high of 5.02%, and the 10-year German Bund yield climbed to a 14.75-year high of 3.05%.
Metals: Gold futures suffered their worst weekly decline in 43 years, or since March 1983, plummeting over 10% during an eight-day losing streak to settle at $4496.16/oz on Friday. This historic slump was driven by an escalating conflict in the Middle East that has dented bets for near-term interest rate cuts. As investors prioritized cash and a surging U.S. dollar over traditional safe havens, major central banks warned that rising energy costs would likely keep inflation high. Consequently, the spike in Treasury yields and the “flight to cash” effectively crushed the investment case for bullion as the week drew to a close.
Energy: Since the U.S.-Israeli conflict with Iran began on February 28, energy prices have experienced a massive structural shift, with WTI crude oil surging approximately 46% from a pre-war baseline of $67.02 to Friday’s settlement of $98.23. During this same three-week period, RBOB gasoline futures have jumped roughly 10% from their pre-war average—with some regional pump prices spiking up to 30%—culminating in a Friday session where energy markets reached a breaking point. April WTI crude rallied another +2.27% to close at $98.23, while April RBOB gasoline skyrocketed +5.09% to $3.28, marking a 3.5-year high for nearest futures as the Pentagon reportedly prepares for potential ground troop deployment and a takeover of Kharg Island.
I am writing this on Saturday morning for a few reasons. The first is I want to keep things fresh in my mind, and secondly, I don’t want to be doing this on Sunday night.
The stock market has suffered its 4th weekly decline, and the losses accelerated last week as the three-week Middle East war shows no sign of letting up. On Friday, the Nasdaq fell 2% and is now 9.6% below its record high. The S&P, which closed down 1.52% on Friday, is now down 7.58% from its all-time high of 6978.34 set on January 27. The Dow futures have closed lower 7 of the last 9 sessions, down 0.97% on Friday and down 9.90% YTD. Last but not least, the RTY closed down 2.27% and is down 11.32% YTD.
That’s all I have to say about that!
Economic Calendar
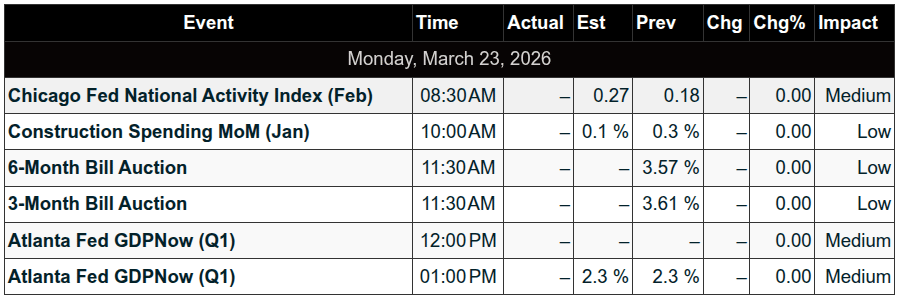
Monday, March 23
Construction Spending: 0.1% / 0.3%
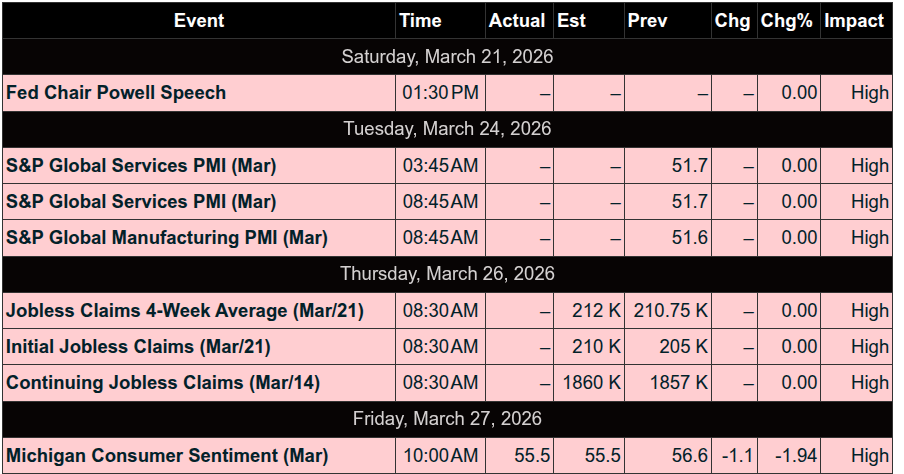
Tuesday, March 24
U.S. Productivity: 1.8% / 2.8%
S&P Flash PMI: Services (51.7) | Manufacturing (51.6)
Fed Speak: Michael Barr
Wednesday, March 25
Import Price Index: 0.7% / 0.2% (Ex-fuel: 0.5%)
Fed Speak: Stephen Miran
Thursday, March 26
Jobless Claims: 210k / 205k
Fed Speak: Philip Jefferson, Lisa Cook, Stephen Miran, Michael Barr

Guest Posts
The market remains in a bearish posture, but we are beginning to approach levels where things could become more dynamic. This week will come down to whether price can hold key support, or if we are setting up for another leg lower.
The Weekly Framework
From an open interest perspective, the structure is clear.
6472.50 is the key support level for the week.
If that level fails, the next downside targets are 6447.50, followed by 6277.50. These are not arbitrary levels. They reflect areas where positioning suggests price could be drawn if support breaks.
On the upside, the framework remains unchanged.
The market is only bullish above 6677.50. Until that level is reclaimed with acceptance, rallies should be treated with caution.
Intraday Structure
For today, dealer positioning aligns closely with the weekly framework.
DEX is pointing to support at 6477.50 and 6462.50, which closely aligns with the 6472.50 weekly level. This makes the 6477.50 area a critical line in the sand.
On the upside, dealers need to reclaim 6507.50 to establish any meaningful intraday recovery.
If price opens below that level, 6522.50 is likely to act as resistance. Above that, 6537.50 becomes the squeeze trigger.
Below 6507.50, focus shifts back to 6477.50 as the key recovery level. A break there opens the door for further downside.
Gamma and Flow
The gamma setup adds another layer to the structure.
There is negative GEX around 6447.50, making it a natural downside magnet if price begins to move lower.
At the same time, intraday gamma flips positive above 6547.50. This introduces put sellers back into the market, which can support upward movement.
This is important in a market already heavily skewed toward puts. It does not take much to trigger a move in the opposite direction. Sometimes all it takes is a single catalyst.
The Setup
Positioning remains bearish, with significant downside exposure in the system. That creates two clear paths:
If 6477.50 breaks, price likely gravitates toward 6447.50, with potential continuation lower.
If 6477.50 holds, the market may begin building a base.
In a crowded downside trade, that is where conditions can shift quickly. Crowded positioning does not require much pressure to unwind.
The Game Plan
Support: 6477.50
Magnet below: 6447.50
Weekly risk: 6277.50
Resistance: 6522.50
Squeeze trigger: 6537.50
Structural shift: 6677.50
If price breaks above 6547.50, there is room for a move toward 6597.50.
If 6477.50 fails, the path of least resistance likely leads to 6447.50.
The Bottom Line
The market remains bearish, but positioning is becoming crowded.
When positioning reaches these extremes, the market typically does one of two things:
It accelerates lower, or it reverses when the fewest participants are positioned for it.
For now, everything revolves around 6477.50.
Hold it, and a base may begin to form.
Lose it, and the market likely has further downside work to do.
If this broader framework is the map, the daily setups are the execution plan. I share those each morning on X at @manny_trends, where I outline the levels and structure I am watching for the day ahead. Members of IMPRO are often the first to benefit from that work.
For those new to my work, I have traded S&P futures since 2012. I spent nearly a decade at Bloomberg in analytics, have appeared on TopStep Power Players, and generated over $175,000 in prop firm payouts last year. Everything shared here is grounded in real trading, not theory.
Manny Payano
@manny_trends
Webinar Replay:
Niels Koops: DeltaTrader.com

MiM
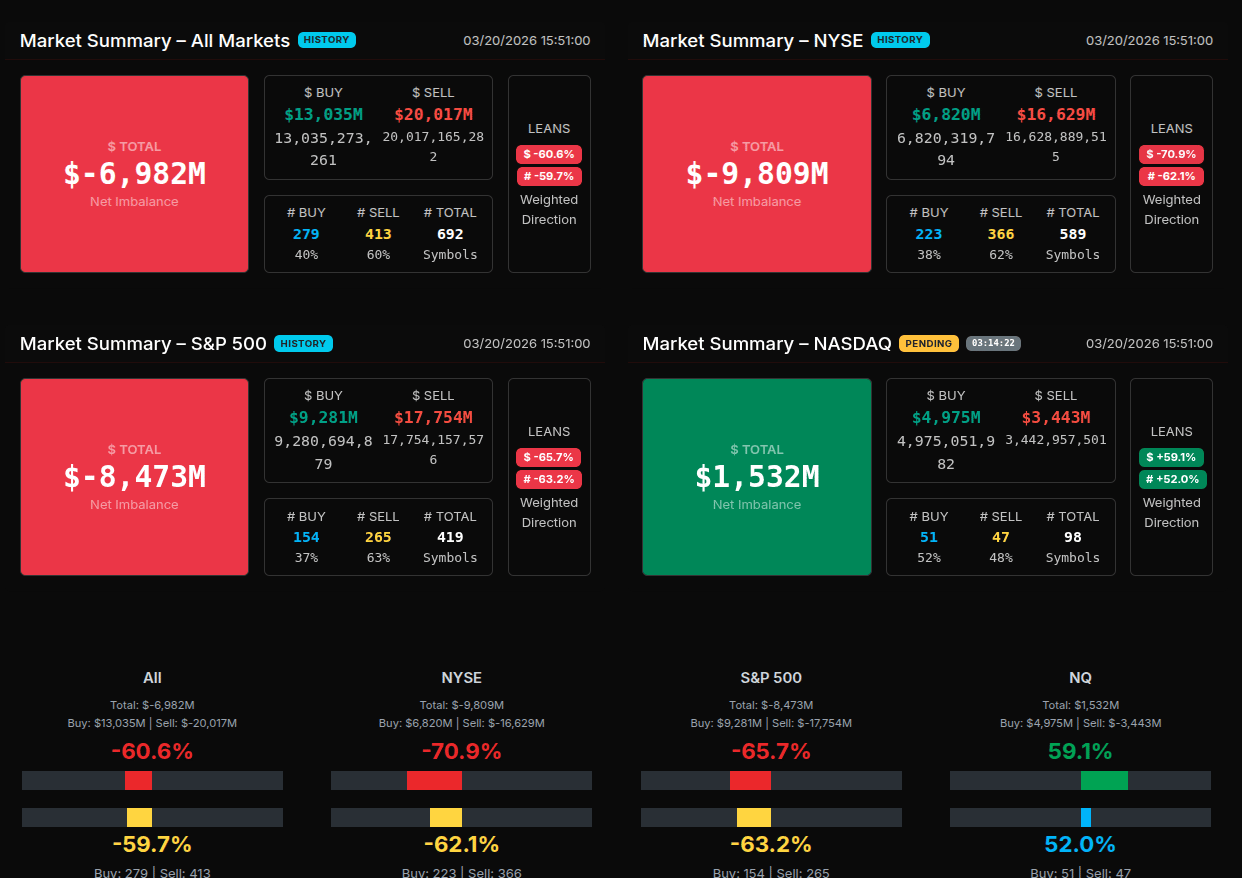
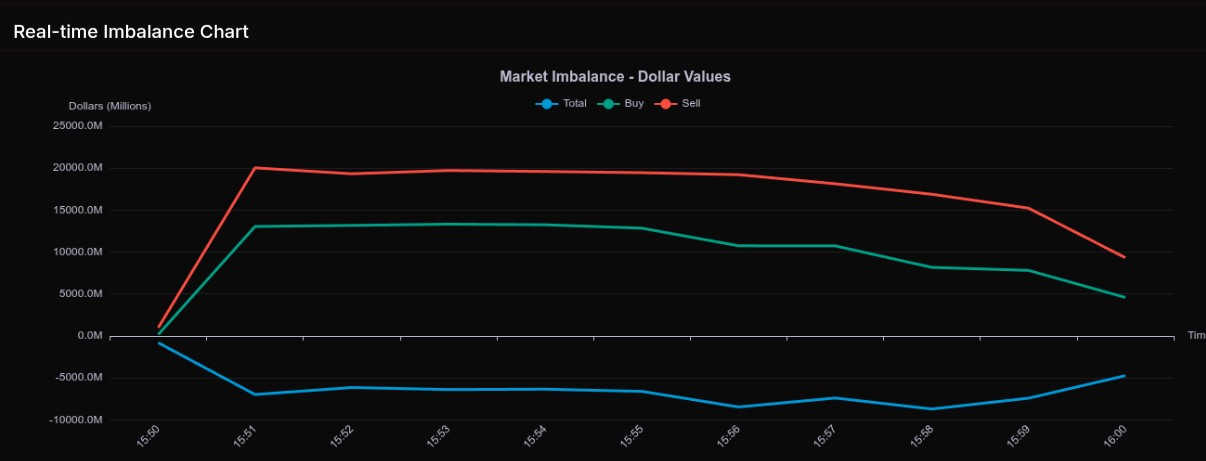
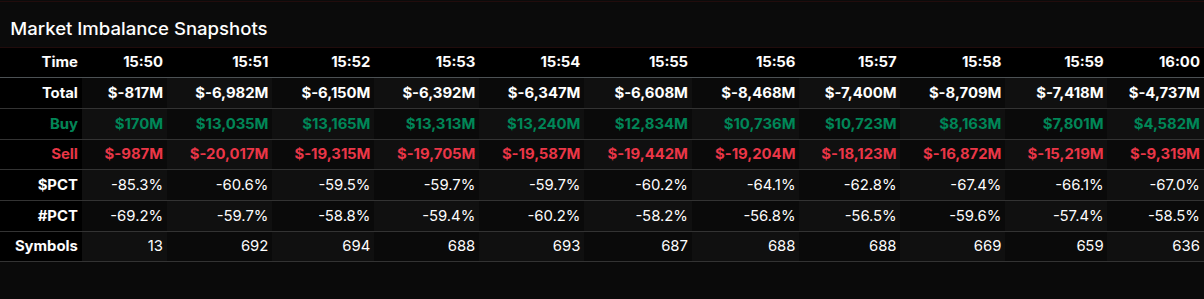
The MOC session opened with immediate and persistent sell-side pressure, establishing a clear negative tone that remained dominant through the bulk of the imbalance window. At 15:50, the market showed a modest -$817M imbalance, but this quickly expanded into a heavy sell program, peaking near -$6.9B by 15:51 and holding consistently between roughly -$6B to -$8.7B through 15:58. The lean throughout the session stayed firmly negative, generally between -59% and -67%, signaling sustained institutional distribution rather than rotational two-way flow. Into the close, the imbalance eased slightly to -$4.7B, suggesting some late buy-side offset but not enough to shift the overall tone.
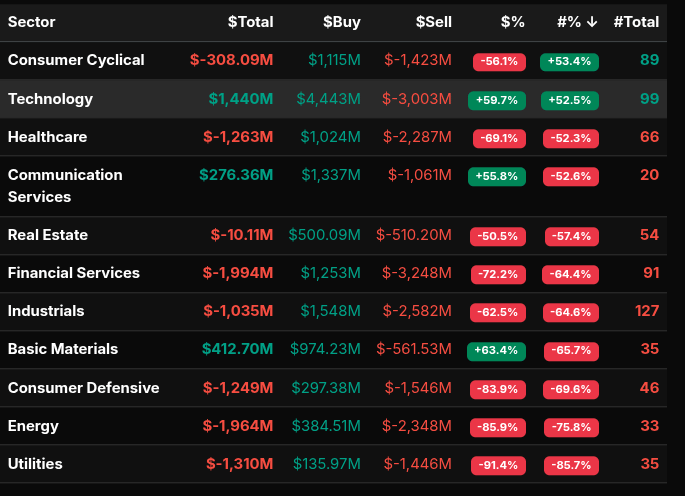
Sector flows reinforced this broad sell program. Defensive and rate-sensitive areas were aggressively offered, with Utilities (-91.4%), Energy (-85.9%), and Consumer Defensive (-83.9%) all showing extreme negative leans well beyond the -66% threshold—clear signs of wholesale liquidation rather than rotation. Financials (-72.2%) and Healthcare (-69.1%) also registered strong sell-side control, indicating macro-driven de-risking across key institutional sectors.
On the buy side, participation was more selective. Technology (+59.7%) and Communication Services (+55.8%) showed positive imbalances, but these readings fall into rotational territory rather than aggressive accumulation. Basic Materials (+63.4%) approached the upper threshold but still reflects more balanced repositioning rather than outright demand dominance.
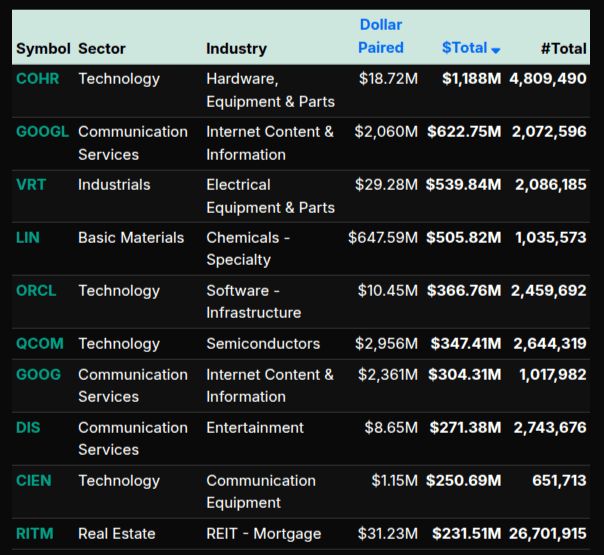
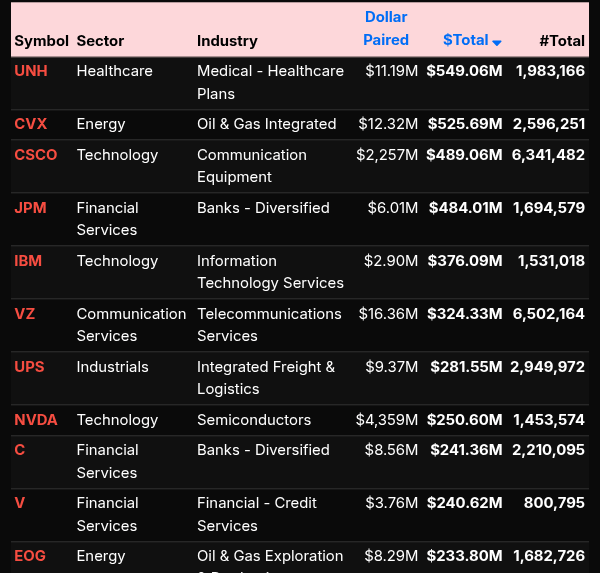
At the single-name level, flows were mixed but leaned toward large-cap rotation. Strong buy imbalances appeared in names like COHR, GOOGL, and LIN, while sell-side pressure was concentrated in UNH, CVX, and financials such as JPM and C. Notably, NVDA and ORCL attracted buy interest, reinforcing the relative strength seen in the tech sector.
Index-level data highlights the divergence: NYSE (-70.9%) and S&P 500 (-65.7%) confirmed broad sell pressure, while Nasdaq posted a positive +59.1% lean, indicating relative strength and internal rotation into growth.
Overall, this was a sell-driven MOC with selective rotation into technology rather than a market-wide accumulation phase.
Technical Edge
Fair Values for March 23, 2026
-
SP: 47.47
-
NQ: 203.98
-
Dow: 268.29
Daily Breadth Data 📊
For Friday, March 20, 2026
• NYSE Breadth: 20% Upside Volume
• Nasdaq Breadth: 26% Upside Volume
• Total Breadth: 24% Upside Volume
• NYSE Advance/Decline: 15% Advance
• Nasdaq Advance/Decline: 24% Advance
• Total Advance/Decline: 21% Advance
• NYSE New Highs/New Lows: 41 / 203
• Nasdaq New Highs/New Lows: 57 / 447
• NYSE TRIN: 0.74
• Nasdaq TRIN: 0.88
Weekly Breadth Data 📈
For Week Ending March 20, 2026
• NYSE Breadth: 41% Upside Volume
• Nasdaq Breadth: 45% Upside Volume
• Total Breadth: 44% Upside Volume
• NYSE Advance/Decline: 28% Advance
• Nasdaq Advance/Decline: 29% Advance
• Total Advance/Decline: 28% Advance
• NYSE New Highs/New Lows: 155 / 291
• Nasdaq New Highs/New Lows: 194 / 716
• NYSE TRIN: 0.53
• Nasdaq TRIN: 0.48

Today’s BTS Levels:
ES H
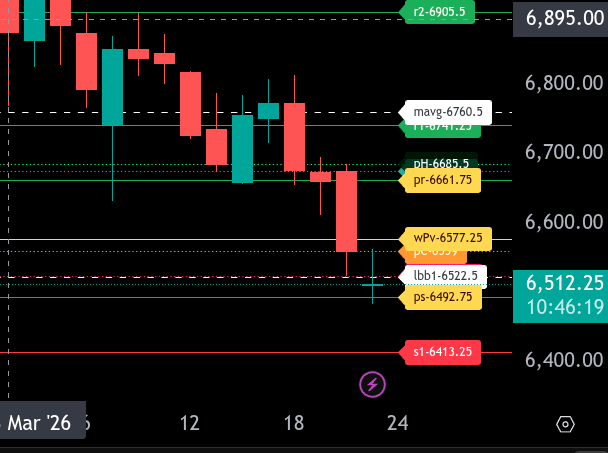
The bull/bear line for the ES is at 6577.25. This is the key level that must be reclaimed for bullish momentum to resume. Above this level, we look for potential buying opportunities on dips.
Currently, price is trading around 6510.75, showing clear weakness below the bull/bear line after a sharp selloff. As long as price remains below 6577.25, sellers are in control, and rallies into resistance are likely to be sold.
On the downside, immediate support comes in at 6522.50, followed by 6492.75, which aligns with the lower range target. A break below 6492.75 opens the door for further downside extension toward 6413.25.
On the upside, resistance is stacked at 6559.00 and then 6577.25. Above that, we look toward 6611.75 and 6675.50 as key recovery levels. The upper range target sits at 6685.50. Bulls need to reclaim and hold above 6577.25 to shift momentum and target these higher levels.
Overall, the trend remains bearish below 6577.25, with continuation likely unless buyers can reclaim that level and sustain acceptance above it.
NQ H
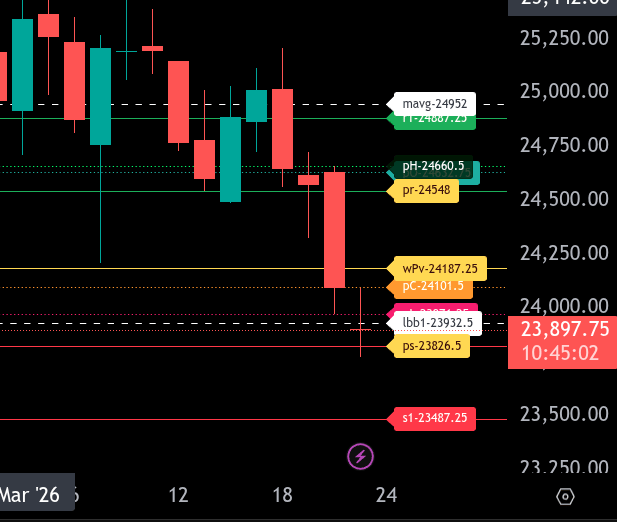
The bull/bear line for NQ is at 24187.25. This remains the key pivot for today. As long as price is trading below this level, the market is in a bearish posture and rallies into resistance should be treated with caution.
Currently, NQ is trading around 23904.50, well below the bull/bear line, indicating continued overnight weakness. If price remains below 24187.25, expect downside continuation targeting 23826.50, which is the lower range target for today. A break and acceptance below this level opens the door for further downside into 23487.25.
On the upside, initial resistance comes in at 24101.50, followed by the key bull/bear line at 24187.25. If buyers can reclaim and hold above this level, we can look for continuation higher into 24548.00 and then 24632.75–24660.50. The upper range target for today sits at 24887.25, which would require sustained bullish momentum.
Additional support levels to monitor below current price are 23971.25 and 23932.50. Losing these levels increases the probability of a test of 23826.50.
Overall, the market remains bearish below 24187.25. Acceptance back above this level would be the first signal of a potential shift in intraday sentiment, but until then, rallies are likely to be sold.
Calendars
Today’s Economic Calendar
This Week’s Important Economic Events
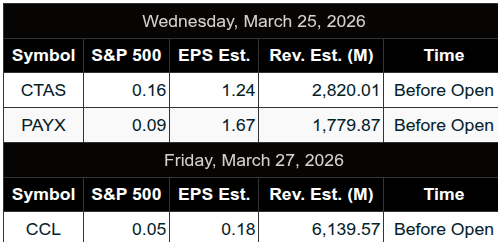
Upcoming Earnings – SP500
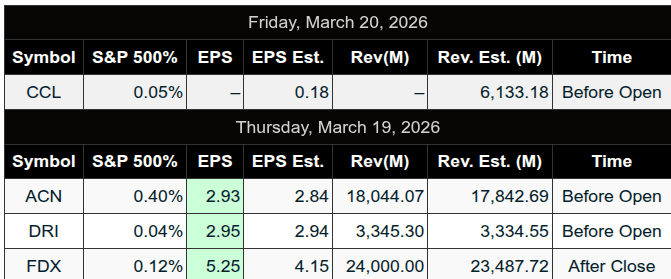
Recent Earnings
Room Summaries:
Polaris Trading Group Summary – Friday, March 20, 2026
The session unfolded as a classic options expiration day that started relatively controlled but degraded into a sharp risk-off selloff into the close.
Morning: Structured Levels, Clean Execution
-
Focus early was on key zones and gamma positioning, especially:
-
6625–23 area (key resistance awareness)
-
6600 D-Level as a major pivot
-
-
Market tested 6600 D-Level and bounced ~10 handles, validating it as responsive support.
-
Clear instruction from David:
-
Bulls needed to reclaim and hold 6612 to regain strength (they failed).
-
Best Trade Insight:
-
DLMB / Money Box + D-Level reclaim setup
-
Entry around 6589–6600 zone
-
Target: Prior Low (PL)
-
Result: ~10-point winner
-
Clean example of structured, rule-based trading paying off
-
Midday: Rotation & Patience
-
Market stayed relatively quiet for OPEX, with:
-
Gamma levels shifting lower (6591 → 6550 zones)
-
Continued discussion on GEX complexity (“4D chess”)
-
-
David noted:
-
6540 SPX / 6593 ES as a key gamma reference
-
-
Tone: Stay patient, stay aligned
Afternoon: Breakdown & Statistical Targets Hit
-
Market began accelerating lower into Cycle Day 3 (CD3) expectations.
-
Key downside levels:
-
CD3 Statistical Violation Target: 6547.20
-
NQ hit its lower target as well (24081)
-
These targets were cleanly fulfilled, showing strong adherence to PTG modeling.
Closing Session: Full Risk-Off Event
-
Selling intensified sharply:
-
VIX > 28
-
Fear & Greed Index: 14 (Extreme Fear)
-
MOC Sell Imbalance: $5.5B
-
-
David’s call:
-
“Closing dumpster fire”
-
“Risk-Off FRYday (Captain Obvious)”
-
This was a textbook emotional flush into the close.
Key Takeaways & Lessons
What Worked Well
-
Structured level trading (D-Level, Money Box)
-
Respecting gamma + cycle day context
-
Taking clean, defined trades (10-point winner example)
-
Letting targets come to you instead of chasing
Important Lessons
-
Failure to reclaim key levels (6612) = directional clue
-
OPEX can stay quiet… until it doesn’t
-
CD3 often delivers extremes — be prepared, not surprised
-
Sentiment extremes (VIX, Fear Index) confirm—not predict—moves
DTG Room Preview – Monday, March 23, 2026
Morning Market Summary
-
Middle East tensions remain the dominant driver; US-Iran escalation continues with threats and retaliatory strikes targeting energy infrastructure
-
Oil moving higher on supply disruption fears; IEA warns damage across global energy systems could have prolonged economic impact
-
Broad risk-off tone: equities under pressure and gold seeing an aggressive liquidation (-10% last week) as part of a “sell everything” move
-
Trump-Powell tensions ongoing; Powell signals he may remain in place beyond May if no successor is confirmed
-
Light earnings calendar (KT premarket, GME Tuesday); Construction Spending at 10:00am ET
Market Structure / Flow
-
Volatility elevated; ES 5-day ADR up to 125.25
-
Whale bias leaning short into US open on moderate overnight volume
Technical Levels (ES)
-
Key support: 6514/09s (channel bottom being actively tested)
-
Break below opens path toward deeper correction territory
-
Resistance levels: 6815/10, then 6956/51s
-
200-day MA at 6765 acting as overhead resistance
Affiliate Disclosure: This newsletter may contain affiliate links, which means we may earn a commission if you click through and make a purchase. This comes at no additional cost to you and helps us continue providing valuable content. We only recommend products or services we genuinely believe in. Thank you for your support!
Disclaimer: Charts and analysis are for discussion and education purposes only. I am not a financial advisor, do not give financial advice and am not recommending the buying or selling of any security.
Remember: Not all setups will trigger. Not all setups will be profitable. Not all setups should be taken. These are simply the setups that I have put together for years on my own and what I watch as part of my own “game plan” coming into each day. Good luck!
This post goes out as an email to our subscribers every day and is posted for free here around 2 PM ET. To get your real-time copy, sign up for the free or premium version here: Opening Print Subscribe.
Comments are closed