Markets Hit New Highs Ahead of CPI & Fed
Does Powell have any ammo left?
Follow @MrTopStep on Twitter and please share if you find our work valuable!
Every week, MrTopStep invites traders to an “Own the Close” contest where the closest guesstimate where the SPX will settle on Friday’s 4:00 cash close.
The winners get a free week’s access to the MrTopStep Chat and trading tools. Enter your guess now!
Our View
What more can be said?
The 10-yr note auction on Tuesday helped paint the tape for yesterday and today. I know there is a chance that the ES puked, but I think the odds of that are low.
I will say one thing: Everyone I know is bullish — which usually isn’t good. That said, I think the CPI may come in lower and patsy Powell will stand firm for a September rate cut even though he knows there won’t be one in 2024. I’m leaving it at that.
Our Lean
I expect some shake, rattle & roll today and ES 5400+
If the ES sells off after the CPI release, I’m adding to my NQ long. I don’t think Powell has any ammo left, so if the index markets sell off, I’ll add on the pullback as well. I also think we will see expanded trading ranges. My concern is what happens in the event of a big gap up?
If I am wrong I’ll get out and start over, but the bottom line is I don’t think the markets want to go down. After all, it’s an election year!!
As for levels, I’m watching:
Resistance 5390, 5403, 5420, 5438, 5450, 5463
Support 5370, 5362, 5350, 5341- 5338, 5328, 5306
Fed Not Helping the Small Caps
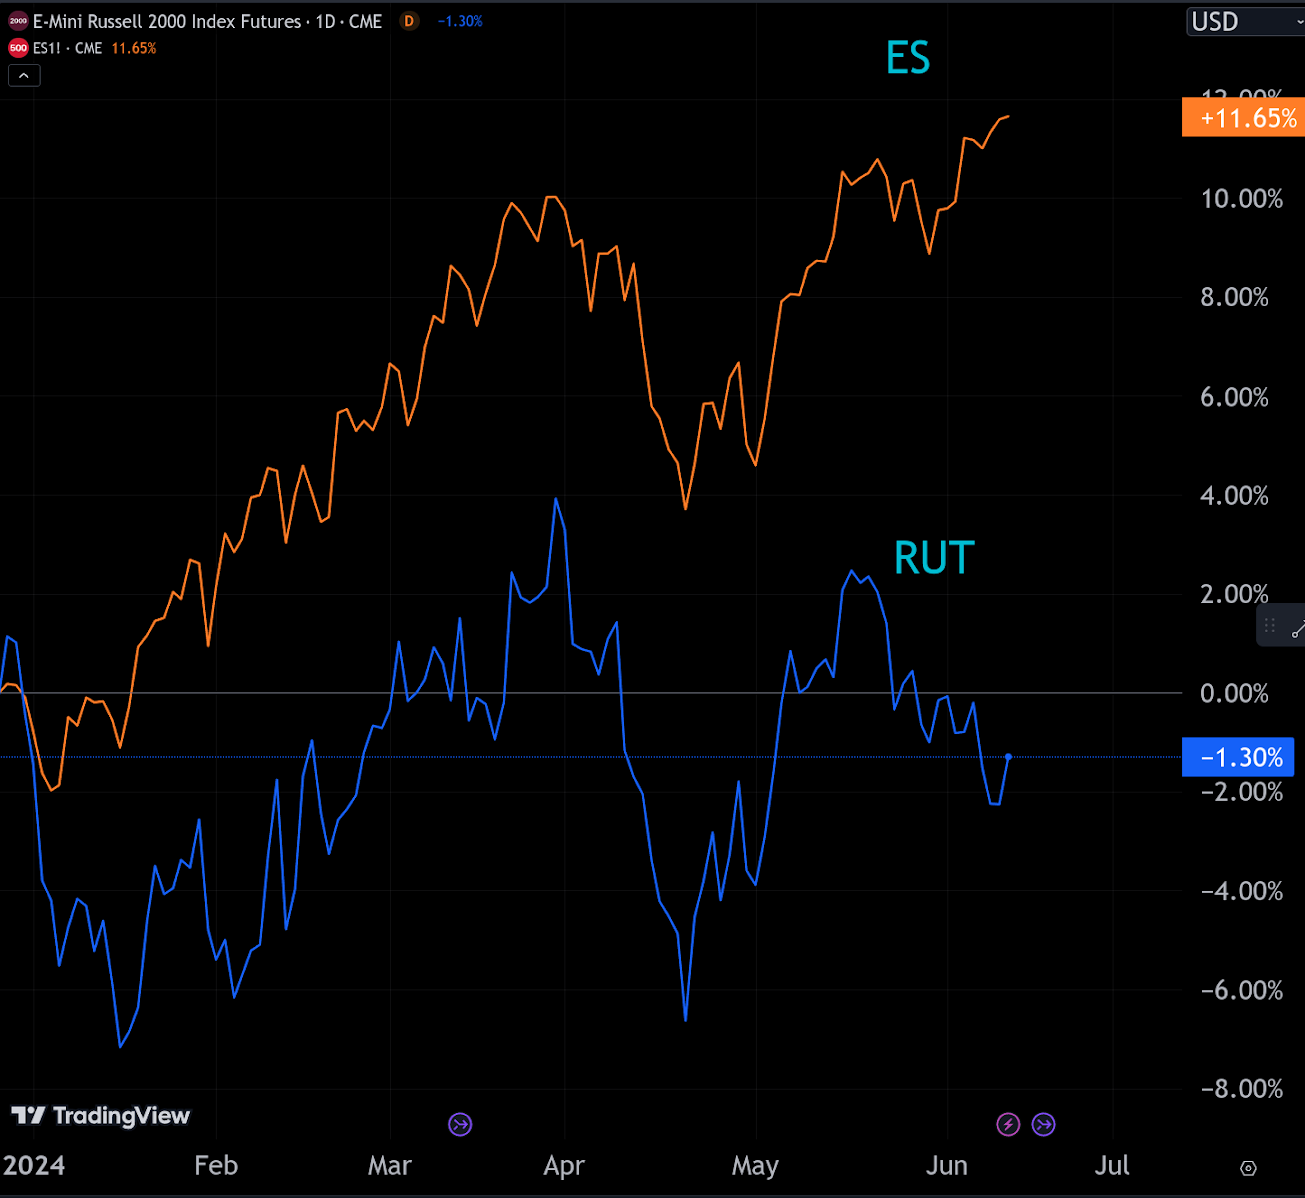
S&P vs. Russell
One last thing…I actually did a lot of RTY outrights and spreads in the Russell futures pit. It never excited me then and not much has changed. It’s also clear that small caps have fallen out of flavor.
What is going on with the Russell 2000?
The Russell 2000 recorded its worst relative performance against the S&P 500 in 23 years and seems like the hardest hit if the Fed continues to signal a higher interest rate environment for a longer period.
They say RTY is considered a bellwether for the US economy as it reflects the performance of smaller companies focusing on the US market and today — like the rest of the index markets — that will be put to the test. In contrast to the ES that made its 27th new high for the year and is up 14.5%, the RTY is down 0.13% and has not made a fresh new contract high in two years.
Will today’s CPI or Fed meeting help? My guess is it will… but I don’t think it will last.
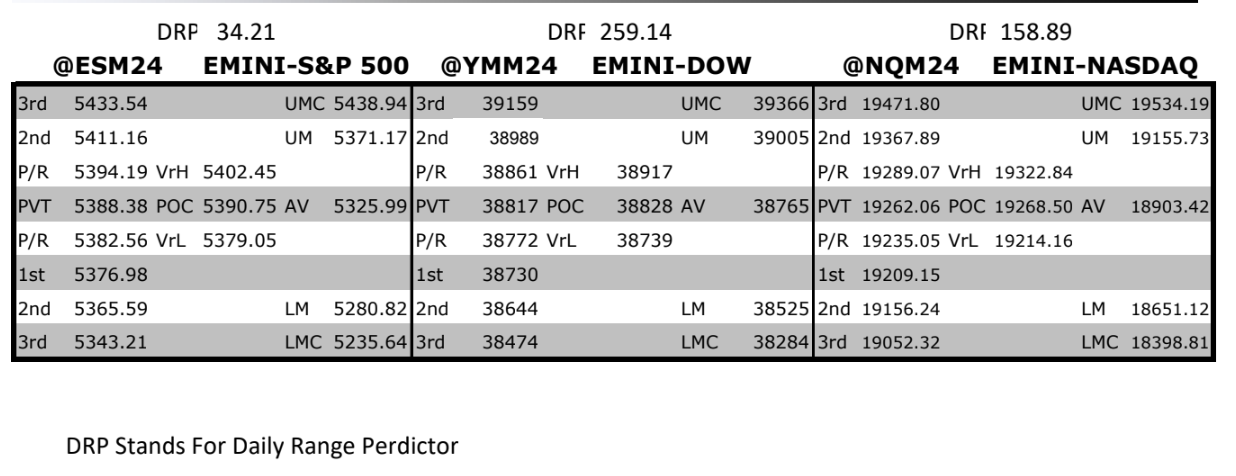
MrTopStep Levels:
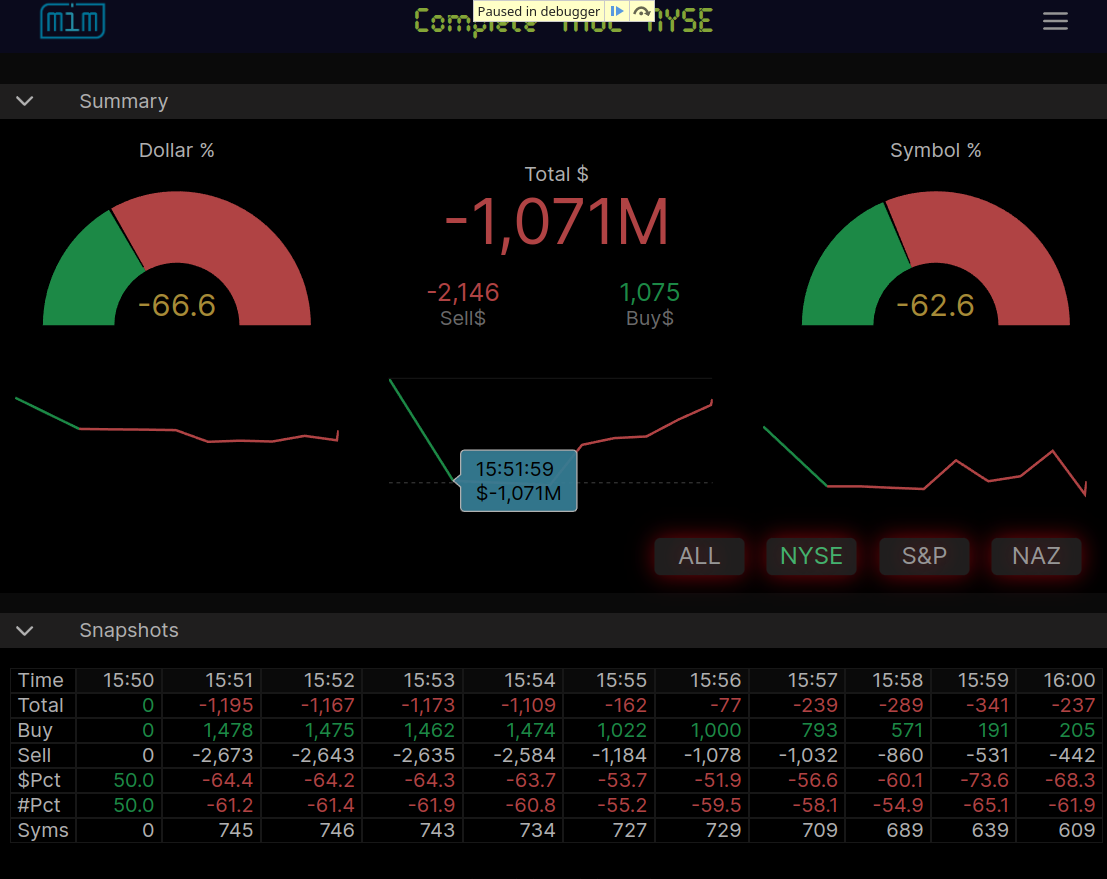
MiM and Daily Recap
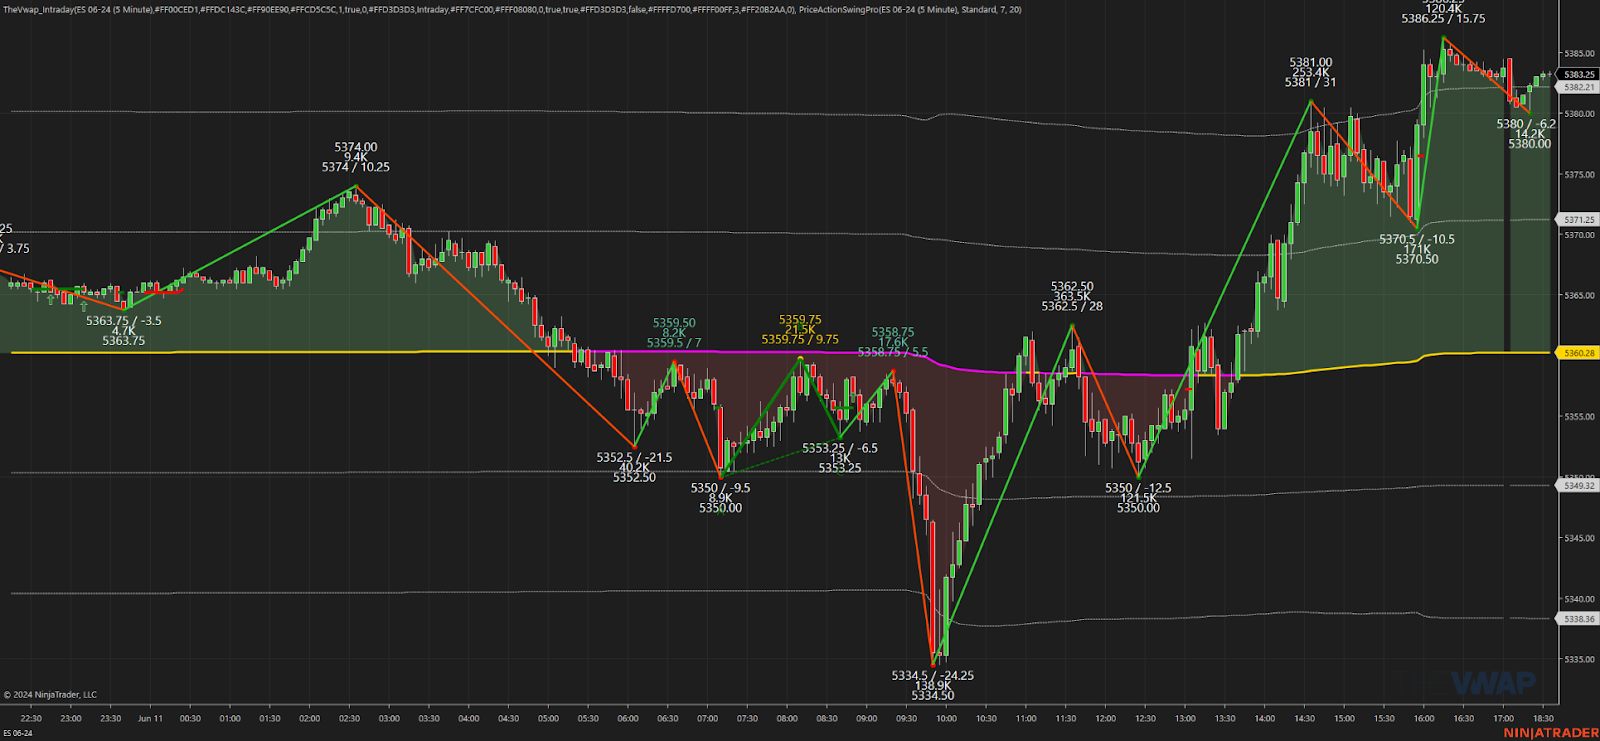
ES recap
The ES traded down to 5350.00 on Globex and after the open, it traded 5355.75 and then sold off down to 5334.50 at 9:50. From the opening high to the low, 140k ES traded. After the low, the ES rallied back up to 5362.00 at 11:01, and from low to high, 281k ES traded. The ES pulled back to 5354.25, rallied up to a new high at 5362.50, sold down to 5350.00 at 12:25 and then rallied up to a lower high at 5357.25 at 12:45.
The ES traded 5354.00 at 1:00 after the results of the 10-yr note auction hit the tape showing pretty good results. The bid-to-cover was a strong 2.67, the highest since February 2022 and one of the highest going back to early 2016. The ES dipped down to 5351.50 at 1:01, rallied, pulled back to 5353.50 and it was that down-tick that set off a 27.5 point rally up to 5381.00. After the high, the ES sold off down to 5370.50, traded 5371.50 as the imbalance showed over $1 to sell and traded 5483.75 on the 4:00 cash close. After 4:00, the ES traded up to 5386.25 and traded 5383.75 on the 5:00 futures close, up 12.5 points or +0.27%. The NQ settled at 19,247.50, up 140.75 points or +0.74%, and both closed at another record high the day before the inflation data and the Fed announcement.
In the end I think the PPT is painting the tape for the CPI and the Fed. In terms of the ES’s overall tone, the only weakness was after the open. In terms of the ES’s overall trade, volume was higher, with 1.36 million contracts traded.
Technical Edge
-
NYSE Breadth: 36% Upside Volume
-
Nasdaq Breadth: 52% Upside Volume
-
Advance/Decline: 37% Advance
-
VIX: ~13
Guest Post — David Dube of Polaris Trading Group
Topic: PTG Daily Trade Strategy Briefing
Website: https://polaristradinggroup.com/
S&P 500 (ES)
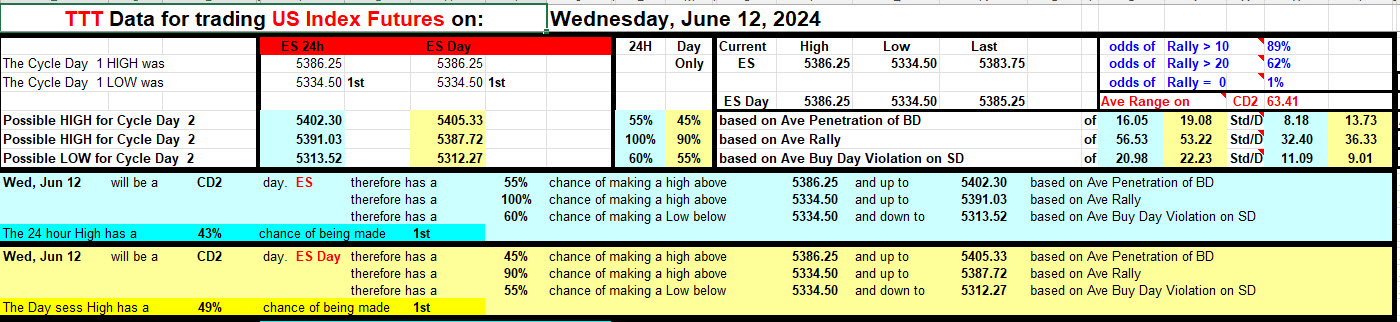
Prior Session was Cycle Day 1: Normal CD1 as price declined to produce a new cycle low at 5334.50, which fulfilled the expected average decline as outlined in prior DTS Briefing 6.11.24. Once the new low was deemed “secure”, buyers regained control and by end of the day the upside target (5385) was fulfilled. Range was 51 handles on 1.318M contracts exchanged
…Transition from Cycle Day 1 to Cycle Day 2
This leads us into Cycle Day 2: Potentially market-moving “dual” events are the CPI Report (8:30 am) with an expected 0.01% reading for May and the FOMC/Presser (2:00 – 2:30 pm). The “dot-plot” will be the main focus during the “bobble-head” Q&A. We will remain true to our discipline of aligning with the dominant forces of the day and seek out our A-Plus+ trade opportunities.
As always, our tactical trade plan remains unchanged…Stay in alignment with dominant intra-day forces.
As such, scenarios to consider for today’s trading.
Bull Scenario: Price sustains a bid above 5375, initially targets 5390 – 5410 zone.
Bear Scenario: Price sustains an offer below 5375, initially targets 5355 – 5350 zone.
PVA High Edge = 5366 PVA Low Edge = 5334 Prior POC = 5355
***NOTE: IF you want to learn more about how the 3-day cycle levels are derived, THEN check out the FREE TRIAL offer below. Cycle Analysis is an integral part of the PTG Methodology.
*****The 3 Day Cycle has a 92.11% probability of fulfilling Positive Cycle Statistics covering 12 years of recorded tracking history.
Thanks for reading,
PTGDavid
Economic Calendar
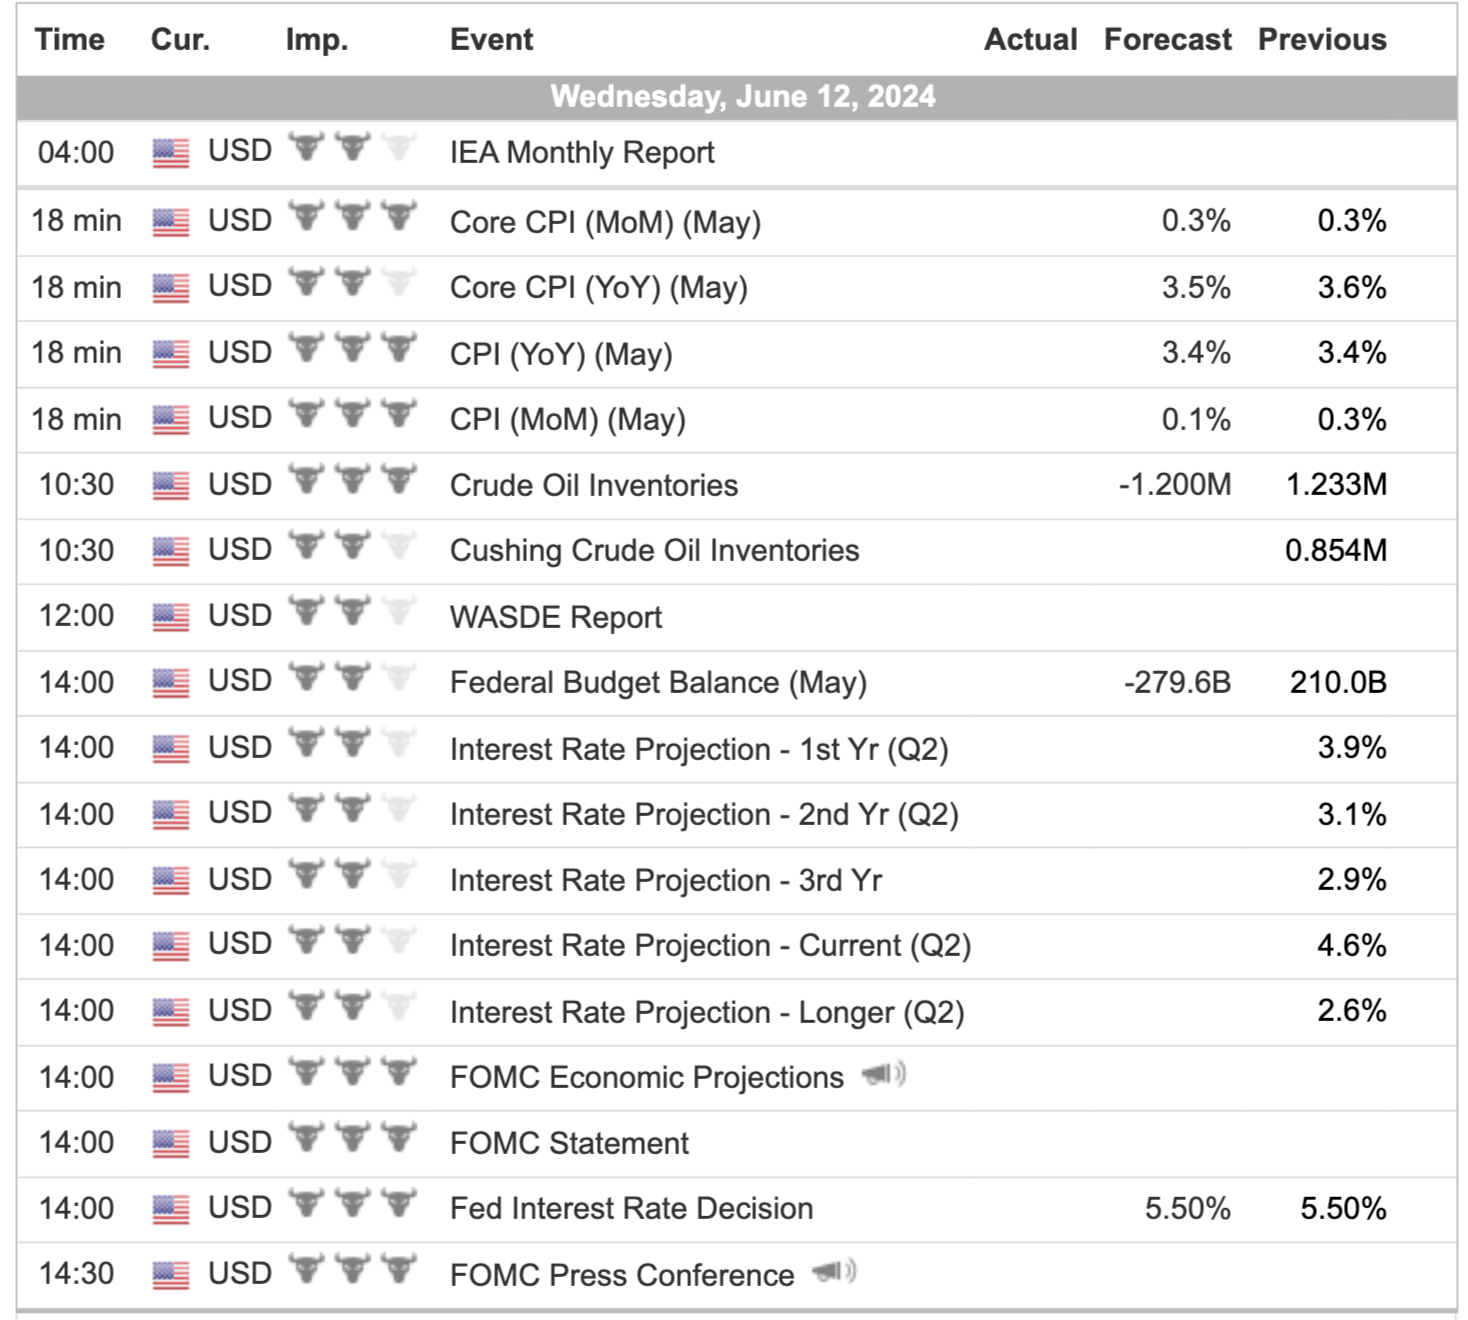
For a more complete Economic Calendar see: https://mrtopstep.com/economic-calendar/
Comments are closed