This post goes out as an email to our subscribers every day and is posted for free here around 2 PM ET. To get your real-time copy, sign up for the free or premium version here: Opening Print Subscribe.
Markets on Edge: Trading Amid Missiles, Tariffs, and Triple Witching
Follow @MrTopStep on Twitter and please share if you find our work valuable!
Our View
We live in an ever-changing world where nothing stays the same for very long. While the world continues to push for a ceasefire in Ukraine, Israel and Iran are now going toe-to-toe, and North Korea is saying it’s going to provide military assistance.

After selling off down to 5979.00 on Globex, the ESu opened Friday’s regular session at 5996.25, rallied up to 6082.50, and then sold off down to the 6024 area after Iran launched ballistic missiles toward Israel late Friday local time in retaliation for Israel’s airstrikes that have hit over 200 targets. The MiM just came out showing $1.45 billion to buy, and the ES rallied back up to the 6035 area. I went home short 1 ES.
The ES has gone a long way and overlooked a gamut of critical negatives. It’s 4:30 Sunday, and the PitBull just called me and asked what I thought. I told him I was going to cover my short ES on the open. I said I thought a gap like this could see some buying — and when they were 30 off the low, he called me and said, “Good call, now what?”
The ES traded 6001.00, printed 6000.00, and rallied 42.50 points up to 6042.50. I also told the PitBull I had no idea what the ES would do next — and I honestly believe that. I would think the ES and NQ would be tanking, but they aren’t. I do not get it. The Middle East is on fire like nothing anyone has ever seen. Israel is hitting hundreds of targets in Iran, and Iran is unleashing hundreds of drones and ballistic and hypersonic missiles. Both countries have attacked each other’s “pentagons.” We are witnessing some of the most advanced weapons in the world being used, and some of them are going so fast they can’t be stopped.
There will always be certain stock market events that are recurring, and one of them was the 1990 Gulf War I. Some of you weren’t even born yet. On August 2, 1990, Gulf War I broke out after Iraq attacked Kuwait to seize its oil reserves and resolve economic disputes. A U.S.-led coalition launched a military response in January 1991 to expel Iraqi forces, driven by concerns over regional stability and oil supply security.
During this time, my S&P desk got very busy — especially when Saddam Hussein fired 42 Scud missiles at or around Tel Aviv, injuring 229 people and damaging several residential buildings. Every time a Scud was fired at Israel, there would be alerts and news coverage, with some reporter from a building miles away saying they had to run for cover — and the S&P reacted to the headlines on a daily basis.
Before Iraq’s invasion of Kuwait, the price of West Texas Intermediate (WTI) crude oil was around $17–$18 per barrel. Following the invasion, prices spiked due to fears of supply disruptions in the oil-rich region. By October 1990, WTI crude peaked at around $36 per barrel, more than doubling in a few months.
Gold prices averaged ~$383 in 1990 and ~$362 in 1991, peaking at ~$427 and dipping to ~$344, with a slight spike after Iraq’s Kuwait invasion. Prices fell through the 1990s to $252 by 1999, then surged in the 2000s, reaching the current prices of $3,431–$3,452 per ounce.
The DXY effective exchange rate dropped from 115.33 on August 2, 1990, to around 109–110 by February 28, 1991, a decrease of about 4.5%–5.2%. The First Gulf War ended with a ceasefire on February 28, 1991, and a formal armistice on March 3, 1991, following Kuwait’s liberation. The Second Gulf War began on March 20, 2003, and ended on December 18, 2011, with the withdrawal of U.S. troops after more than eight years of conflict.
What’s the takeaway? Well, the first part is that history has a way of repeating itself — and contrary to what many traders think, wars in the Middle East tend to go a lot longer than people expect. Israel is trying to cut the head of the snake off like it did with Hezbollah and Hamas, but Iran’s military is considered the largest in the Middle East. It boasts the region’s largest ballistic missile arsenal, including short-, medium-, and potentially hypersonic-range missiles. Iran is also a leader in drone technology, and its navy emphasizes asymmetrical warfare with a large fleet of speedboats and submarines to control strategic waters.
I don’t think Iran is going to back down or go down without a fight and larger destruction. It’s like the PitBull said: Israel can’t quit now — they’re going to continue to blow up Iran until Iran gives in.
This week’s economic calendar features key data releases and Treasury auctions, with markets closed on June 19 for Juneteenth. See the full schedule below.
Our Lean
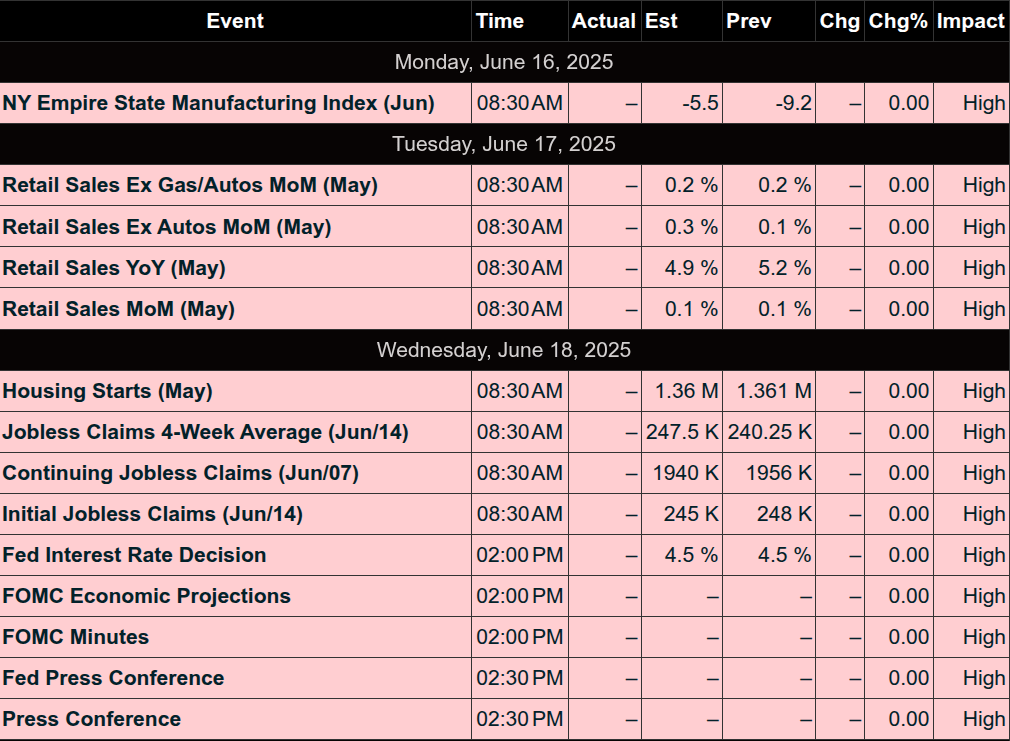
The only thing I can say is that there is a lot of bad shit going on. We have a full economic schedule this week, and the Fed’s two-day meeting, the G7, a lot of tariff war headlines, and the June Triple Witching $4.5 trillion expiration. The shortened four-session week has “overload” written all over it.
Our lean: Total volume last Friday was an astonishing 871k contracts traded when you take out the ESM/ESU spread volume (rollover). I know I always say “thin to win,” but when volume drops this much, it can also be a warning sign.
I don’t know what is going to happen, but I do expect a lot of banging around. Had the ES and NQ opened lower, I would be a buyer—but it looks like that ship has sailed.
I think the fighting in the Middle East creates a high level of uncertainty, and that should mean you can sell the big rips.
MiM and Daily Recap
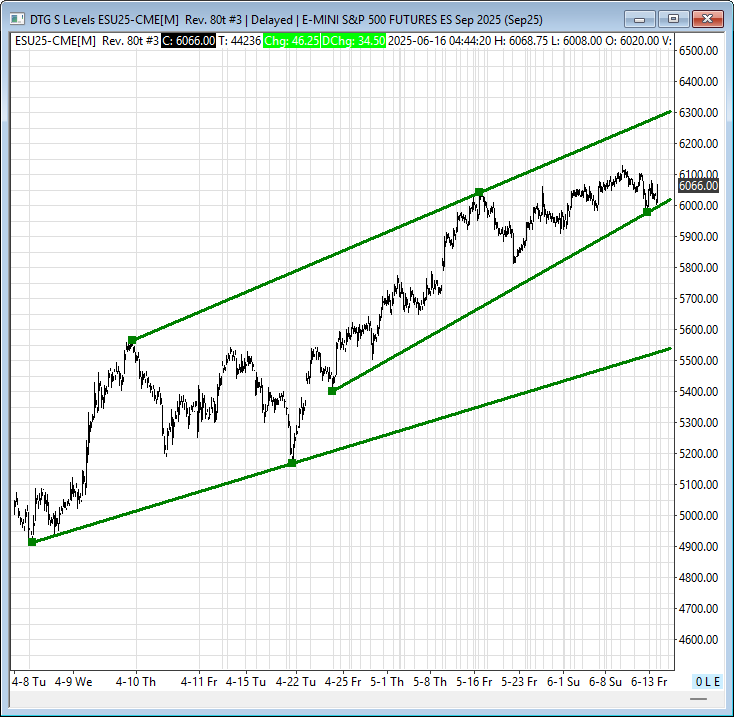
ESU2025
ESM2025
The S&P 500 futures (ES) experienced a volatile session on Friday, beginning with significant overnight weakness in the Globex session due to news of missile attacks in the Middle East, before attempting a recovery in the regular cash session.
Intraday Recap
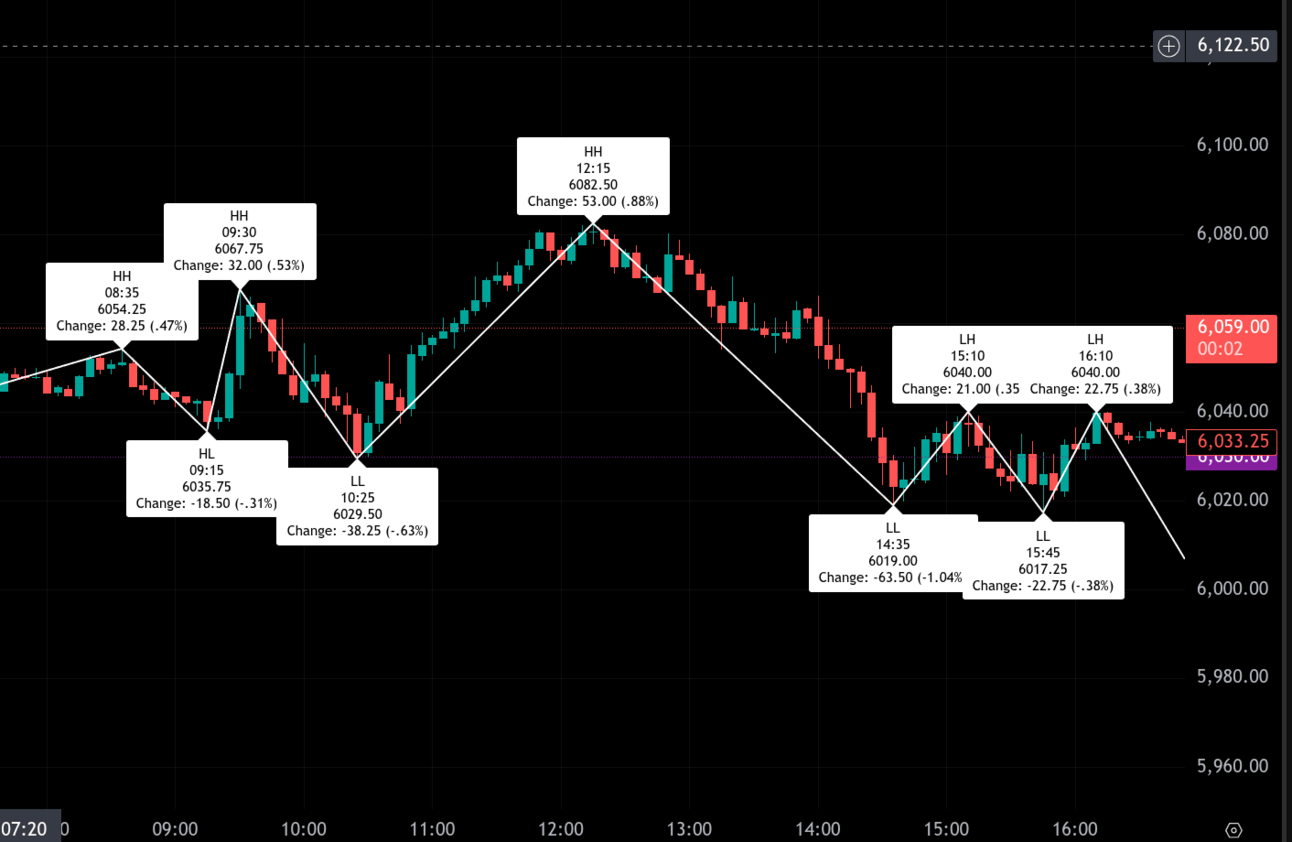
The session began with the overnight Globex session reacting to geopolitical news. ES hit a low of 5979.00 at 10:30 PM ET, marking a significant decline of 126.25 points (-2.07%) from its earlier levels. As the overnight session progressed, a recovery attempt saw ES rise to a high of 6054.25 at 8:36 AM, a gain of about 75 points from the low. Some weakness settled in before the cash open as ES fell about 18 points to 6035.75 before a final push higher into the open.
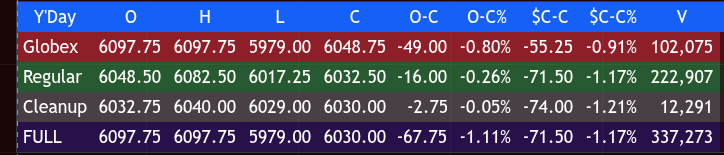
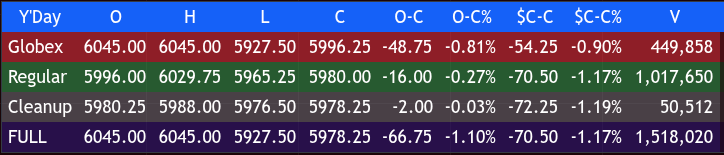
The regular cash session (9:30 AM ET until 4:00 PM ET) opened at 6048.50. Price struggled to hold the opening high and fell back from the 6067.75 opening high about 39 points to 6029.50 by 10:25 AM ET. From there, prices surged to a new intraday high of 6082.50 by 12:15 PM ET, representing a gain of 53.00 points (+0.88%).
The market then turned lower in the afternoon, dropping to a low of 6019.00 at 2:35 PM ET, shedding 63.50 points (-1.04%) from the midday high. A subsequent bounce up to 6040 at 3:10 PM fell back to a lower low of 6017.25 at 3:45 PM ET, and a brief recovery attempt saw prices reach 6040.00 at 4:10 PM ET, up 21.00 points (+0.35%). The regular session closed at 6032.50.
The Cleanup session (4:00 PM ET until 5:00 PM ET) saw the market close at 6030.00. From the previous cash close to Friday’s cash close ($C-C), the ES was down 71.50 points, or -1.17%. The day’s open-to-close (O-C) in the regular session was down 16.00 points, or -0.26%. The full session closed down 67.75 points, or -1.11% from its open.
Market Tone & Notable Factors
The overall sentiment for the day leaned bearish, largely influenced by the early overnight weakness driven by geopolitical events. While there were attempts at recovery, sellers maintained control through key parts of the session.
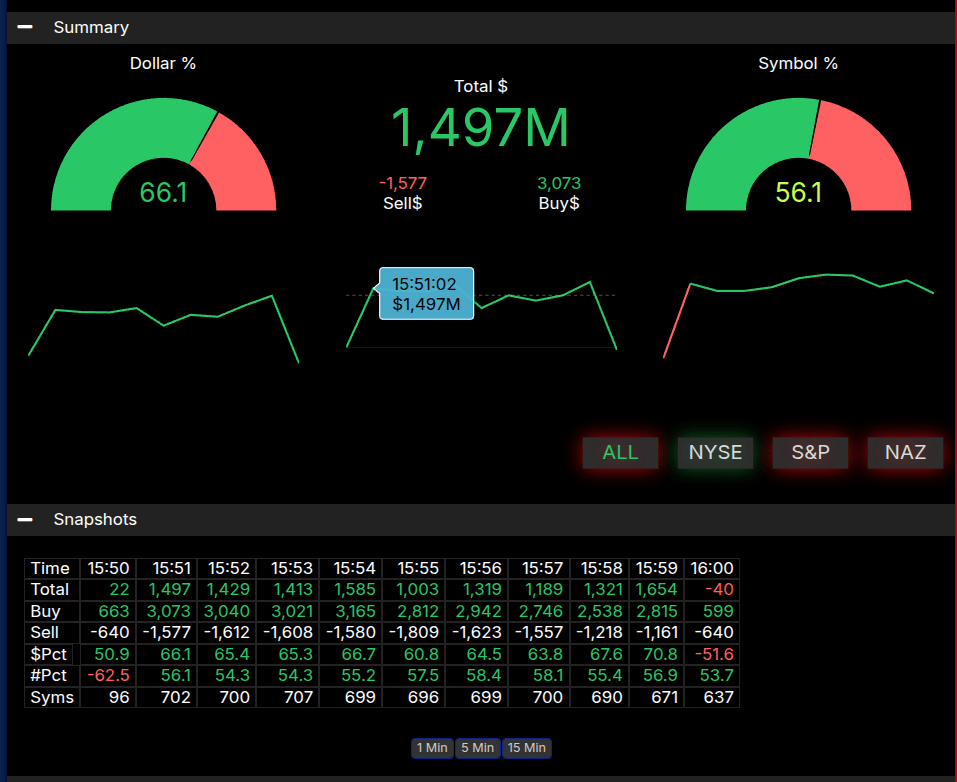
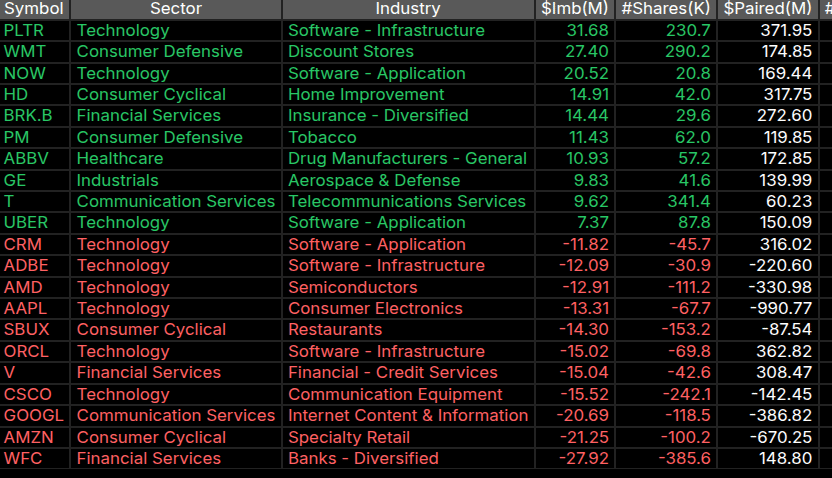
The Market-on-Close (MOC) imbalance data showed a total imbalance of $ 1,497 M. The symbol imbalance, which indicates the number of symbols on the buy versus sell side, peaked at 67.6% favoring buys at 3:59 PM, surpassing the ±66% threshold for a notable imbalance. This strong buy-side symbol imbalance likely provided some support for prices into the close, helping to mitigate further losses. The market concluded the day with a noticeable decline, reflecting the initial shock of the overnight news and subsequent struggles to sustain a clear upward trend. The outlook for the next session will likely depend on further developments in geopolitical events. The US has become a flight to safety in times of financial and geopolitical turmoil.
Technical Edge
Fair Values for June 16, 2025:
-
SP: 54.47
-
NQ: 228.93
-
Dow: 332.57
Daily Breadth Data 📊
For Friday, June 13, 2025
-
NYSE Breadth: 24% Upside Volume
-
Nasdaq Breadth: 28% Upside Volume
-
Total Breadth: 27% Upside Volume
-
NYSE Advance/Decline: 20% Advance
-
Nasdaq Advance/Decline: 20% Advance
-
Total Advance/Decline: 20% Advance
-
NYSE New Highs/New Lows: 44 / 60
-
Nasdaq New Highs/New Lows: 78 / 129
-
NYSE TRIN: 0.66
-
Nasdaq TRIN: 0.67
Weekly Breadth Data 📈
For the Week Ending June 13, 2025
-
NYSE Breadth: 49% Upside Volume
-
Nasdaq Breadth: 67% Upside Volume
-
Total Breadth: 61% Upside Volume
-
NYSE Advance/Decline: 41% Advance
-
Nasdaq Advance/Decline: 37% Advance
-
Total Advance/Decline: 38% Advance
-
NYSE New Highs/New Lows: 168 / 70
-
Nasdaq New Highs/New Lows: 385 / 195
-
NYSE TRIN: 0.69
-
Nasdaq TRIN: 0.29
Today’s Levels:
ES
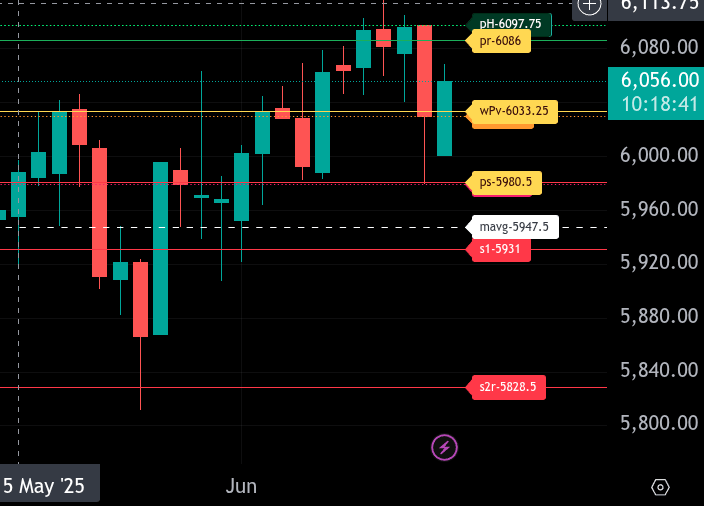
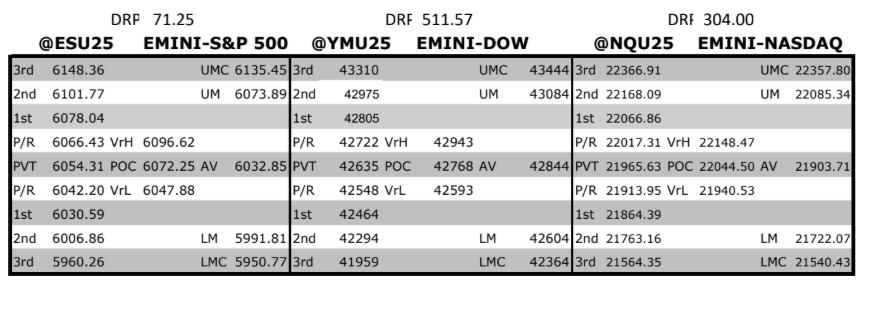
The bull/bear line for the ES is at 6033.25. This is the key level that must be reclaimed for bullish momentum to resume. Above this level, we look for potential buying opportunities on dips.
Currently, ES is trading around 6057.50, indicating strength above the bull/bear line. If the price remains above this level, expect further upside pressure, targeting 6086.00 and 6097.75, our upper range target for today. A break above these levels could extend the climb towards 6135.75.
On the downside, support comes in at 5980.50, our lower range target. If ES cannot hold above 6033.25, a test of this support level is likely. Bears need sustained weakness below 5980.50 to confirm a potential reversal, with further downside potential to 5931.00.
Overall, the trend remains bullish above 6033.25, and caution is warranted until this level is broken.
NQ
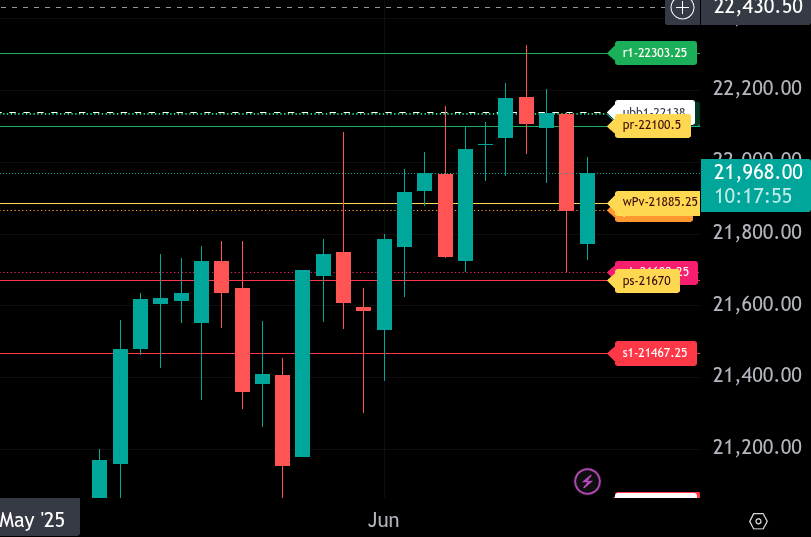
The bull/bear line for the NQ is at 21,885.25. This is the key level that must be reclaimed for bullish momentum to resume. Above this level, we look for potential buying opportunities on dips.
Currently, NQ is trading around 21,967.25, indicating strength above the bull/bear line. If the price remains above this level, expect further upside pressure, targeting 22,100.50, our upper range target for today. A break above this level could extend the rally towards 22,303.30.
On the downside, support comes in at 21,692.25 and then at 21,670.00, our lower range target. If NQ can reclaim 21,885.30 and hold below, a test of these support levels is likely. Bears need sustained weakness below 21,670.00 to confirm a potential reversal, with further downside potential to 21,467.30.
Overall, the trend remains bullish above 21,885.30, and caution is warranted until this level is broken.
Calendars
Today’s Economic Calendar
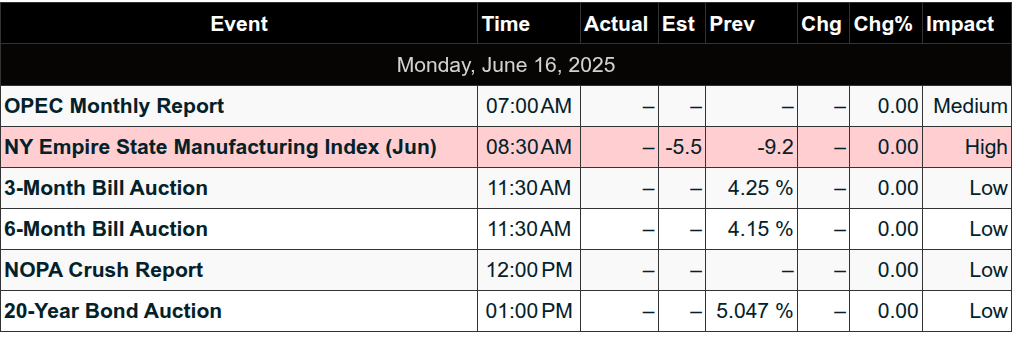
This Week’s Important Economic Events
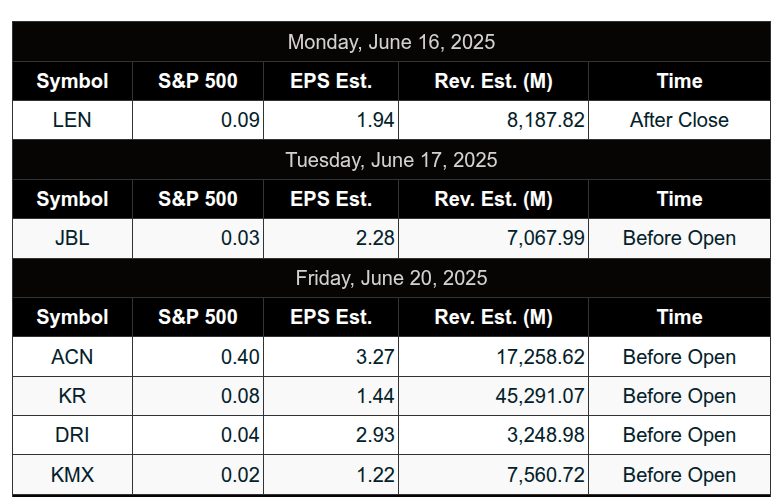
Today’s Earnings
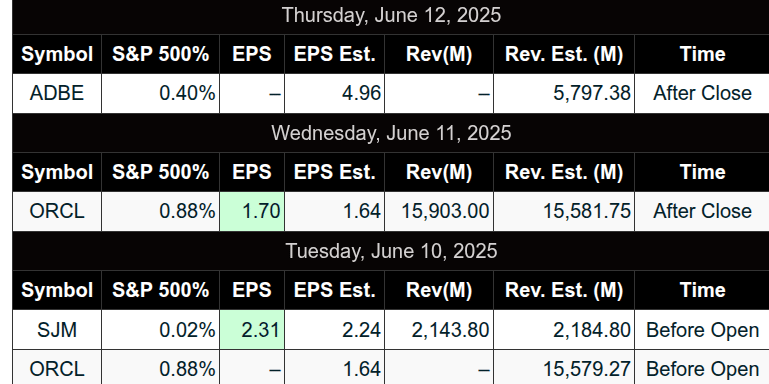
Recent Earnings
Room Summaries:
Polaris Trading Group Summary – Friday, June 13, 2025
Friday’s session was focused on disciplined execution, trade structure, and a strong emphasis on quality over quantity in trade selection. Here’s how the day unfolded:
Key Trades and Highlights:
-
CL Open Range Short: Early in the session, PTGDavid noted that all targets for the crude oil (CL) open range short were fulfilled—marking a solid trade opportunity right out of the gate.
-
Discount Zone and 89 EMA Discussion: A lengthy and valuable discussion centered around the 89 EMA and identifying structural pivot lows for discount entries. The lesson emphasized the importance of understanding structure over simply reacting to indicators.
-
Bull Stacker Signal: David walked through how a valid Bull Stacker entry (around 5994.25) with a structural stop (below 5985) could result in a favorable trade as the price moved up toward 6004. He clarified that even with a 9–10 point stop, proper position sizing and scaling (first scale at +5 pts) makes the trade viable.
-
Macro Impact: The Michigan Sentiment report came in much stronger than expected (60.5 vs. forecast 53.6), potentially influencing morning price action and providing traders a macro context to frame setups.
Lessons & Wisdom:
-
Trader Discipline: Reiterated wisdom from the room and from John Carter — the best traders wait patiently for high-quality setups.
-
“You Don’t Need More Trades… You Need Better Trades”: A theme echoed throughout the day, pushing traders to focus on planned execution rather than quantity.
-
OODA Loop Application: David emphasized applying the “Observation-Orientation-Decision-Action” loop to structure trades in real time, not just in hindsight.
-
Position Sizing: Detailed discussion on risk management, especially in context of a 10-point stop, helping traders refine how they size trades based on risk tolerance.
Community & Resources:
-
Several educational resources and video modules were shared, particularly about structural pivots and identifying transitions (especially relevant at market turning points).
-
Room engagement was strong with collaborative insights, shared tools like the PTG Bingo card, and thoughtful trade reflections.
Final Thoughts:
The session showcased thoughtful trade planning, a successful CL short setup, and valuable education on pivot-based decision-making. David’s guidance helped clarify how to treat discount zones and how to define entries with structural logic, reinforcing the PTG core trading principles.
A strong educational and strategic close to the week.
DTG Room Preview – Monday, June 16, 2025
-
CME Rollover: September ES is now the front-month contract.
-
Fed Week: Policy announcement and SEP due Wednesday. Rates expected to remain unchanged amid signs of easing inflation and steady job market.
-
Tariff Watch: July 9th tariff pause deadline looms. Despite promises, no major trade deals yet. Potential delay expected with ongoing global negotiations.
-
Geopolitical Risk: Israeli strike on Iranian nuclear assets pushed oil prices up 12% last week. Further escalation may impact inflation.
-
China Data: Mixed signals – retail sales up 6.4% YoY, but factory output fell for a third straight month; exports to US dropped 35% in May.
-
Corporate Earnings: Lennar (LEN) reports after the bell.
-
Economic Calendar: Light, with Empire State Manufacturing Index at 8:30am ET.
-
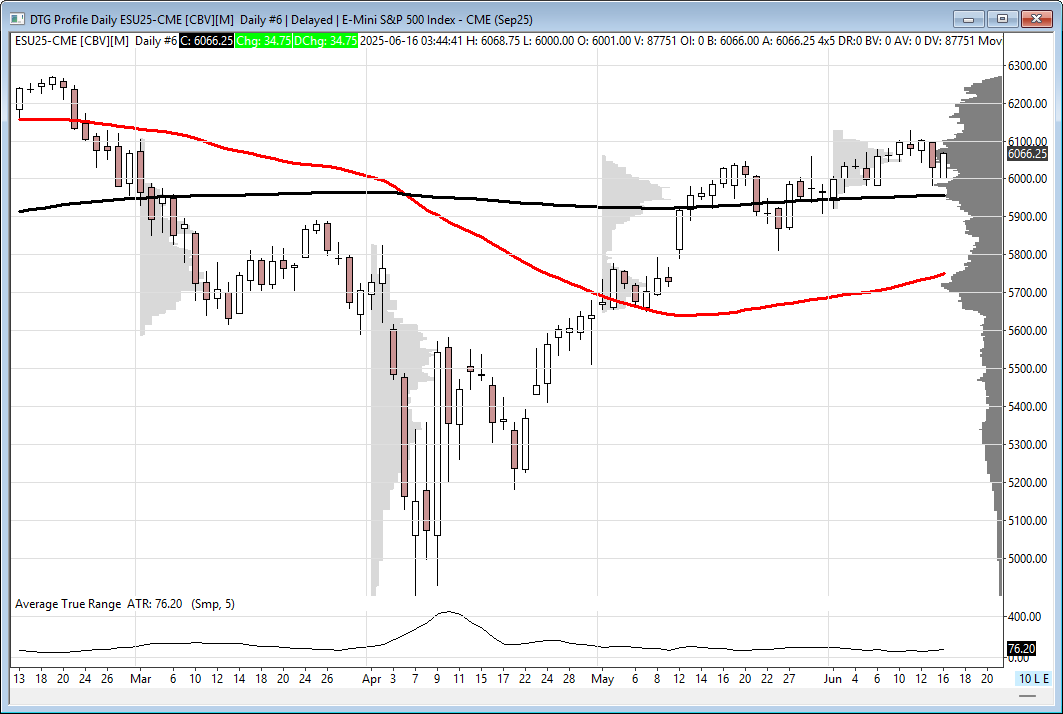
Volatility & Technicals: Friday saw a spike in SPX volatility; ES ADR at 69.5 points. New ES contract uptrend intact; key levels: Support at 5997/00s & 5957.25 (200DMA), Resistance at 6298/03s. No whale bias noted overnight.
Affiliate Disclosure: This newsletter may contain affiliate links, which means we may earn a commission if you click through and make a purchase. This comes at no additional cost to you and helps us continue providing valuable content. We only recommend products or services we genuinely believe in. Thank you for your support!
Disclaimer: Charts and analysis are for discussion and education purposes only. I am not a financial advisor, do not give financial advice and am not recommending the buying or selling of any security.
Remember: Not all setups will trigger. Not all setups will be profitable. Not all setups should be taken. These are simply the setups that I have put together for years on my own and what I watch as part of my own “game plan” coming into each day. Good luck!
This post goes out as an email to our subscribers every day and is posted for free here around 2 PM ET. To get your real-time copy, sign up for the free or premium version here: Opening Print Subscribe.
Comments are closed