This post goes out as an email to our subscribers every day and is posted for free here around 2 PM ET. To get your real-time copy, sign up for the free or premium version here: Opening Print Subscribe.
New World Trading Order: ES Still Smells Higher, but the VIX Is Lurking in the Alley
Follow @MrTopStep on Twitter and please share if you find our work valuable!
Our View
When I talked to the PitBull about the gold, he said something is up, and Market Profile Tom said the same thing. And for me—like the Twitter post at the top of the recap—I have never seen anything like yesterday’s trade. That’s all part of the “new world trading order.” I’m not smart enough to connect all the dots, and I don’t think anyone else is either, but complacency is no longer an option.
Our Lean
As crazy as this sounds, I still think the ES is going higher. But like I’ve repeated over and over, 2026 is the year of the VIX. Below are my new AI levels. I’m using the AI tool Claude, which is what most college coding classes are using. It’s better than GROK, ChatGPT, and GEMINI.
I have to admit, while I think the ES can rally, I’m not sure it will just go straight up without some further drops.
Like I told the guy I got off the streets in Chicago, when he warned me “they would break into my garage”: I know they’re coming—I just don’t know when. And that’s exactly how I feel about the stock market.
The levels below include Market Profile, VWAP, and the 50- and 200-day moving averages. I’ve never used anything like this before, and I believe as I learn more, and as Claude gets to know me better, it will only improve. It doesn’t know me, and I don’t know it… but it will soon.
Key Findings at Current Price (7,011.25):
CRITICAL IMMEDIATE LEVELS:
7,010 (VAH) – You’re RIGHT AT this level (-0.02%) – Decision point!
7,020 (Pivot) – Just above (+0.13%)
7,000 (Round) – Key psychological support (-0.16%)
MAIN SUPPORT ZONES:
6,960-6,985 – POC + Pivot cluster (first defense)
6,910-6,925 – MA cluster + VWAP (major support)
6,815 – Swing low (last resort)
MAIN RESISTANCE ZONES:
7,033-7,043 – R1 + Recent High
7,056-7,069 – R2/R3 zone
7,100 – Round number target
Trading Implications:
You’re at the Value Area High edge – critical decision point
Break above 7,020 → Target 7,043
Break below 7,000 → Test 6,960 POC
Most likely: Consolidation between 6,960-7,043
Guest Posts:
Dan @ GTC Traders
The GTC Sample Portfolio … 2025 and 2026 … Part II
Last week we began to discuss the GTC Sample Portfolio’s performance. Both how we performed in 2025, and then how we are looking ahead to 2026. Previously, we looked at the overall portfolio performance.
The portfolio itself is comprised of three programs. This week, we will discuss the first third of the portfolio; the Equity Fixed Income Hybrid Core program. And again we will ask the question of how we performed in 2025 according to what we were looking for. And then our thoughts for 2026 specifically in reference to this program.
The Equity Fixed Income Hybrid Core in 2025
As we stated last week, we are looking for linearity, rather than absolute returns. And we have three programs, each designed to play a distinct role in achieving that linearity. So let’s talk about how we go about doing this. But first … how we performed in 2025 in this particular program.
The Equity Fixed Income Hybrid Core … is a name that is very much descriptive to the purpose of the program. Its objective? Reasonable income to the environment; via dividends and coupons; primarily using Equity instruments. However we do have a dash of Fixed Income products as well; for that purpose. And again, in this environment we are aiming for linear returns over absolute. Alpha is not the primary objective of the program. But as the name implies … this program in its construction is a bit of a ‘hybrid’. Because it can function as a ‘solid performance core’ to the remainder of the portfolio. So how did we do?
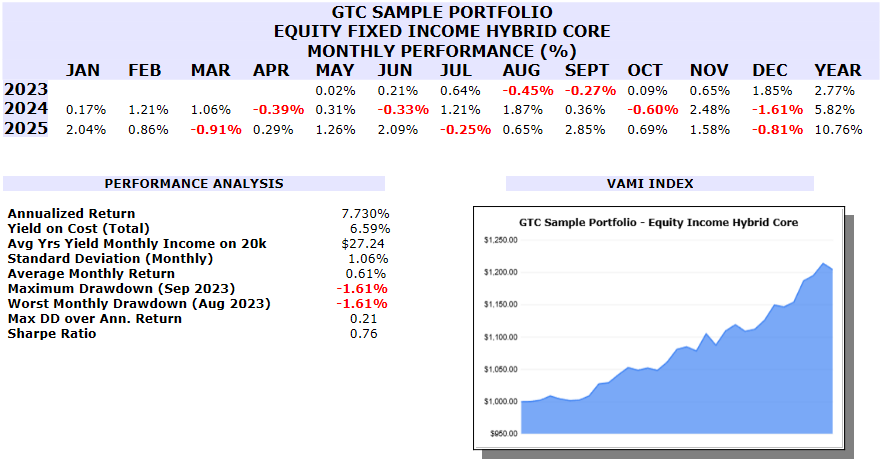
We would say that for 2025, all of those boxes are checked. Our yield on cost at this point is approximately 6.59% and growing, with an average yield of about 6.39% when examining all of the assets.
As we highlighted last week, an average trader has drawdowns that are 3x their annualized return. A good trader has drawdowns that are 2x their annualized return. An amazing trader has drawdowns that are 1x their annualized return.
The GTC Equity Fixed Income Hybrid Core returned 10.76%, and is annualizing 7.73%. Remember, the point here is not alpha. But simply a solid structural ‘core’ to the remainder of the portfolio. And our drawdowns? Over the nearly 3 years, the maximum drawdown was -1.61%. Only 0.21x of our annualized return. This can degrade just a bit in coming years. But to achieve that for the last 2 years and 7 months? We’ll take it.
So to review? We have yield. We have strong enough performance to serve as a structural core to the remainder of the portfolio. And we have world-class drawdowns in relation to our performance, so linearity is achieved.
And we plan to do the same in 2026, until such time that the overall macro ‘metrics’ shift on us.
Naturally, the question becomes: Yes, but how? What principles did we employ to achieve all of the above.
We will discuss that next.
Until next time, stay safe and trade well …
Market Recap:
IMPRO:Dboy:[4:22:54 PM]: I dont think I have ever seen a day like this
IMPRO:Dboy:[4:23:17 PM]: great example of the new world trading order
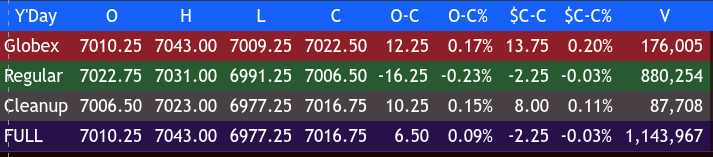
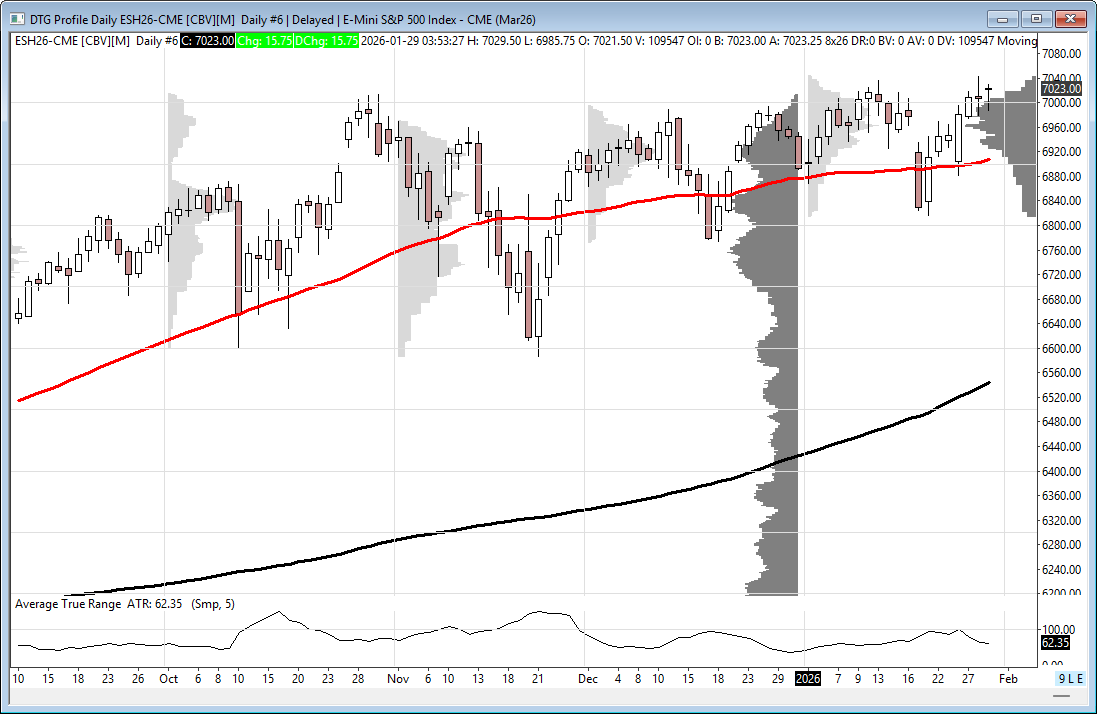
The ES traded up to a new all-time contract high on Globex at 7043.00, pulled back to 7018.50 with a total of 169k contracts traded, and opened Wednesday’s regular session at 7022.75.
After the open, the ES traded 7021.50, then rallied up to 7031.25 at 9:46, and dropped down to 7007.25 at 10:55. It then rallied up to 7015.50, sold off down to 6997.00 at 11:55, slowly rallied back up to 7009.00 at 12:20, and traded back down to a higher low at 6997.00 at 12:30. It chopped in a narrow range and then sold off down to 6989.50 at 2:00 after this Fed headline hit the tape:
FOMC redline: Changes as expected — economic activity changed to “solid” from “moderate”; job gains “remained low”; unemployment rate “shown some signs of stabilization.”
Biggest surprise: removal of language on “shift in balance of risks.”
After the drop, the ES rallied back up to 7013.00 at 2:30, sold off down to a higher low at 6991.25, then rallied up to 7015.00 at 3:15. It traded 7001.75 as the 3:50 imbalance showed $2.3 billion to sell, traded 6999.00, and then rallied up to 7013.00, trading 7000.50 on the 4:00 cash close.
After 4:00, the ES got totally whacked down to 6977.00 after TSLA beat, META fell after strong Q1 revenue, and MSFT also beat. The ES then ripped back up to 7023.00 at 4:30, started to pull back, and traded 7014.25, settling at 7007.25, down 1.25 points or -0.02%.
-
The NQ settled at 26,156.25, up 83.25 points or +0.32%
-
The YM settled at 49,167, up 8 points or +0.02%
-
The RTY settled at 2,667.70, down 14.50 points or -0.54% on the day
In the end, it was a rock-em, sock-em kind of day that took no prisoners. In terms of the ES’s overall tone, it swung from sell programs to buy programs, back to sell programs, and then flipped down before reversing up again after the earnings. In terms of overall trade, there were 788k ES contracts traded at 3:54. Total volume ended up at only 1.14M contracts.
The only things I can say are:
-
The 3:50 imbalance has been selling almost every day for months.
-
With gold up 1,193 points or +27.45% in January, and the dollar down 2.50 points or -2.53% in the last 8 sessions, the public is running scared.
On Tap Today
Scheduled Reports:
-
8:30 am: Initial jobless claims – Jan. 24
-
8:30 am: U.S. trade deficit (delayed report) – Nov.
-
8:30 am: U.S. productivity (revised) – Q3
-
10:00 am: Wholesale inventories (delayed report) – Nov.
-
10:00 am: Factory orders (delayed report) – Nov.
Earnings:
-
Apple (AAPL) reports after the bell
MiM
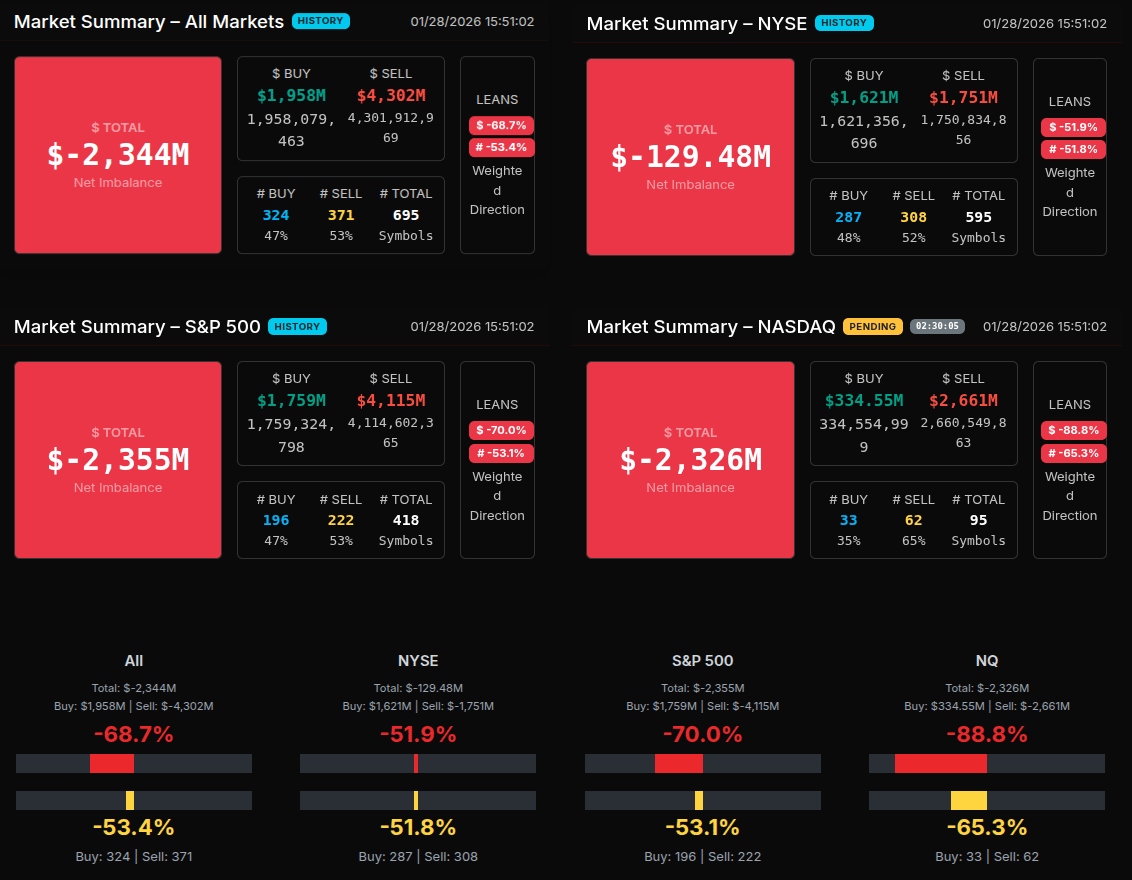
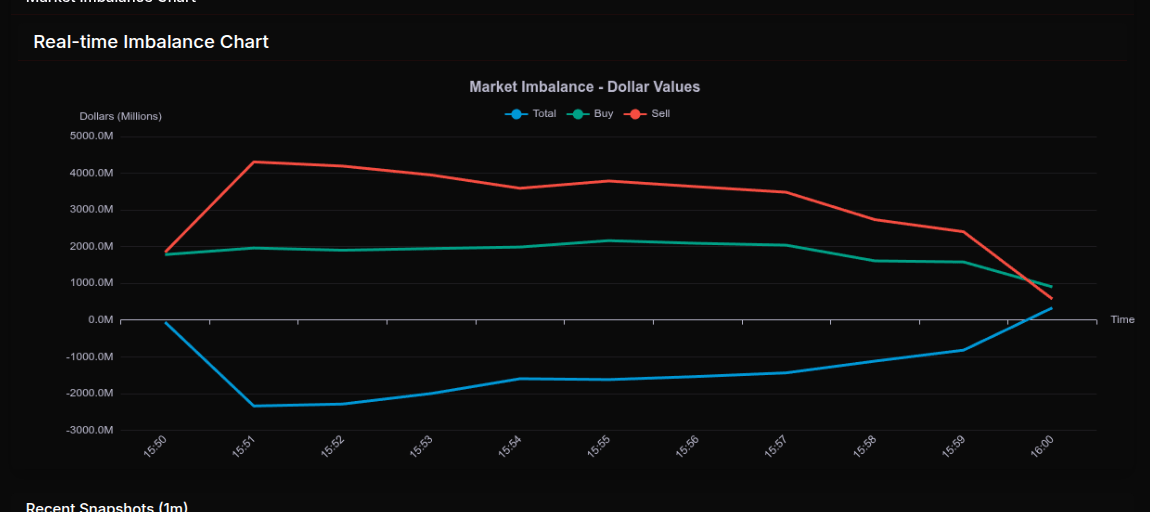
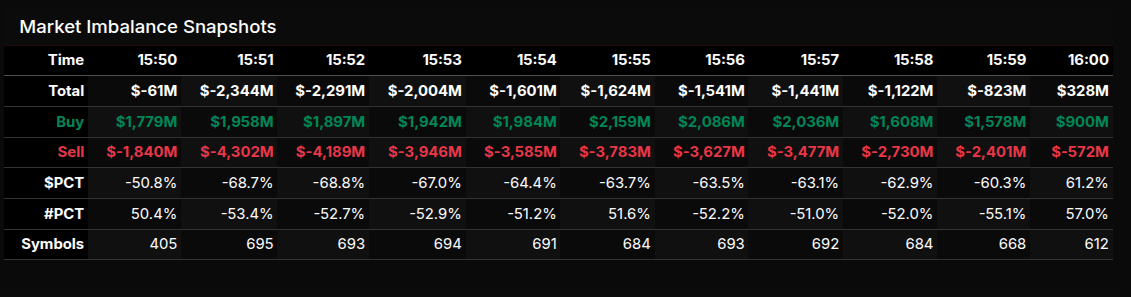
Market-on-Close imbalance data showed persistent sell-side pressure through most of the final 10 minutes, with total imbalance deeply negative until a sharp late offset into the close.
From 15:50 through roughly 15:59, sell programs dominated. Total imbalance reached a worst reading near -2.34B, with sell dollars consistently running roughly 2x buy dollars. The sell skew remained heavy even as total sell volume gradually tapered, indicating steady institutional distribution rather than panic liquidation.
The late window into 16:00 was notable. A rapid collapse in sell pressure combined with a drop in buy flow flipped the tape to a small positive net imbalance (+328M). This suggests either MOC offsetting, late index-related rebalancing, or dealer positioning into the close rather than a true directional buy signal.
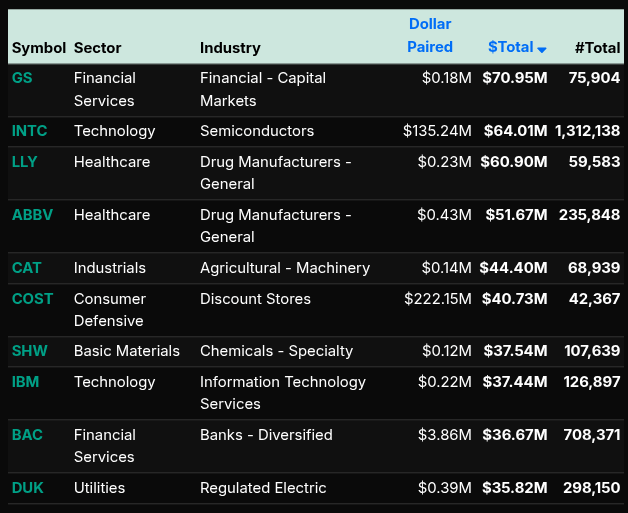
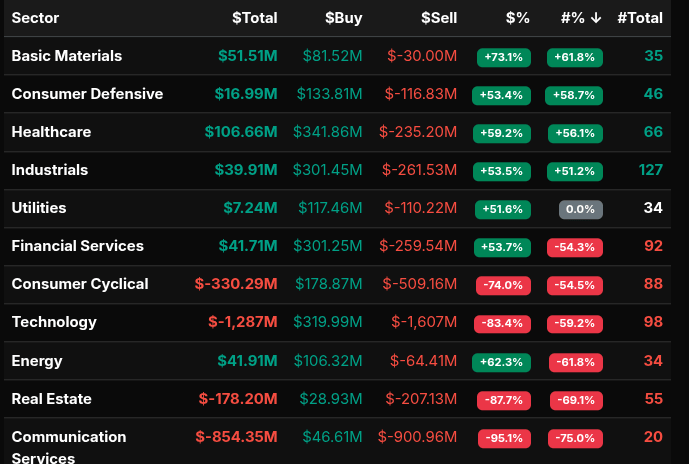
Sector-level flows reinforced a defensive and de-risking tone. Technology, Communication Services, and Consumer Cyclical absorbed the largest net selling, with Technology alone exceeding -1.2B. In contrast, Healthcare, Financials, Industrials, and Energy showed relative resilience with modest net inflows, pointing to rotation rather than broad risk-on behavior.
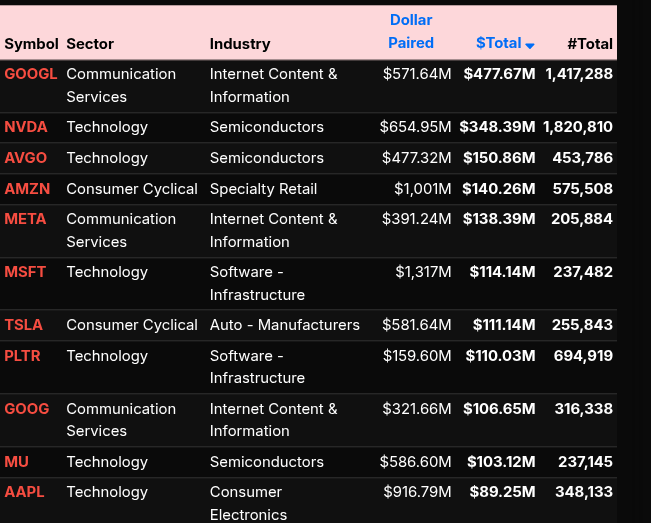
Single-name concentration mattered. GOOGL, NVDA, AMZN, META, and MSFT accounted for a disproportionate share of gross activity, but the net effect remained negative, especially across high-beta tech. The NASDAQ finished with the weakest weighted imbalance, reinforcing that growth and momentum names were the primary source of pressure.
Bottom line: the session closed with heavy institutional sell flow that only mechanically improved at the bell. The late flip should be treated as positioning noise, not confirmation of demand. Until buy dollars expand earlier in the closing window, this remains a sell-dominated tape with rotation into defensives rather than outright accumulation.
Technical Edge
Fair Values for January 29, 2026
-
S&P: 27.57
-
NQ: 120.82
-
Dow: 132.52
Daily Breadth Data 📊
For Wednesday, January 28, 2026
-
NYSE Breadth: 38% Upside Volume
-
Nasdaq Breadth: 48% Upside Volume
-
Total Breadth: 47% Upside Volume
-
NYSE Advance/Decline: 39% Advance
-
Nasdaq Advance/Decline: 36% Advance
-
Total Advance/Decline: 37% Advance
-
NYSE New Highs/New Lows: 220 / 55
-
Nasdaq New Highs/New Lows: 319 / 137
-
NYSE TRIN: 0.94
-
Nasdaq TRIN: 0.59
Weekly Breadth Data 📈
For the Week Ending Friday, January 23, 2026
-
NYSE Breadth: 53% Upside Volume
-
Nasdaq Breadth: 55% Upside Volume
-
Total Breadth: 54% Upside Volume
-
NYSE Advance/Decline: 50% Advance
-
Nasdaq Advance/Decline: 51% Advance
-
Total Advance/Decline: 51% Advance
-
NYSE New Highs/New Lows: 437 / 76
-
Nasdaq New Highs/New Lows: 742 / 335
-
NYSE TRIN: 0.86
-
Nasdaq TRIN: 0.83
BTS Levels:
ESH2026
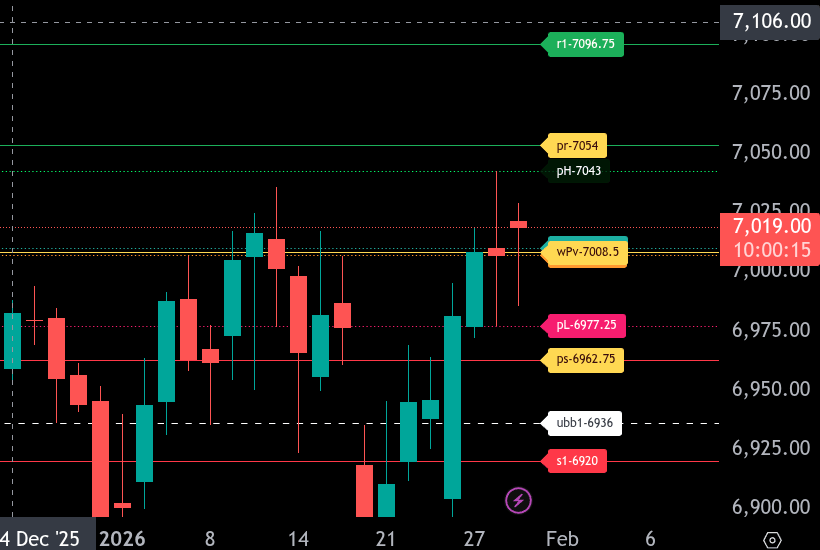
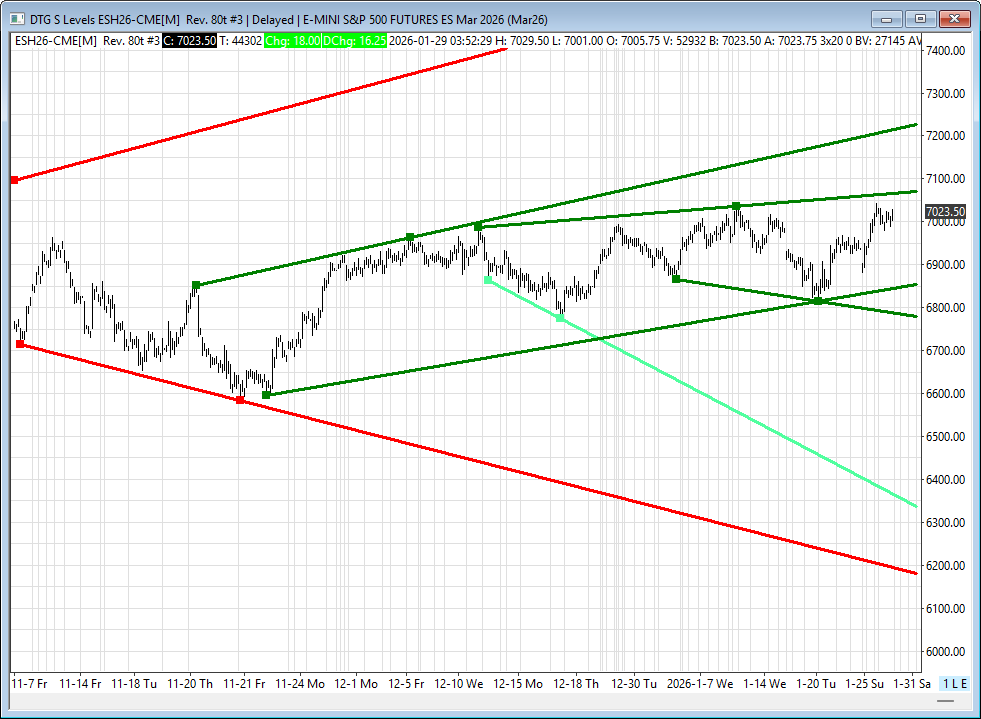
The bull/bear line for the ES is at 7008.50. This remains the key pivot for directional control. Acceptance above this level keeps the tone constructive, while failure to hold it shifts focus back to downside rotation.
Price is currently trading near 7019.50, holding above the bull/bear line after a strong upside impulse. As long as ES holds above 7008.50, buyers remain in control and pullbacks into this zone can be responsive.
On the upside, initial resistance sits near 7043.00, followed by 7054.00 as the upper intraday range target. A clean push through 7054.00 opens the door toward 7096.75, which represents higher timeframe resistance and a potential exhaustion area.
If price loses 7008.50, downside targets come in at 6977.25 and then 6962.75, which is the lower range target. A failure there would expose 6936.00 and potentially 6920.00 if liquidation pressure builds.
Overall, the structure favors continuation higher while above 7008.50, but the market is extended from the overnight low. Expect two‑way trade unless ES can accept above 7043.00 with volume.
NQH2026
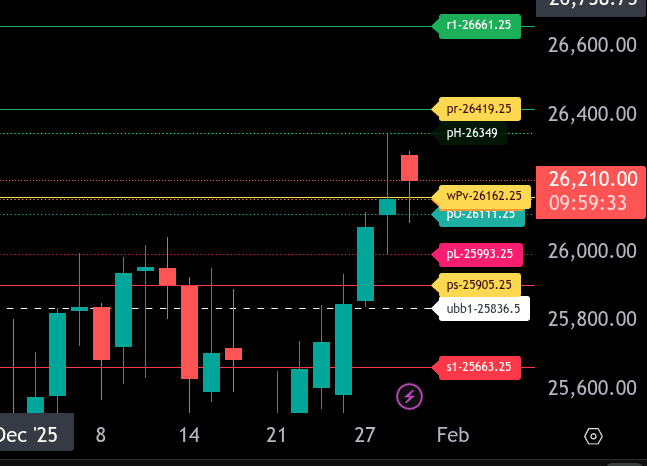
The bull/bear line for the NQ is at 26,162.25. This level is the pivot for today’s bias and separates acceptance of higher prices from a failed breakout scenario.
Price is currently trading near 26,210, above the bull/bear line after a strong vertical expansion from the 25,900s. Holding above 26,162.25 keeps the short-term structure constructive, but momentum is now extended and vulnerable to rotation.
Immediate resistance sits at 26,349, followed by the upper range target near 26,419.25. Acceptance above 26,349 opens the door for continuation toward the upper range at 26419.25, but expect two-sided trade unless volume expands.
Support is layered at 26,111.25 and then 26,000. A failure back below 26,162.25 shifts focus to these levels as responsive buyers are expected. Below 26,000, risk increases for a deeper rotation toward 25,905.25 and potentially 25,663.25.
Overall, the trend remains bullish above 26,162.25, but the sharp impulse higher suggests patience is required. Best trade location favors pullbacks into support rather than chasing strength.
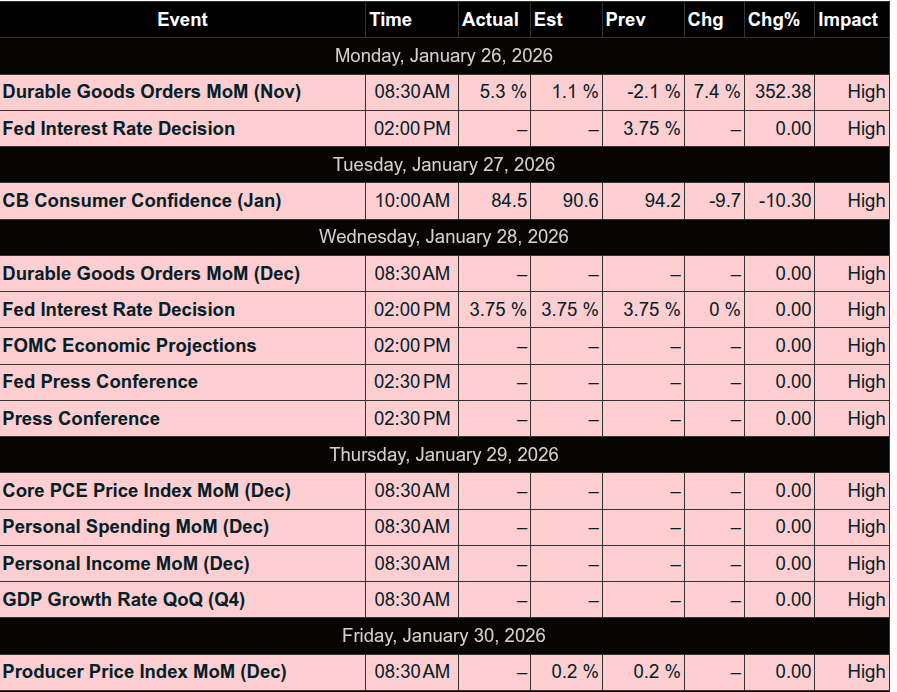
Economic Calendar Today
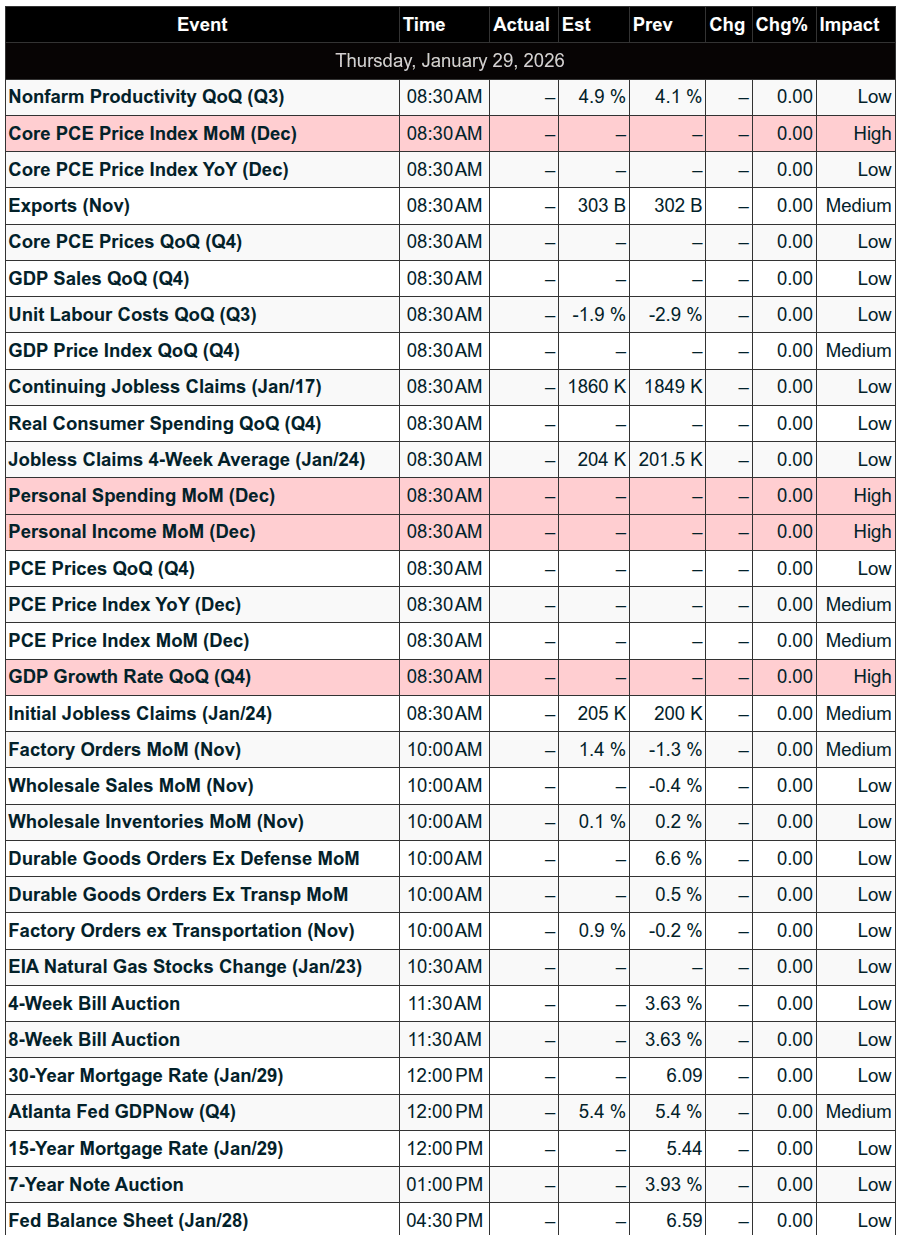
This Week’s High Importance
Earnings:
Recent
Trading Room News:
PTG Room Summary – Wednesday, January 28, 2026
The day opened with a strong strategic framework provided by Manny, outlining multiple actionable trade levels on ES, including support buys, resistance sells, breakdowns, and LB&F traps—giving traders a comprehensive roadmap.
Morning Session:
-
Crude Oil opened with a strong push higher, catching attention early.
-
The market rallied early, with members noting strength and pain for shorts.
-
PTGDavid initiated a trade using the A10 strategy, which triggered and hit its stop trail, confirming good execution for those aligned. Some members (like PeterN) reviewed configuration differences on A10 execution (RSPR vs. Limit).
-
The market moved into a Morning After Trend Day (MATD) structure, with volatility aligning with expected patterns.
-
Emphasis from David: “Play your plan – do not just chase moves.” A key reminder amid choppy action.
Midday Developments:
-
Price tested and backtested the LIS (7010) level, which became the key pivot for the day. David highlighted this as the “Battle Line”, where bulls needed to defend.
-
Bear case was clearly outlined: failure to hold above 7010 ±5 could open downside targets to 6995 → 6985 → 6975.
-
Indeed, this scenario played out later, validating the importance of that pivot level. 6995 target was fulfilled, confirming the rotation/reset narrative.
-
Technical chart sharing and community confirmations kept everyone aligned, despite minor tech hiccups (some reported frozen charts).
FOMC Announcement:
-
At 2:00 PM, the Fed kept rates unchanged (10-2 vote).
-
Language shifted in the statement: economic activity upgraded to “solid”, some signs of labor stabilization, and notably, the removal of language about “balance of risks”—interpreted as slightly hawkish.
-
Market response was muted during the presser (JPOW described as a “non-event” by David), but the USD firmed and yields rose modestly, in line with UBS’s interpretation of a hawkish tilt.
Afternoon / Close:
-
The market exhibited Cycle Day 2 consolidation behavior—typical balancing action with both upper and lower DTS targets fulfilled.
-
David confirmed: “Pullback on Cycle Day 2 consolidation…normal…Tomorrow’s Cycle Day 3 will be key.”
-
Closing imbalance showed $2.3B MOC sell, suggesting institutional pressure into the close.
-
Commentary on Gold spiking $300 added some macro flavor, though David kept focus on equities.
Positive Trade Outcomes & Lessons Learned:
-
A10 setup was a success for those configured properly—highlighting the importance of platform alignment and understanding execution types.
-
LIS 7010 as a critical pivot proved valuable. Traders who respected the south-of-7010 bear scenario were rewarded as downside targets hit.
-
Playing the plan vs. chasing was repeatedly emphasized and validated—those with discipline avoided chop and got cleaner entries at tested levels.
-
Manny’s pre-market trade plan gave multiple solid zones that played out well depending on timing and flow confirmation.
Summary: A well-structured day with both sides of the market offering opportunity. Despite some slow stretches, the session was a great reminder of the value in preparation, technical discipline, and respecting key inflection points. Today’s Cycle Day 3 sets up for potential continuation or reversal—traders should stay nimble.
DTG Room Preview – Thursday, January 29, 2026
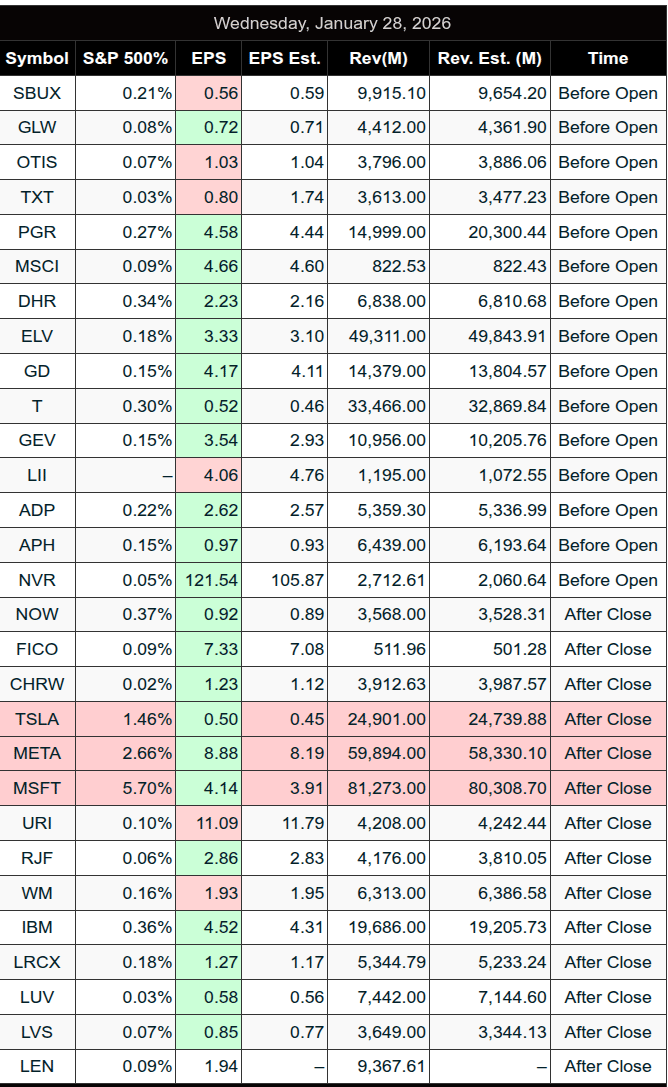
U.S. equity futures are higher, retracing Wednesday’s full session range, following mixed earnings from key tech names and the Fed’s rate hold.
Earnings Recap:
-
Meta (META) surged 10% post-earnings on upbeat AI-spending guidance ($135B), boosting sentiment.
-
Tesla (TSLA) rose 2%, despite steep annual earnings declines (-46% YoY). Musk shifted focus from EVs to humanoid robots and “robotaxis.”
-
Microsoft (MSFT) fell 7% on slower cloud growth and higher capex, despite record $51.5B cloud revenue. RPOs topped $625B, with 45% tied to OpenAI.
-
Amazon (AMZN) slipped in sympathy with MSFT. Apple (AAPL) reports after the bell.
Fed Update:
As expected, the Fed held rates steady. Powell reinforced a data-dependent, meeting-by-meeting stance. FedWatch still sees two cuts in 2026.
Economic Data Today (8:30am ET):
-
Unemployment Claims
-
Non-Farm Productivity (delayed)
-
Unit Labor Costs
-
Trade Balance
-
(10:00am) Factory Orders, Wholesale Inventories
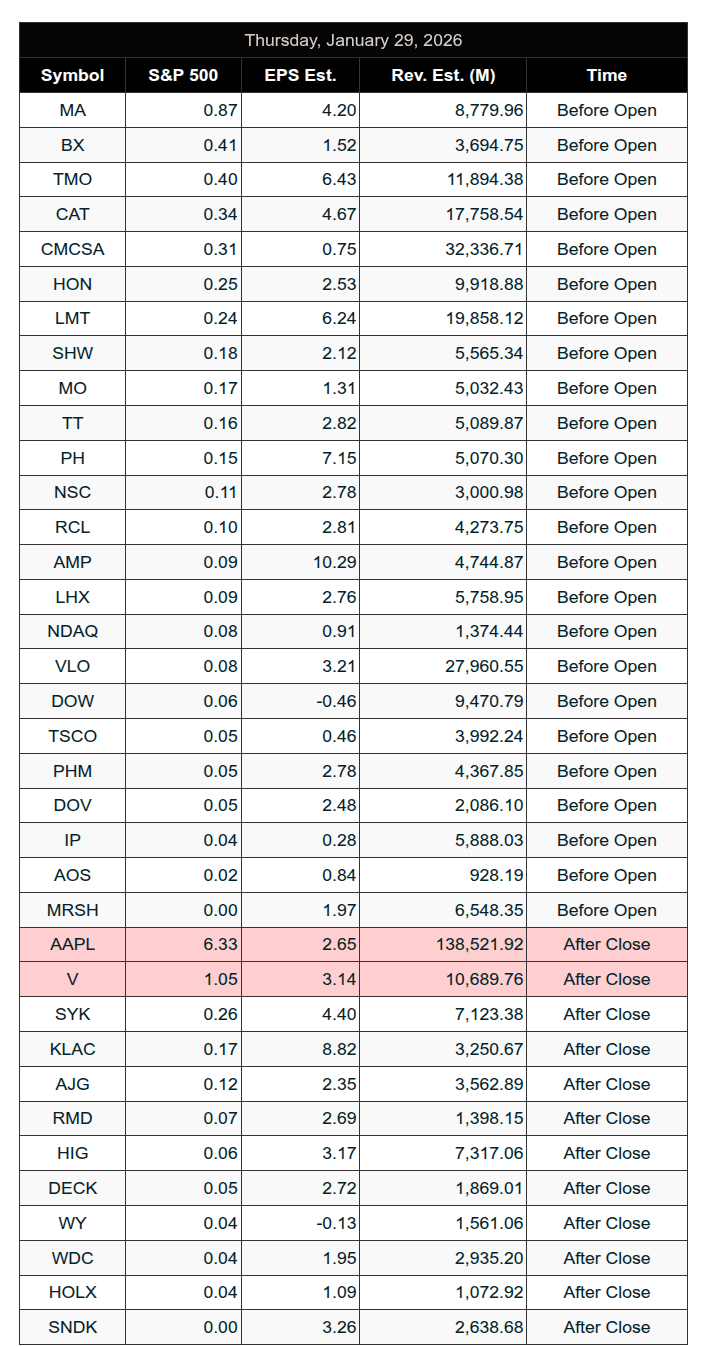
Earnings Calendar:
-
Premarket: CAT, CMCSA, MA, HON, LMT, VLO, and others.
-
After-hours: AAPL, V, DECK, SYK, WDC.
-
Friday AM: AXP, CVX, XOM, VZ, CL.
Market Technicals – ES Futures:
-
Volatility remains low; 5-day ADR at 65.5.
-
Price is under trendline resistance at 7066/71s, with upper target at 7227/32s.
-
Support levels: 6854/49s, 6782/77s, 6175/70s.
-
Whale flow shows bullish lean into the open on increased overnight volume.
Affiliate Disclosure: This newsletter may contain affiliate links, which means we may earn a commission if you click through and make a purchase. This comes at no additional cost to you and helps us continue providing valuable content. We only recommend products or services we genuinely believe in. Thank you for your support!
Disclaimer: Charts and analysis are for discussion and education purposes only. I am not a financial advisor, do not give financial advice and am not recommending the buying or selling of any security.
Remember: Not all setups will trigger. Not all setups will be profitable. Not all setups should be taken. These are simply the setups that I have put together for years on my own and what I watch as part of my own “game plan” coming into each day. Good luck!
This post goes out as an email to our subscribers every day and is posted for free here around 2 PM ET. To get your real-time copy, sign up for the free or premium version here: Opening Print Subscribe.
Comments are closed