This post goes out as an email to our subscribers every day and is posted for free here around 2 PM ET. To get your real-time copy, sign up for the free or premium version here: Opening Print Subscribe.
Follow @MrTopStep on Twitter and please share if you find our work valuable!
FREE Two-Week Offer for the Opening Print Premium. Open up the Lean and other premium features for the next Two Weeks!
Our View
The first low of the sell-off was the exact level I put out at the 7120 level, and the last low was 7085.00. If I said I knew where this is going or that there is an assured solution, I would be lying, and so would everyone else. Take this headline that came out last night:
“IRAN’S PARLIAMENT SPEAKER GHALIBAF’S ADVISOR: TRUMP’S DECISION TO EXTEND THE CEASEFIRE MAKES NO SENSE. THE CEASEFIRE EXTENSION IS AN ATTEMPT TO BUY TIME FOR A SURPRISE ATTACK. IRAN CURRENTLY HOLDS THE INITIATIVE.”
In all honesty, I have never posted or written about more headlines in the entire 30 years that I have been writing the Opening Print, and the sad thing is, I don’t think it’s going to change anytime soon. The new normal has become… there is no more normal.
Our Lean
I think everything comes down to one small three-letter word: OIL. If it goes up, stocks, gold, and Bitcoin go down—and so does the U.S. Dollar Index ($DXY), which has fallen 12 out of the last 16 sessions with only 3 sessions up and one unchanged. After trading up to 100.64 on 03/31, it has fallen to 97.63 as of 04/17.
The UAE has warned the U.S. that it may switch oil sales from the dollar to the Chinese yuan if regional conflicts, specifically the war with Iran, cause a shortage of dollar liquidity. This pivot highlights a push to diversify trade currency and a potential challenge to the US petrodollar, with UAE officials seeking financial safety nets from the U.S. I don’t know what to think, but it clearly looks like the US is losing friends fast.
Our lean: We could be getting to the point where Trump’s headlines just become a big fad. Had he not posted about extending the ceasefire, the US was heading toward a very weak close. I am not going to BS; I had one of my worst trading days in months.
I really thought there was going to be a big rally late yesterday, and it went my way, but when oil started going up and the ES started tumbling, I didn’t get out and add, then blew out, and the ES broke 7100.
I was working on a 7139 offer and the ES traded up to 7138.50 and then broke 53.5 points down to 7085. The way I see this is exactly like I said above: the ball is in Iran’s court, and the more Trump TACOs, the weaker the US looks.
My view is the ES and NQ are not out of the woods and, while I hate to say this, I think today (especially if oil rallies) it could be an ES / NQ “sell the rips” day.

If you’ve ever wanted to learn about trading and hedging in the ags, or sharpen your trader’s mindset, this is where you need to be today at noon.
We’re excited to introduce our newest contributors as they debut a brand new show on the PitbullTraders YouTube stream.
Join us live at 12 pm ET — either in our Pit trading room or on our YouTube channel. Don’t miss it.
Don’t have access to our Pit room? Membership is free!
Market Recap
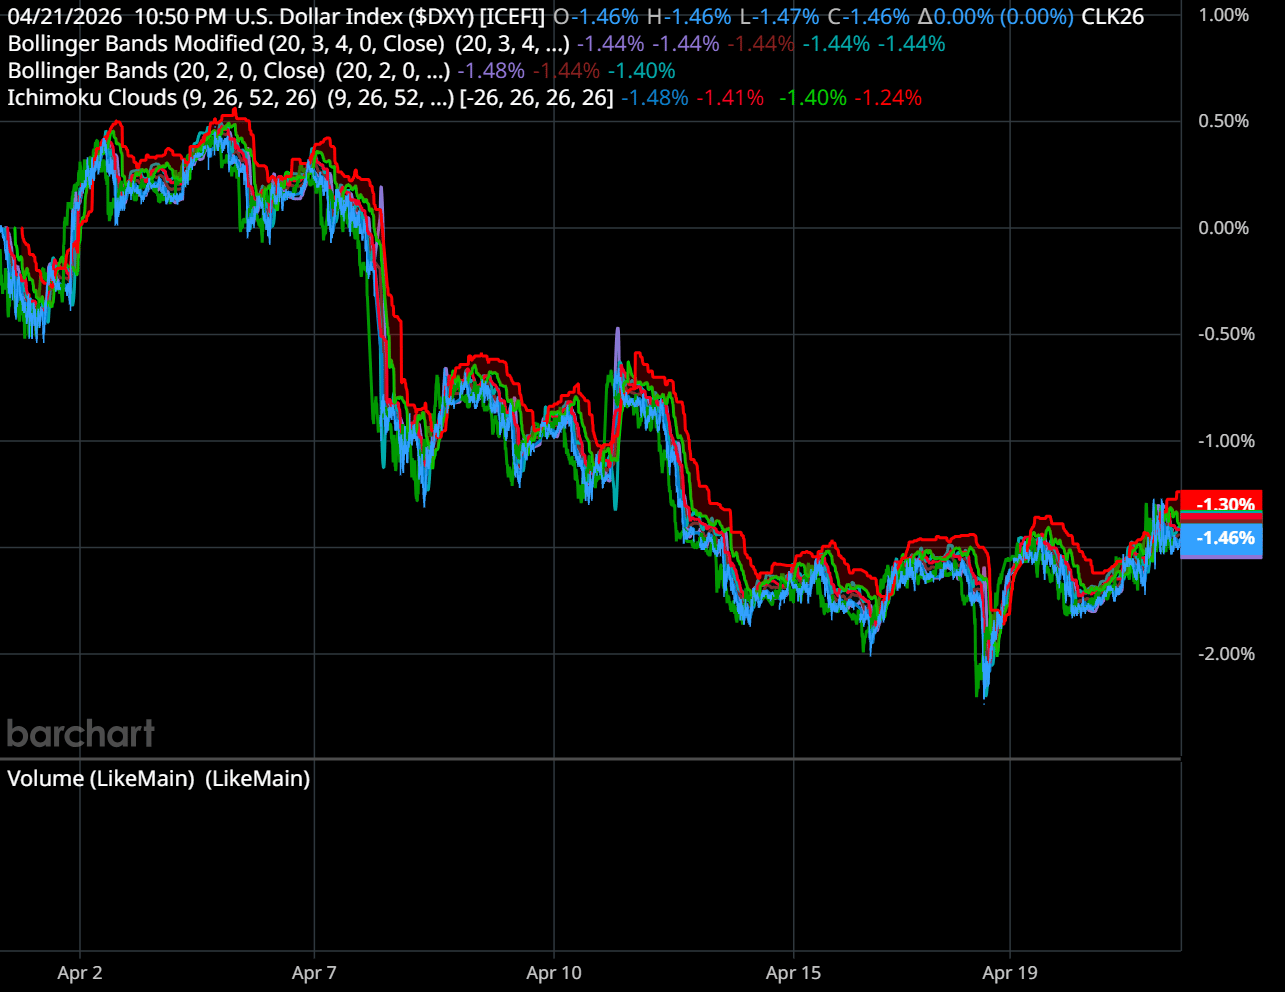
DXY (Dollar Index) Last 16 Sessions: Down 12, Up 3, 1 Unchanged
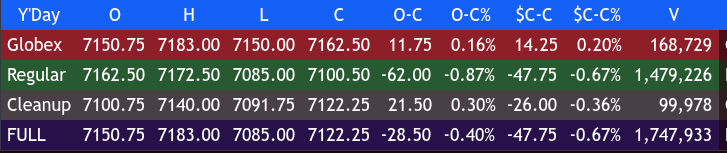
The ES popped up to 7183.00 on Globex and traded at 7162.50 on the 9:30 ET regular session open, up 14.25 points or +0.20% on the day.
After the open, the ES traded at 7164.00, sold off 17 points down to 7147.00, rallied 25.5 points back up to the opening price at 7162.50 at 10:15, and then sold off 41.75 points down to 7120.75 after a headline hit that the US boarded a tanker in the Gulf.
It then rallied 20.75 points up to 7141.50 at 11:15, sold off 22.25 points down to a new low at 7119.25 at 11:35, rallied up to 7138.25 at 11:45, and sold off 41.7 points down to 7096.55 at 12:00.
Curiously, it trended lower to 7033.25 at 1:40, then rallied up to a lower high of 7105.50 at 2:15 as crude oil started to rise, rallied up to 7138.50 at 3:30, and sold off down to the day’s low at 7085.00 at 3:45 after a headline hit saying the US halted negotiations.
It traded at 7099.00 as the 3:50 cash imbalance showed $2.6 billion to buy, rallied up to 7107.00, sold off down to 7092.50, rallied up to 7103.50 at 3:49, and traded 7100.50 on the 4:00 cash close.
After 4:00, the ES traded down to 7091.75 at 4:05 and then rallied 48.25 points up to 7140.00 after Trump “TACO’ed”, extending the ceasefire until Iran submits its proposal. It sold off down to 7118.25 at 4:45 and settled at 7122.25, down 25.75 points or -0.36%.
The NQ settled at 26,721.25, down 27.50 points or -0.10%. The YM settled at 49,487.00, down 152 points or -0.31%, and the RTY settled at 2,788.80, down 15.60 points or -0.56% on the day.
In the end, the on-again, off-again US/Iran negotiations and associated headlines, coupled with rising oil, wore the ES and NQ down. In terms of the ES and NQ’s overall tone, they sold off but held the zone I posted from 7120 down to 7083. In terms of the ES’s overall trade, volume was higher at 1.75 million contracts traded.
I’m not going to do any rebuttal; it is what it is. Trump is off his rocker; I still think Iran has the upper hand in the negotiations and has been calling Trump’s bluff. There are no scheduled economic reports, but there are some big earnings out.
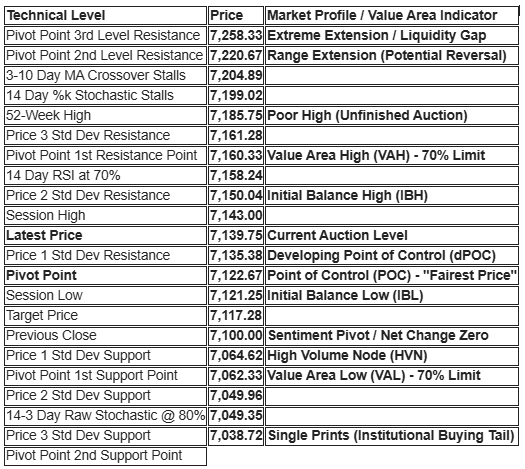
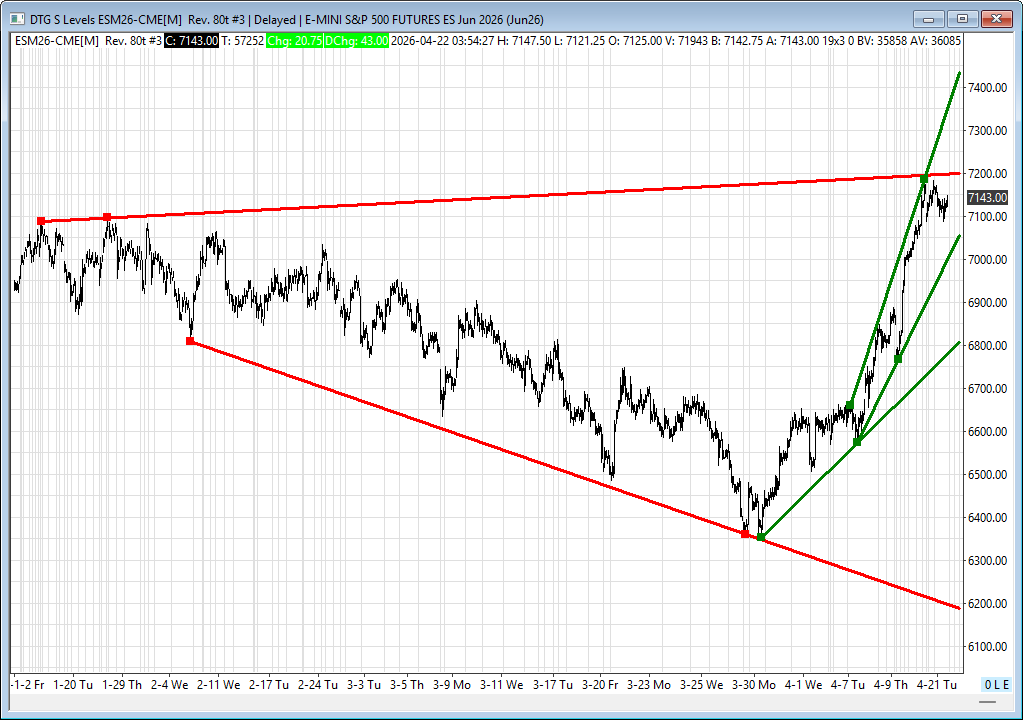
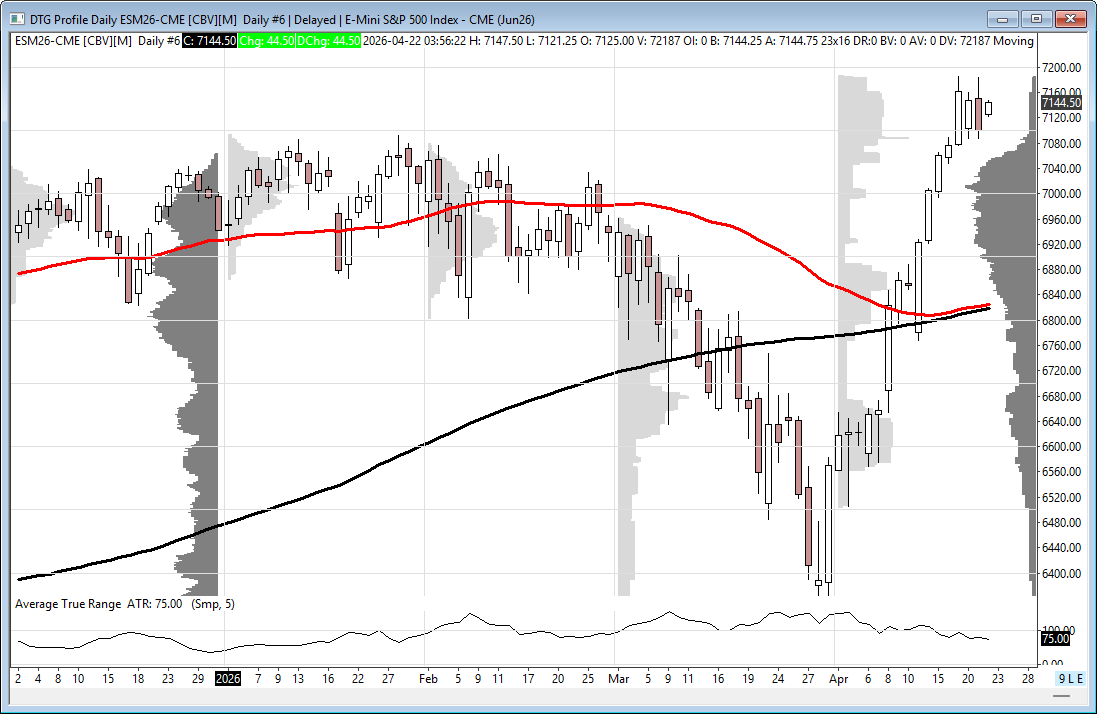
Enhanced Technical Map: Market Profile & Value Areas
This map integrates your S&P 500 E-Mini Jun ’26 (ESM26) technical levels with advanced Market Profile structures.
Guest Posts
Guest Posts — Polaris Trading Group
🎯 @ES Scenarios in Play
🟢 Bull Case — Buyers Stabilize & Reclaim
Acceptance Above: 7125 ±5
Upside Objectives
-
7140
-
7145
-
7155
This signals responsive buying evolving into initiative control.
⚠️ But remember:
This is recovery mode — not dominance yet.
🔴 Bear Case — Continued Rotation / Controlled Reset
Acceptance Below: 7125 ±5
Downside Objectives
-
7115
-
7105
-
7095
This is not panic selling —
This is an orderly distribution… the kind that grinds traders down.
📊 Key Reference Levels
-
PVA High Edge: 7139
-
PVA Low Edge: 7099
-
Prior POC: 7126
👉 Important:
These levels cluster tightly — forming a decision zone, not noise.
⚠️ Tactical Takeaway
Of course, nothing changes for PTG…Simply follow your plan. Take only Triple A setups and manage the $risk. ALWAYS HAVE HARD STOP-LOSSES in-place on the exchange.
PTG’s Primary Directive (PD) is to ALWAYS STAY IN ALIGNMENT with the DOMINANT FORCE.
S&P 500 (ES)
— PTG
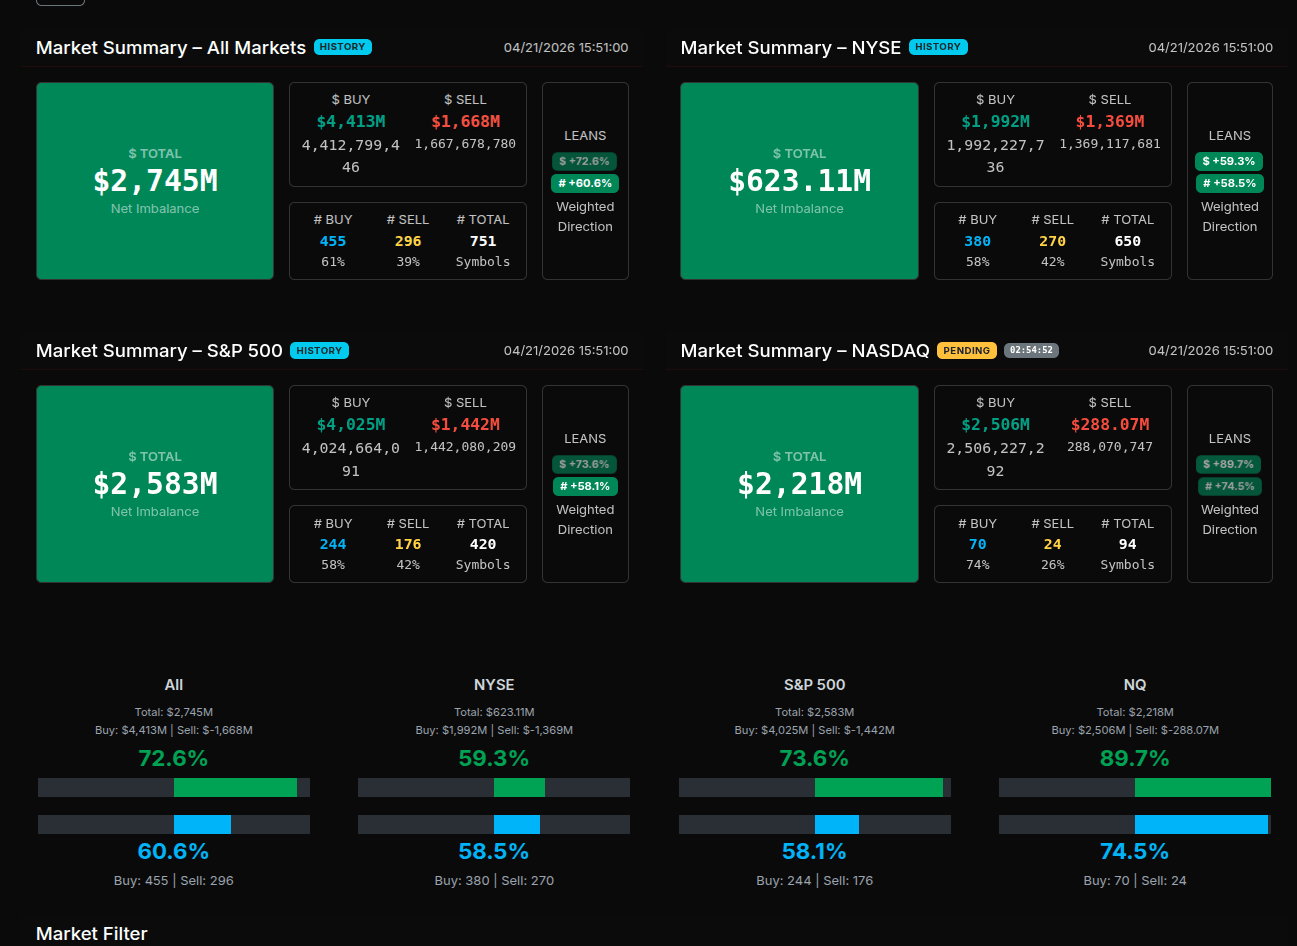
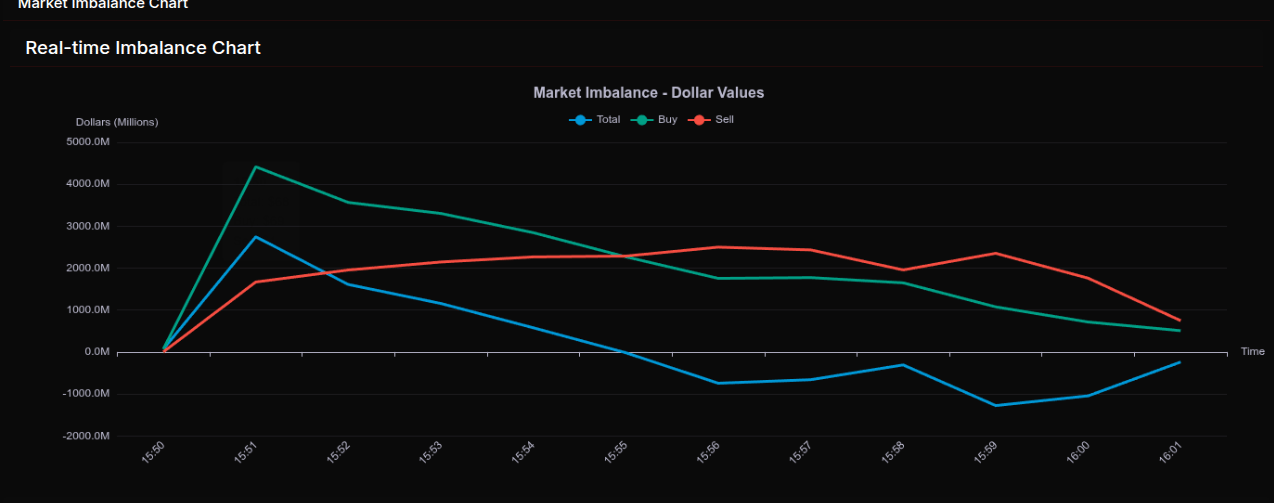
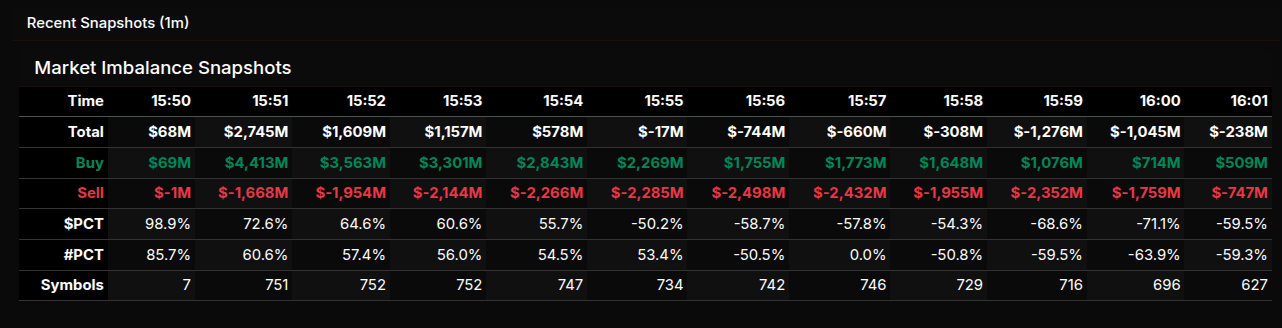
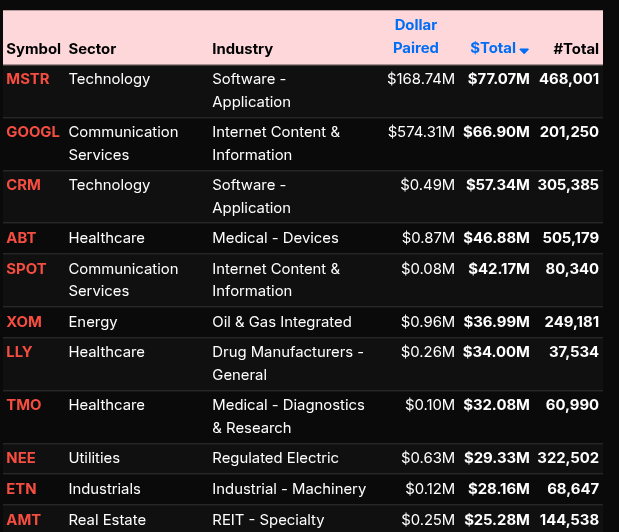
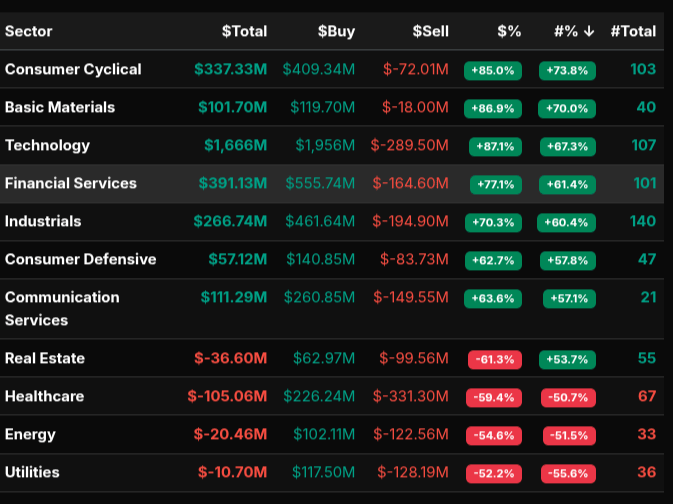
MOC Recap
The MOC session opened with an aggressive buy-side imbalance that quickly set the tone for the close. At 15:50, the market showed a near one-sided condition with a +98.9% lean, signaling broad institutional demand. This early push expanded rapidly into 15:51, where total imbalance surged to +$2.7B, driven by strong participation across roughly 750+ symbols. The buy pressure was not only large in notional terms but also widespread, with buy-side percentages consistently above 60%, confirming a strong opening auction dynamic rather than isolated flows.
As the session progressed, the imbalance began to rotate lower. From 15:52 through 15:54, the market maintained positive territory but with steadily declining strength, transitioning from +64.6% to +55.7%. This drift indicated a shift from aggressive accumulation to more two-sided activity. By 15:55, the tone fully flipped, with the imbalance crossing into negative territory (-50.2%), marking a clear rotational pivot rather than a continuation.
The sell-side pressure intensified in the final minutes. Notably, at 15:59 and 16:00, the market printed -68.6% and -71.1% respectively—both exceeding the -66% threshold, highlighting wholesale sell programs hitting the tape. This shift suggests institutional repositioning into the close rather than simple profit-taking.
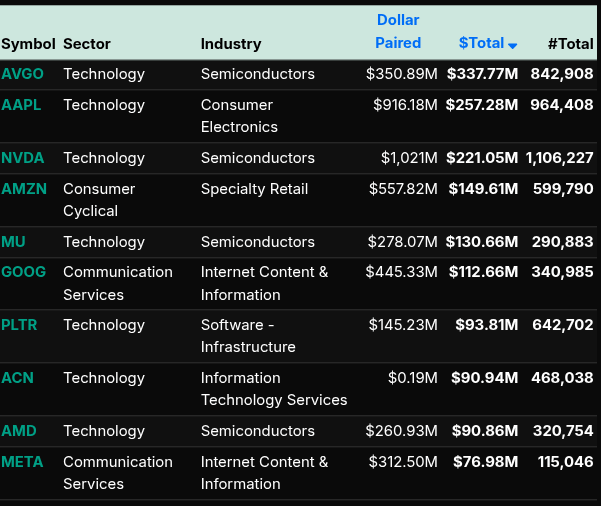
Sector-wise, Technology dominated the activity throughout the session. Names like NVDA, AAPL, AVGO, AMD, and MU led the flow, alongside Communication Services (GOOG, META) and Consumer Cyclical (AMZN). The consistency across mega-cap tech indicates index-driven flows, particularly within the Nasdaq, which showed the strongest lean at +89.7% earlier in the session.
In summary, the MOC displayed a classic transition: strong buy imbalance at the open, gradual rotation mid-session, and decisive sell-side control into the close. The presence of extreme leans on both sides reinforces the idea of institutional rebalancing, with tech acting as the primary vehicle for execution.
Technical Edge
Fair Values for April 22, 2026:
-
SP: 34.32
-
NQ: 149.13
-
Dow: 173.91
Daily Breadth Data 📊
For Tuesday, April 21, 2026
• NYSE Breadth: 29% Upside Volume
• Nasdaq Breadth: 37% Upside Volume
• Total Breadth: 35% Upside Volume
• NYSE Advance/Decline: 28% Advance
• Nasdaq Advance/Decline: 29% Advance
• Total Advance/Decline: 28% Advance
• NYSE New Highs/New Lows: 158 / 13
• Nasdaq New Highs/New Lows: 318 / 79
• NYSE TRIN: 0.88
• Nasdaq TRIN: 0.66
Weekly Breadth Data 📈
For the week ending Friday, April 17, 2026
• NYSE Breadth: 64% Upside Volume
• Nasdaq Breadth: 72% Upside Volume
• Total Breadth: 69% Upside Volume
• NYSE Advance/Decline: 76% Advance
• Nasdaq Advance/Decline: 80% Advance
• Total Advance/Decline: 79% Advance
• NYSE New Highs/New Lows: 284 / 59
• Nasdaq New Highs/New Lows: 710 / 264
• NYSE TRIN: 1.70
• Nasdaq TRIN: 1.53

If you’ve ever wanted to learn about trading and hedging in the ags, or sharpen your trader’s mindset, this is where you need to be today at noon.
We’re excited to introduce our newest contributors as they debut a brand new show on the PitbullTraders YouTube stream.
Join us live at 12pm ET — either in our Pit trading room or on our YouTube channel. Don’t miss it.
Don’t have access to our Pit room? Membership is free!
Trading Room Summaries
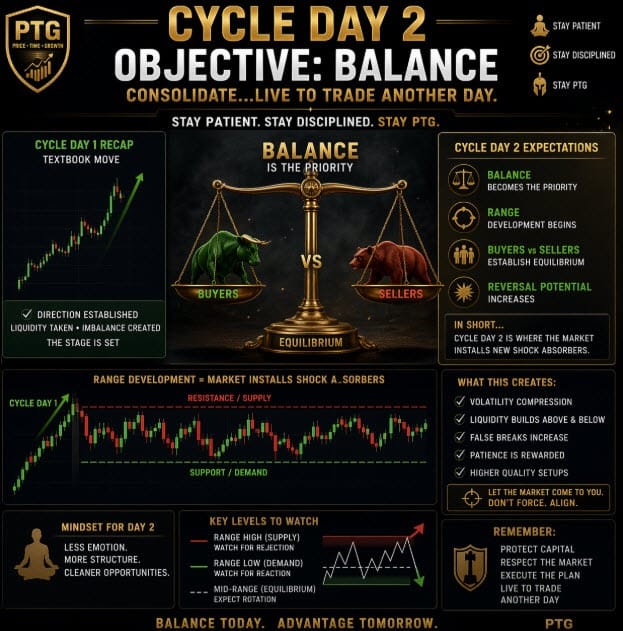
Polaris Trading Group Summary – Tuesday, April 21, 2026
Tuesday was a textbook Cycle Day 1 (CD1) decline that played out exceptionally clean, with strong adherence to PTG levels and projections. The day offered multiple high-probability opportunities, especially on the short side.
Morning – Plan Comes to Life
-
The session started with confirmation of the upper target zone (7175–7185) being fulfilled from the prior DTS plan — a great example of prep work paying off early.
-
David immediately set the tone with a “sell lean” bias, emphasizing:
-
Watch for failure below prior close
-
Or reclaim and test higher (decision levels clearly defined)
-
-
Key observation from the room:
-
NQ made new highs while ES did not → early divergence = weakness signal.
-
Mid-Morning – D Level Precision & Reversal
-
Price interacted cleanly with D Levels, especially around ~7171:
-
Multiple touches confirmed structure
-
Led to a sharp reversal (“cliff drop”)
-
-
Traders identified:
-
Gap closure area (~86)
-
Potential PKB setup
-
Strong squeeze dynamics in equities
-
-
Sentiment in the room reflected confidence:
-
“Snapped up”
-
“Life is simple with D Levels”
-
Lesson: Trust the levels. Reactions at D Levels continue to be highly reliable when combined with structure and confirmation.
Late Morning – Targets Hit Methodically
-
David officially called:
-
Cycle Day 1 Decline
-
Bear case acceptance below ~7150
-
-
Downside targets:
-
7140 → 7130 → 7120
– All fulfilled cleanly
-
-
Follow-through:
-
CD1 Average Decline Target (7120) hit
-
Continued extension to 7107.50 (projected target fulfilled)
-
Major takeaway:
This was a model CD1 trend day, where:
-
Bias was clear early
-
Structure held
-
Targets were respected sequentially
Afternoon – Headlines & Volatility Expansion
-
Market tone shifted further with geopolitical headlines (Iran, Vance news):
-
Triggered increased volatility and risk-off behavior
-
Reinforced downside pressure
-
-
David emphasized:
-
“Another Range Runner Reversal Day”
-
Volatility remains robust
-
End of Day – Flush & Completion
-
Classic “shake n bake” into the close:
-
Position squaring
-
Acceleration toward lows
-
-
Key levels:
-
Prior Low 7085 tested and tagged perfectly
-
-
Closing notes:
-
MOC Buy Imbalance ($1.7B) but did not negate bearish structure
-
Day finished near lows
-
Bottom Line
This was a high-quality trend day with excellent technical respect. Traders who trusted:
-
The early sell bias
-
The D Level rejection
-
And the CD1 roadmap
…had multiple opportunities to capture a clean, directional move lower.
A great example of PTG methodology working exactly as designed.
Discovery Trading Group Room Preview – Wednesday, April 22, 2026
Macro focus: US-Iran ceasefire extension, Fed Chair nomination (Warsh), and heavy earnings slate
Geopolitics:
-
Trump extended ceasefire with Iran indefinitely despite stalled talks
-
Mixed messaging: prior threats of military action vs. current extension
-
Iran signaling negotiations possible if US lifts blockade, but conflicting reports
Fed / Policy:
-
Warsh confirmation uncertain; Sen. Tillis blocking pending Powell investigation resolution
-
Democrats oppose moving forward amid ongoing probe into Powell
-
Trump administration continuing pressure around Powell investigation
Earnings:
-
Premarket: AT&T, Boeing, Philip Morris, Southwest, Vertiv, others
-
After close: Tesla, IBM, Texas Instruments, ServiceNow, Lam Research, others
-
Thursday: American Express, Blackstone, Comcast, Honeywell, Lockheed Martin, NextEra, Union Pacific, others
Economic data: Light calendar; Crude Oil Inventories at 10:30 am ET
Market conditions:
-
Volatility elevated (ES 5-day ADR ~80 points)
-
Overnight whale flow leaning bullish
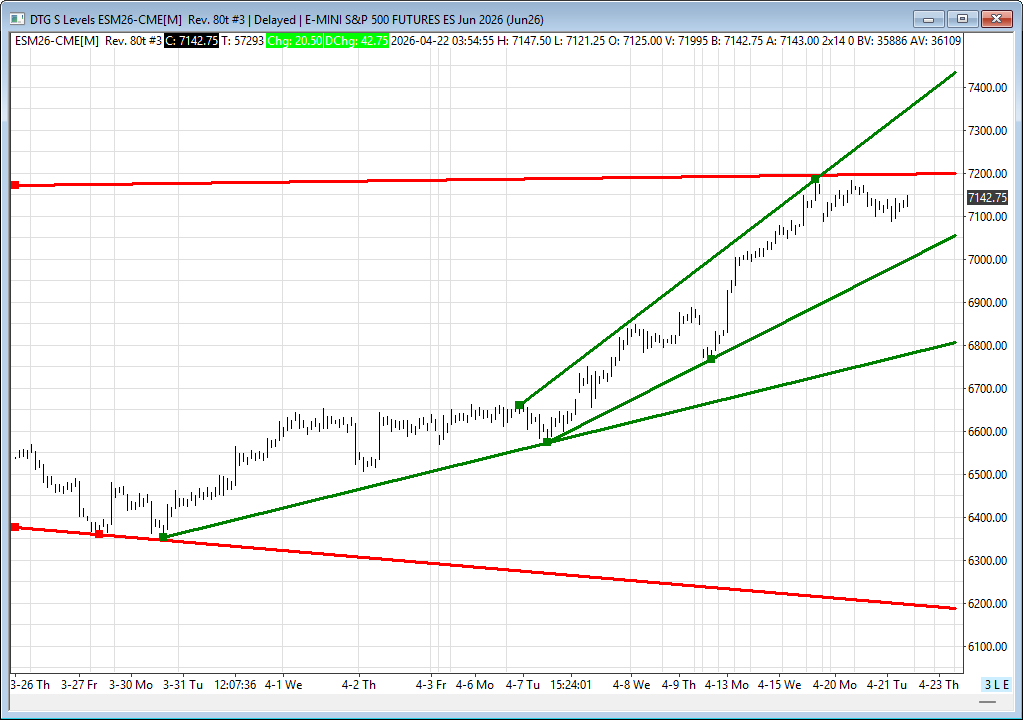
Technical levels (ES):
-
Consolidating just below all-time highs
-
Resistance: 7200/03, then 7425/30
-
Support: 7025/30, then 6800/05, 6190/85
-
Trend/MAs remain bullish (50-day above 200-day)
Affiliate Disclosure: This newsletter may contain affiliate links, which means we may earn a commission if you click through and make a purchase. This comes at no additional cost to you and helps us continue providing valuable content. We only recommend products or services we genuinely believe in. Thank you for your support!
Disclaimer: Charts and analysis are for discussion and education purposes only. I am not a financial advisor, do not give financial advice and am not recommending the buying or selling of any security.
Remember: Not all setups will trigger. Not all setups will be profitable. Not all setups should be taken. These are simply the setups that I have put together for years on my own and what I watch as part of my own “game plan” coming into each day. Good luck!
This post goes out as an email to our subscribers every day and is posted for free here around 2 PM ET. To get your real-time copy, sign up for the free or premium version here: Opening Print Subscribe.
Comments are closed