NQ and NVDA Weigh on the S&P
NVDA reports on Wednesday
Follow @MrTopStep on Twitter and please share if you find our work valuable!
Every week, MrTopStep invites traders to an “Own the Close” contest where the closest guesstimate where the SPX will settle on Friday’s 4:00 cash close.
The winners get a free week’s access to the MrTopStep Chat and trading tools. Enter your guess now!
Our View
The biggest stumbling block for the ES is the NQ, which is now over 5% below its all-time high. Every time it rallies, it fails and takes the ES along for the ride. Essentially, the ES rallied off the open, as did the NQ (which is where the head fake came in), and then the NQ experienced rotation selling. The other rotation involved buying the YM — which hit a new record high — and selling the NQ.
Also contributing to the NQ’s weakness was NVDA, which sold off to $124.37 and then flatlined late in the day, settling down 2.25%. It seems the markets are always waiting for something, and this time it’s NVDA’s earnings report on Wednesday after the close. The big question among some bulls is not whether NVDA stock will beat estimates, but by how much.
With the stock still 12% off its June high, Goldman Sachs (GS) strategist Scott Rubner — who previously predicted the short-term market top in July — made headlines last week by calling NVDA the “most important stock” of the year. He advised investors to “buy the dip” ahead of what he expects will be an earnings report significant enough to spark a market-wide rally.
Additionally, Goldman analyst Toshiya Hari recently maintained a “buy” rating on NVDA and reiterated a $135 price target on the stock ahead of earnings. The chip stock has rallied an astonishing 156.5% year-to-date and 22.4% over the past three months.
Our Lean
I’m sorry, I have just not had a good feel recently and I should know to sell the early rallies. I could be totally wrong but I think the current rotation out of tech is the same one we saw last month when the market was puking…I just don’t think it will be as big.
Our Lean: The ES usually rallies on Globex at night, but it’s my guess it will be under selling pressure during the day session. If the ES gaps lower, I may buy the open but ideally I want to sell the rip and see how the “after 3:00” trade goes. It doesn’t look all that great, but the ES is less than 100 points off its high.
One last thing.
I remember in 2007 that the ES dropped 9.5% from its high on July 17 and fully recovered, then on September 18th 2007 — I remember this like it was yesterday — the Fed cut rates and the markets crashed. On July 17th 2024, the ES made a top and fell 10.5% to its recent low, then made a full recovery. On September 18th 2024, the Fed is set to lower rates…
What do you think will happen?
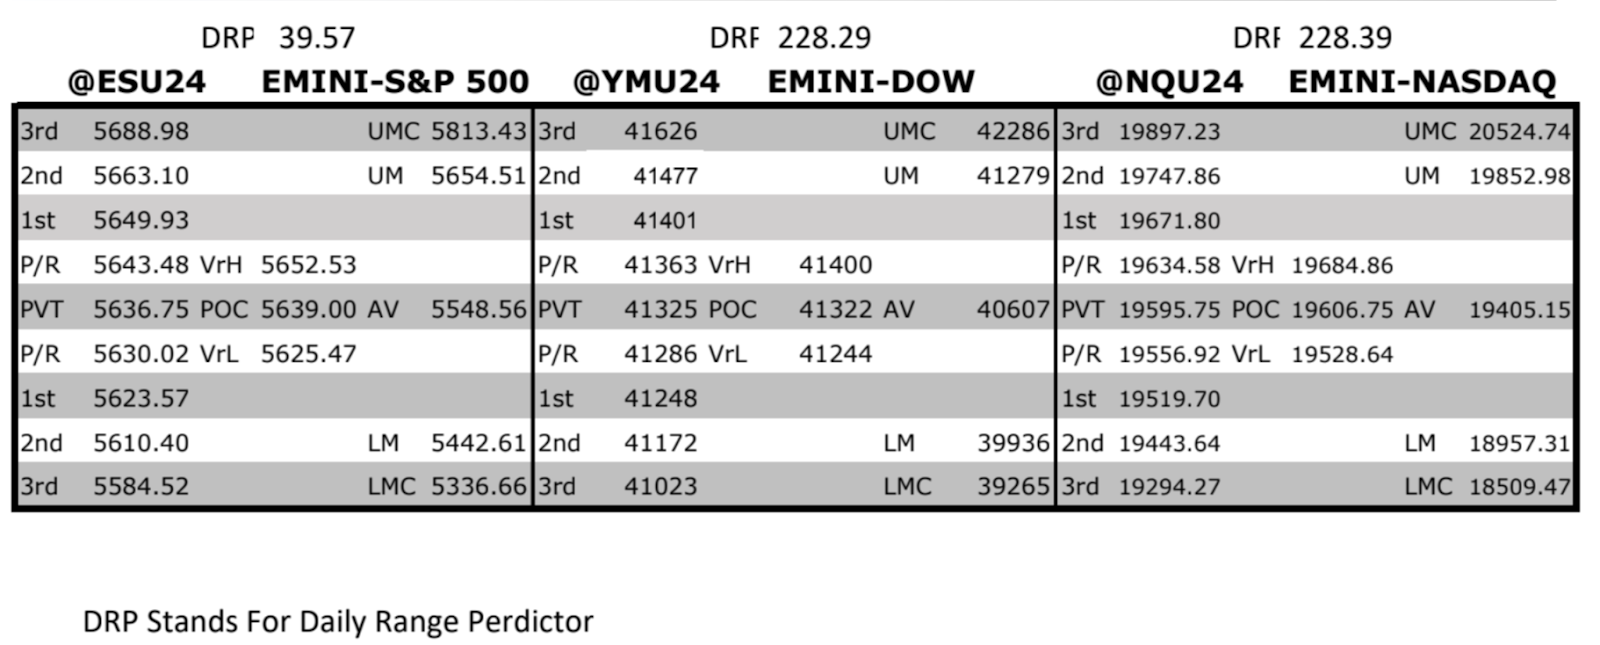
MrTopStep Levels:
MiM and Daily Recap
ES recap
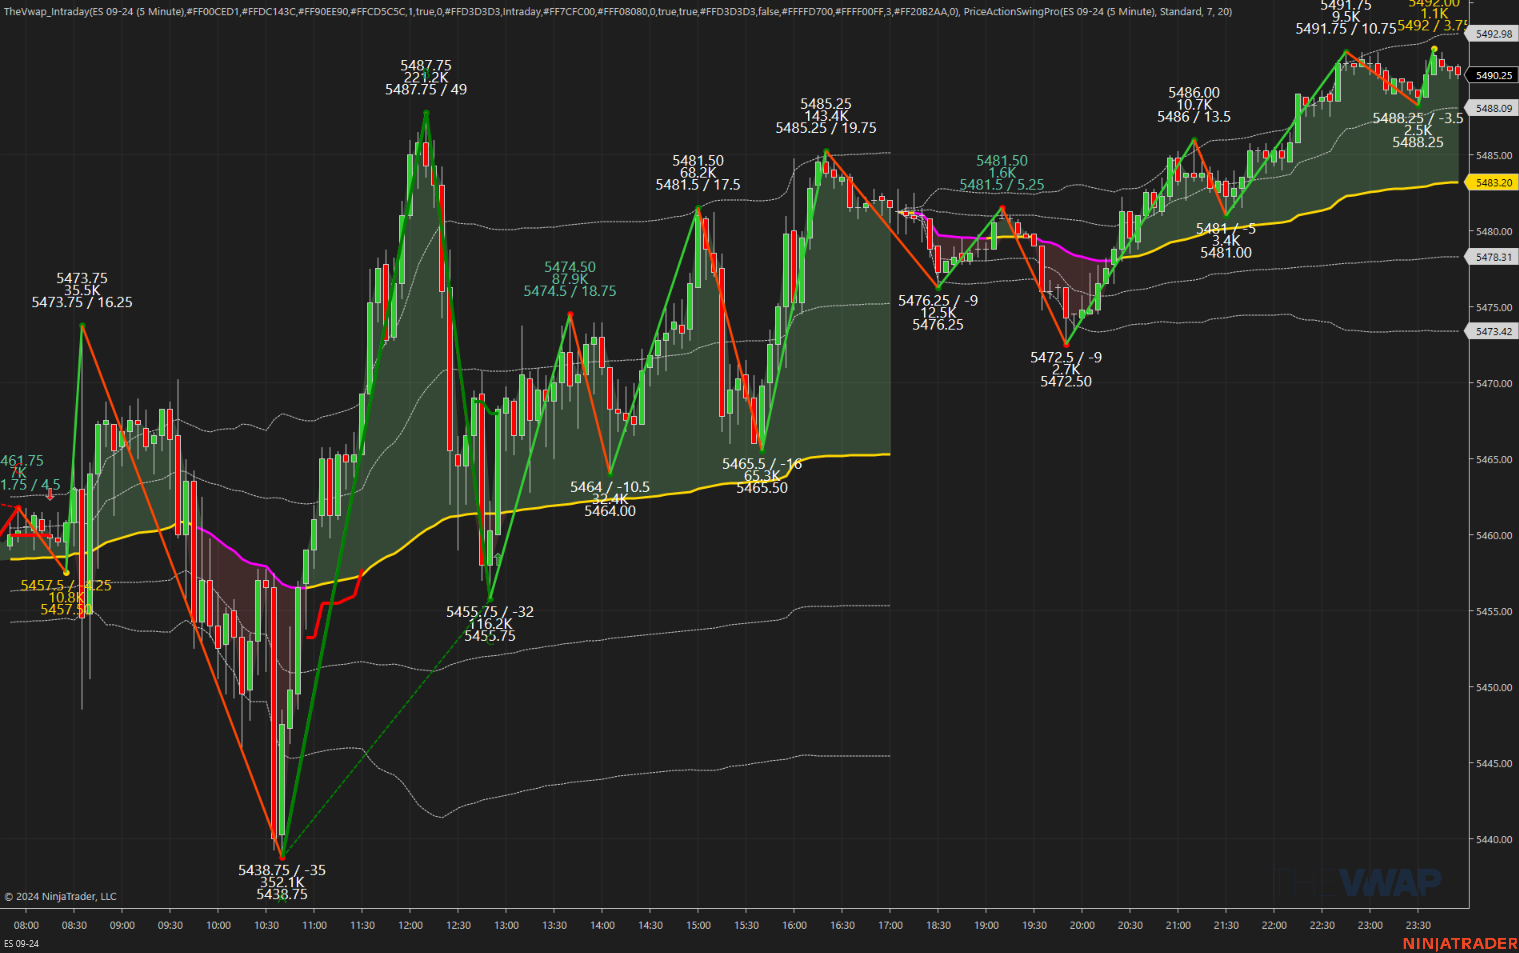
The ES opened at 5661, climbed to a high of 5669 a few minutes later, then faded for the next hour, trading down to 5631 at 10:35. The ES bounced to 5642.75 at 11:00, then faded to a lower low of 5626.50 at 12:00. From there, the ES rallied to a higher high of 5646.50 at 1:00, then faded to the session low of 5619.75 at 2:05. Notice how the range highs and range lows were hitting on the hour or half-hour marks.
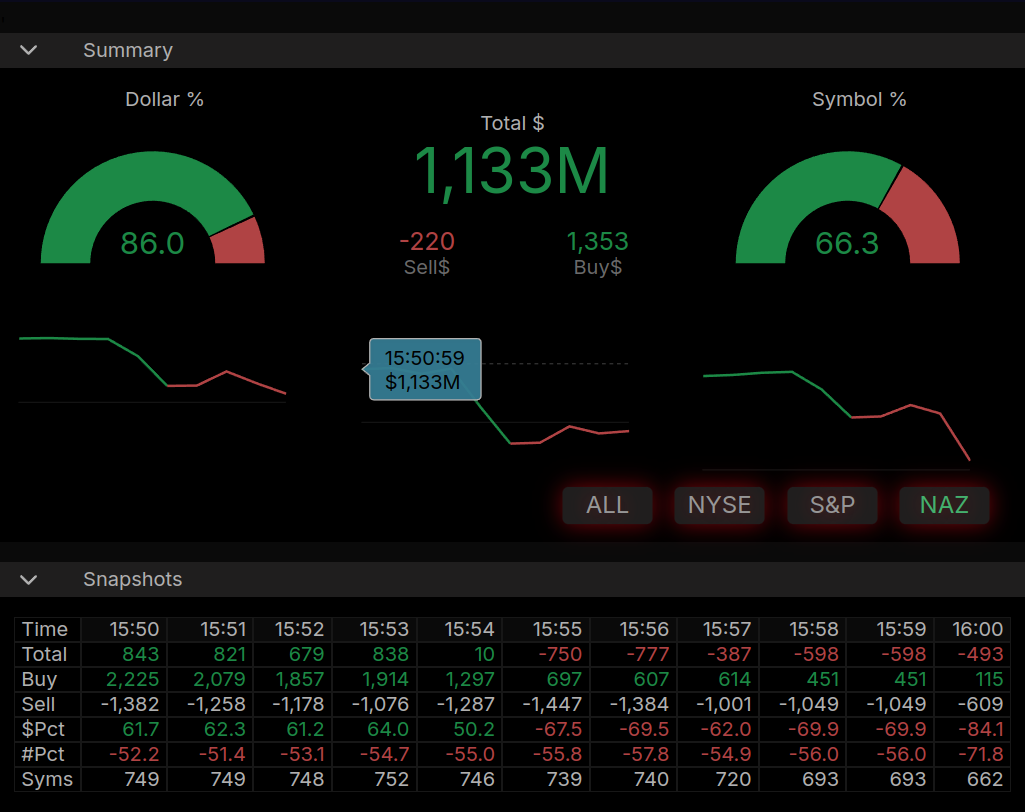
The ES bounced 18 points to 5638 at 2:40, then entered a 6- to 10-point sideways chop until it traded 5630.25 at 3:50 as the cash imbalance showed $843 million to buy. The ES dipped to 5628.25, popped 10 points to 5638.50, then traded 5633.75 at the 4:00 cash close. The ES settled at 5629.50 at the 5:00 futures close, down 15.5 points or 0.27%.
In terms of the ES’s overall tone, it was a slow day and weighed on by NQ and NVDA. In terms of the ES’s overall trade, volume was low with 1.06 million contracts traded.
Technical Edge
-
NYSE Breadth: 53% Upside Volume
-
Nasdaq Breadth: 55% Upside Volume
-
Advance/Decline: 54% Advance
-
VIX: ~16.50
Guest Post — Tradrr
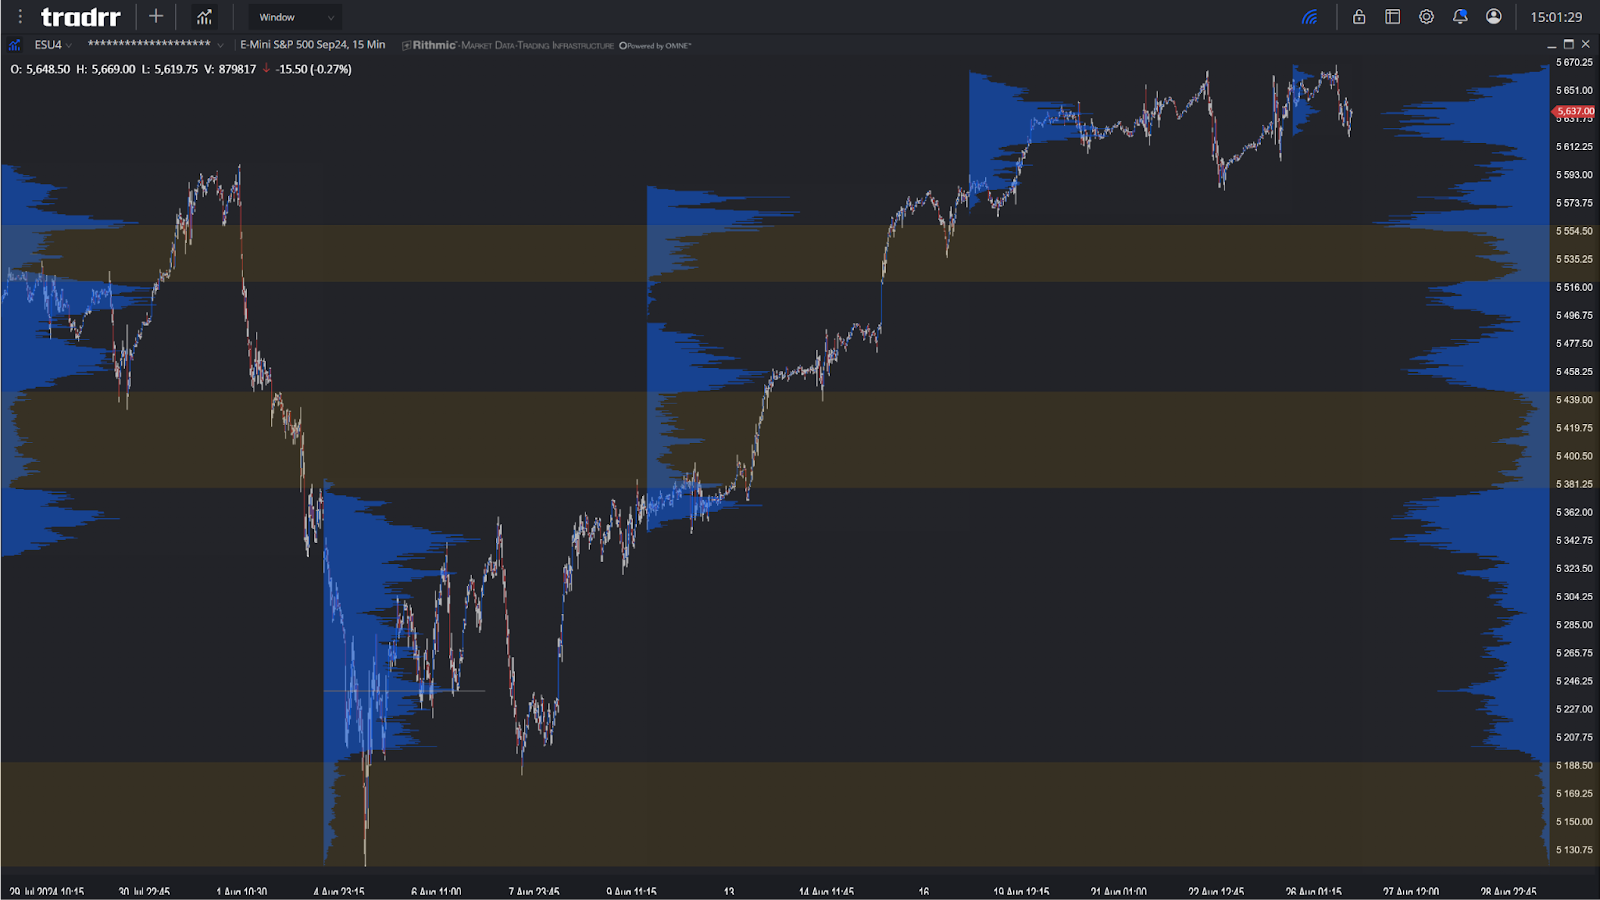
Coming into the final week of August and placing into a 3 day weekend into the next we have NVDA earnings on deck Wednesday after the close putting all eyes on chip stocks. Monday opened higher than previous Friday’s close, but spent the entire session drifting back in to settle near the middle of the previous Friday range.
August has spent a majority of its month after creating excess at the lows into pushing through the final week of July’s low volume nodes leaving behind similarly placed low volume nodes.
These areas, when tested, could have the opportunity to properly trade out and fill up these dips in the composite profile but otherwise depending on the performance of NVDA could continue higher and leave yet another low volume node across the 670’s of ES. Should it fail to then hold any high volume node made it sets up September with an opportunity to establish excess testing higher to go down to test out the previously mentioned low volume nodes.
To learn more about Tradrr, visit them here.
Economic Calendar
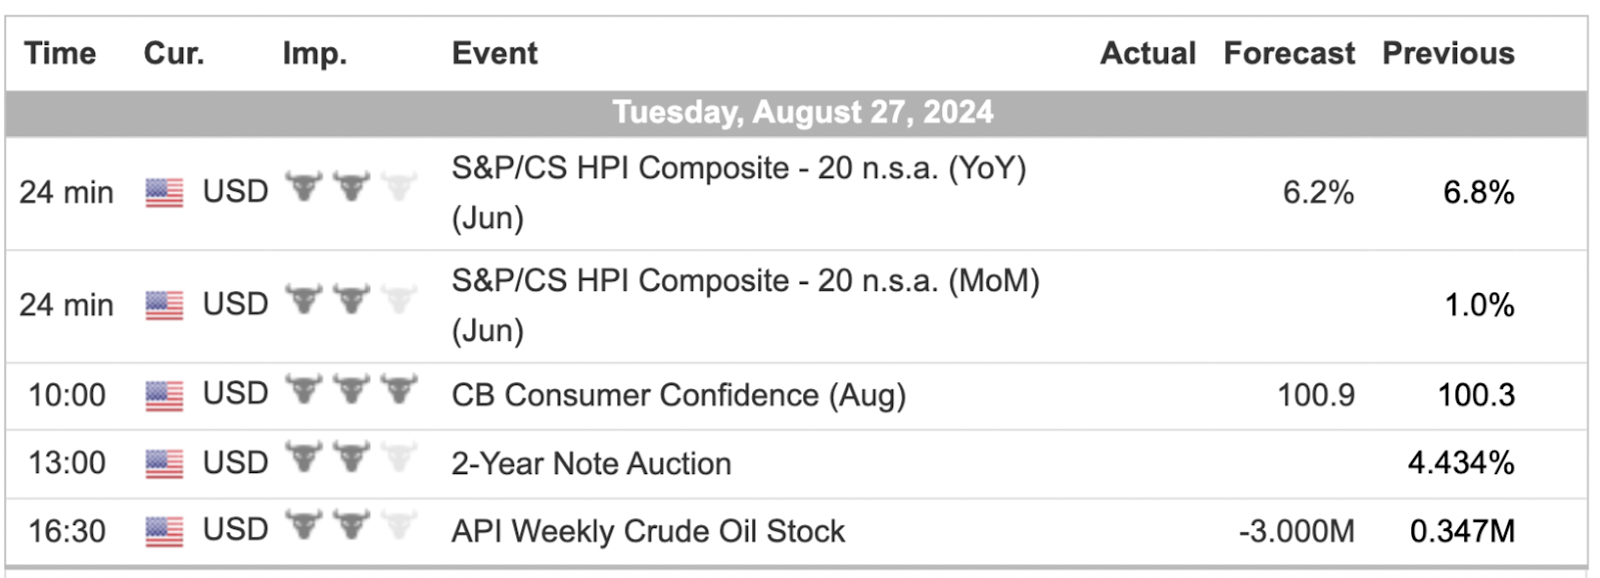
For a more complete Economic Calendar see: https://mrtopstep.com/economic-calendar/
Comments are closed