This post goes out as an email to our subscribers every day and is posted for free here around 2 PM ET. To get your real-time copy, sign up for the free or premium version here: Opening Print Subscribe.
NVDA: Today’s IBM
Follow @MrTopStep on Twitter and please share if you find our work valuable!
FREE Two-Week Offer for the Opening Print Premium. Open up the Lean and other premium features for the next Two Weeks!
Our View
It’s feast or famine when it comes to the ES and NQ trade. Friday, the ES rallied 109 points, Monday was a slow, slow pullback, and yesterday it was a slow chop higher. It used to be that the ES was the number one futures contract in the world for retail traders—but it’s not anymore.
While I am an S&P guy, I also worked at the “old Merc” in the gold pit and always loved the price action and big percentage moves. Crude oil has always been a mover. I received my crude oil education when the PitBull was ripping up the NYMEX crude option pit. The bonds were the biggest pit in the industry, churning out hundreds of thousands of contracts a day, but they were hard to trade with so much information the public never sees.
The grains? A very slow boat with depressed prices.
I guess by now you think I’m down on trading—and that’s partially right. Trading volume has fallen steadily over the last month and a half. Just do the math. I asked Hank from HL Camp: if there was a total of 1 million contracts traded, and you took out 150k from Globex, leaving 850k traded on the day, what percent of volume is program trading? And this was his answer:
IMPRO: HL Camp (3:59:28 PM): 765 to 800
IMPRO: HL Camp (3:59:41 PM): 90 to 95%
I get it, it’s August, and I know that’ll change in September, but it’s hard to believe that total customer, non-program/algorithmic trading volume represents only 65k to 75k contracts? I know Hank is the pro on this subject, but I think it’s higher. Even if it isn’t, this shows how easily the contract can be manipulated by large institutional flows, ie thin to win.
I’ve always known that, but that was when the ES was doing 2 million to 3.5 million contracts a day, not like it is today.
In the end, it seems we’re stuck in what I call up-a-day, down-a-day price action. In terms of the ES and NQ’s overall tone, the NQ led the way higher. In terms of the ES’s overall trade, volume was on the low side at 1.047 million contracts traded.
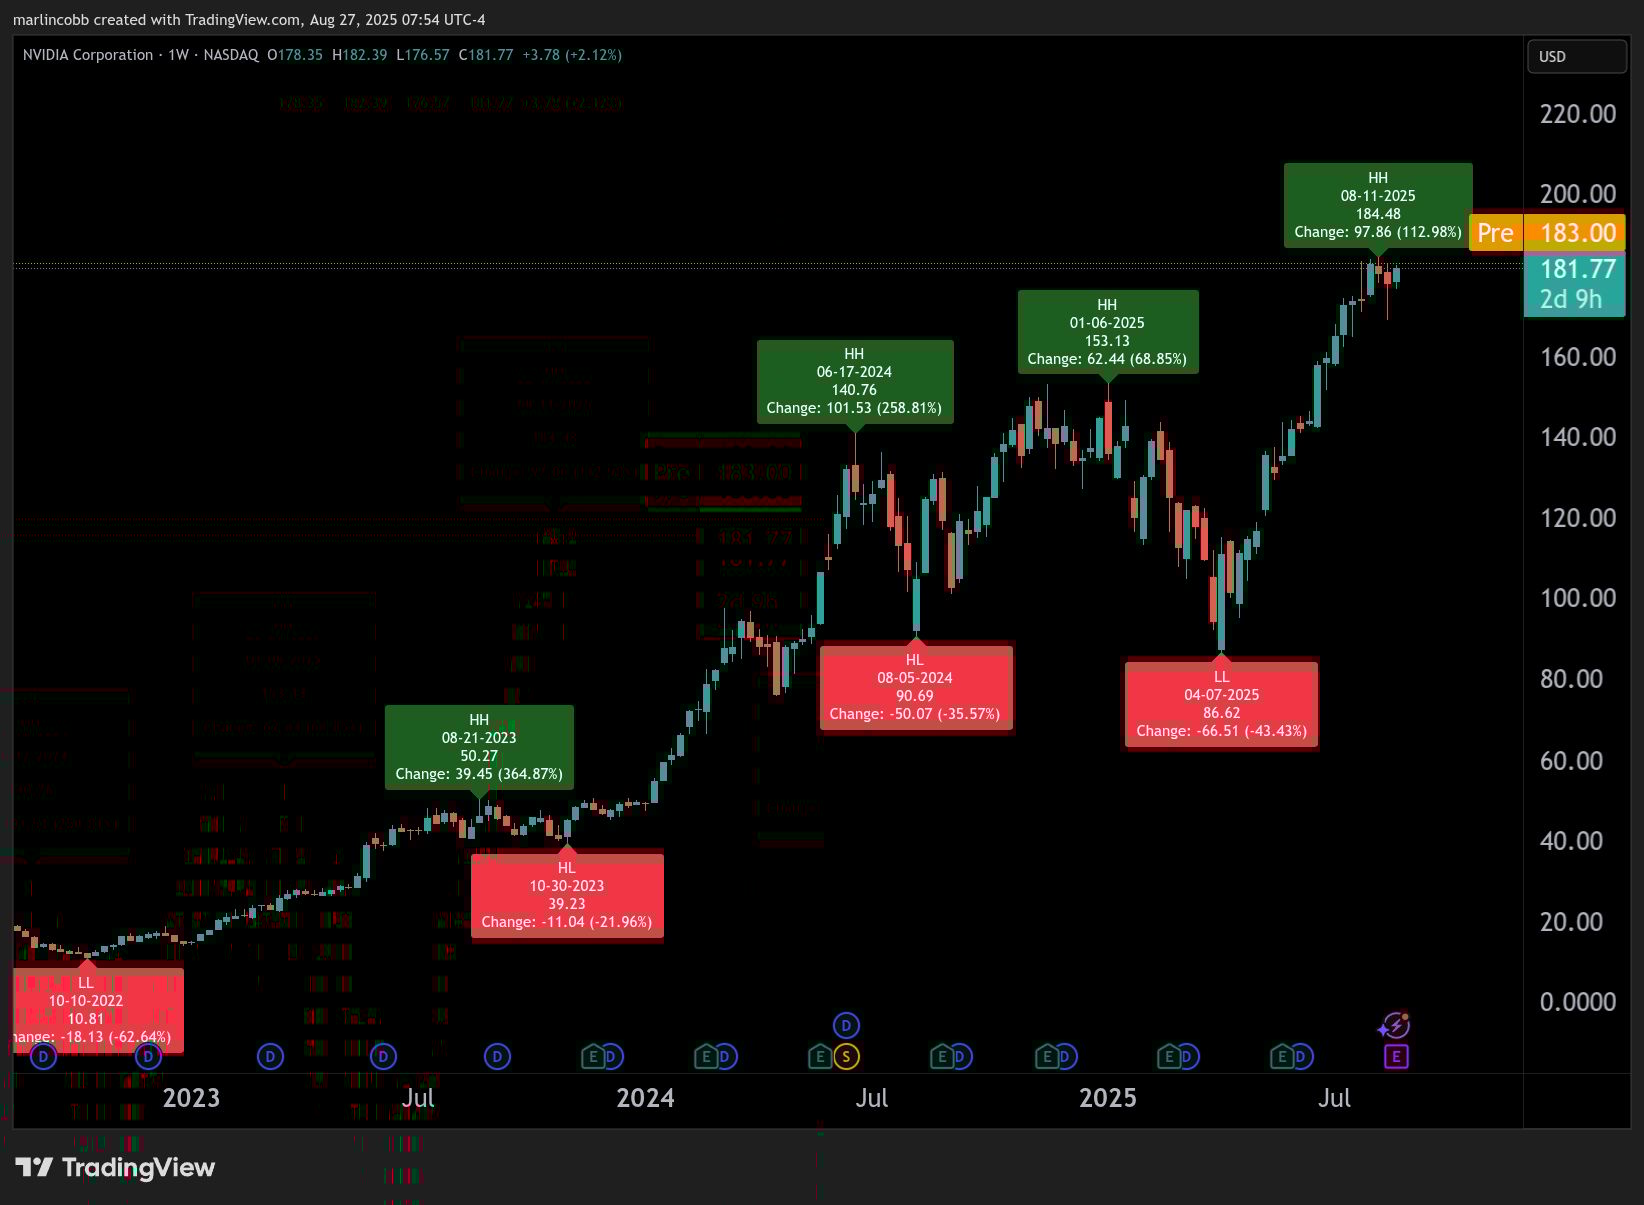
There are no economic reports today, but Richmond Fed President Tom Barkin speaks at 12:00, and the big show—NVDA reports after the close. A long time ago, IBM was the bellwether of the S&P and a highly anticipated market event. Back in 2010, IBM’s total market capitalization was $180 billion, versus Nvidia’s market cap now at $4.39 trillion at $182/share
One of the big firms everyone watched when IBM was reporting was Solomon Brothers. They had the number every time. The desk was run by a guy I knew, Larry W., and his wife was a trader. No one ever saw her, but she was always around for the IBM earnings. It was always the biggest earnings event of the year and would move the SPU.
But that was then, and this is now. NVDA is the bellwether of the S&P, currently holding the largest weighting within the index at approximately 8%. It went from a total market cap of $350 billion at the start of 2023 to $4.39 trillion as of yesterday.
JPMorgan’s most recent earnings estimate for Nvidia (NVDA), made on August 25, 2025, projects July-quarter revenue of $46–$47 billion, slightly above consensus. They expect revenue guidance of $53–$54 billion+, also above Wall Street’s estimates. I think this is 100% part of why the ES and NQ rallied yesterday—and helping that idea along was the $1.7 billion 3:50 imbalance and the new highs that preceded it.
Options traders are pricing in about a $260 billion swing in Nvidia’s (NVDA) market value following the chipmaker’s second-quarter earnings. U.S. options market data shows Nvidia options are implying a roughly 6% swing for the shares in either direction.
Nvidia’s ($NVDA) market cap now sits just ~$1 trillion below Japan’s Nikkei 225—the world’s second-largest stock market after the U.S. That makes Nvidia bigger than the entire markets of the U.K., China, and Canada. Over the last 16 months, its value has doubled to ~$4.3T, giving it a 4.94% weight in the MSCI All Country World Index—nearly equal to Japan’s 4.97% share.
Our Lean
I thought we could see lower prices, but it all happened on Globex. After a little sideways-to-down price action, the selling dried up, and the ES and NQ started drifting higher as thin to win took over. With no economic releases and just one Fed speaker, it’s my guess we pick up where we left off—going higher.
Our lean: is to buy the pullbacks. If the ES can hold above 6485, I have targets at 6505, 6512, and 6520. As for going long in the ES and NQ into NVDA’s earnings, I think you can—but there are risks of a “sell the news” reaction.
Guest Posts — Polaris Trading Group
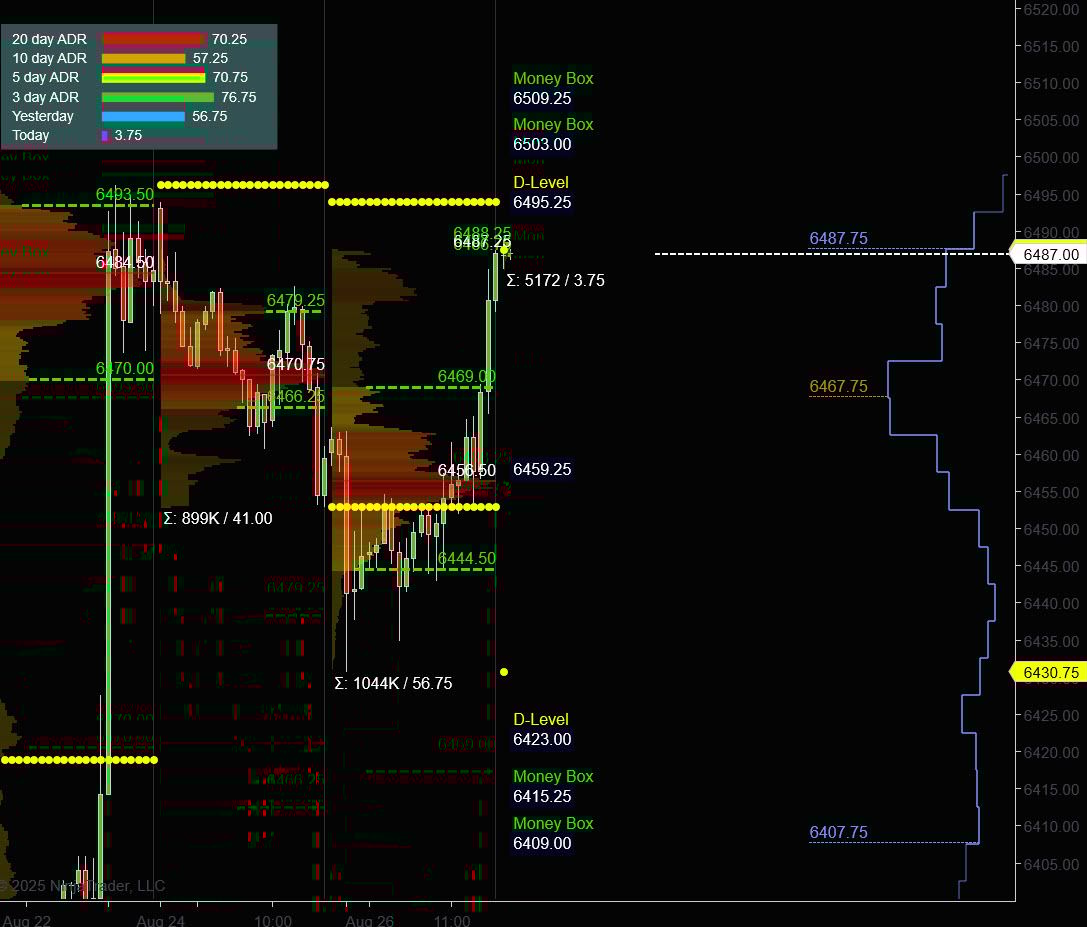
Prior Session was Cycle Day 1: CD1 Low (6430.75) was established as selling spilled-over from the CD3 weakness.
This set the stage for a successful retest setting up the structural conditions for a powerful rally, which easily fulfilled some upside targets (6475 – 6485).
Options Gamma Squeeze and Market on Close Buy Imbalance sent price closing on the highs of the day.
Range was 56 handles on 1.042M contracts exchanged
For a more detailed recap of the trading session, click on this link: Trading Room RECAP 8.26.25
FREE TRIAL link to PTG/Taylor Three Day Cycle
…Transition from Cycle Day 1 to Cycle Day 2
Transition into Cycle Day 2: Normally for CD2 we are anticipating some consolidation MATD rhythms to begin the session.
Price closed the prior session with strong outgoing momentum, which may spill-over into today’s trading.
BTFD buyers were clearly active during the prior session as a bullish signal post JPOW speech.
As we posted: “Key for the next few trading sessions will be the response of buyers should sellers appear. The most bullish response would be seeing additional buyers (new money) entering on the dips.”
Of course, nothing changes for PTG…Simply follow your plan. Take only Triple A setups and manage the $risk. ALWAYS HAVE HARD STOP-LOSSES in-place on the exchange.
PTG’s Primary Directive (PD) is to ALWAYS STAY IN ALIGNMENT with the DOMINANT FORCE.
As such, scenarios to consider for today’s trading.
Bull Scenario: Price sustains a bid above 6480+-, initially targets 6505 – 6510 zone.
Bear Scenario: Price sustains an offer below 6480+-, initially targets 6460 – 6455 zone.
PVA High Edge = 6470 PVA Low Edge = 6445 Prior POC = 6456
ESU
Thanks for reading, PTGDavid
MiM and Daily Recap
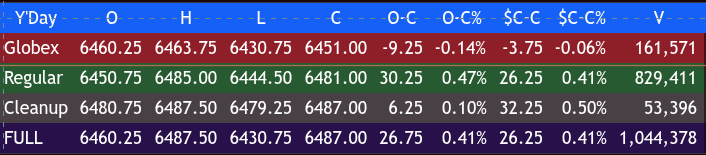
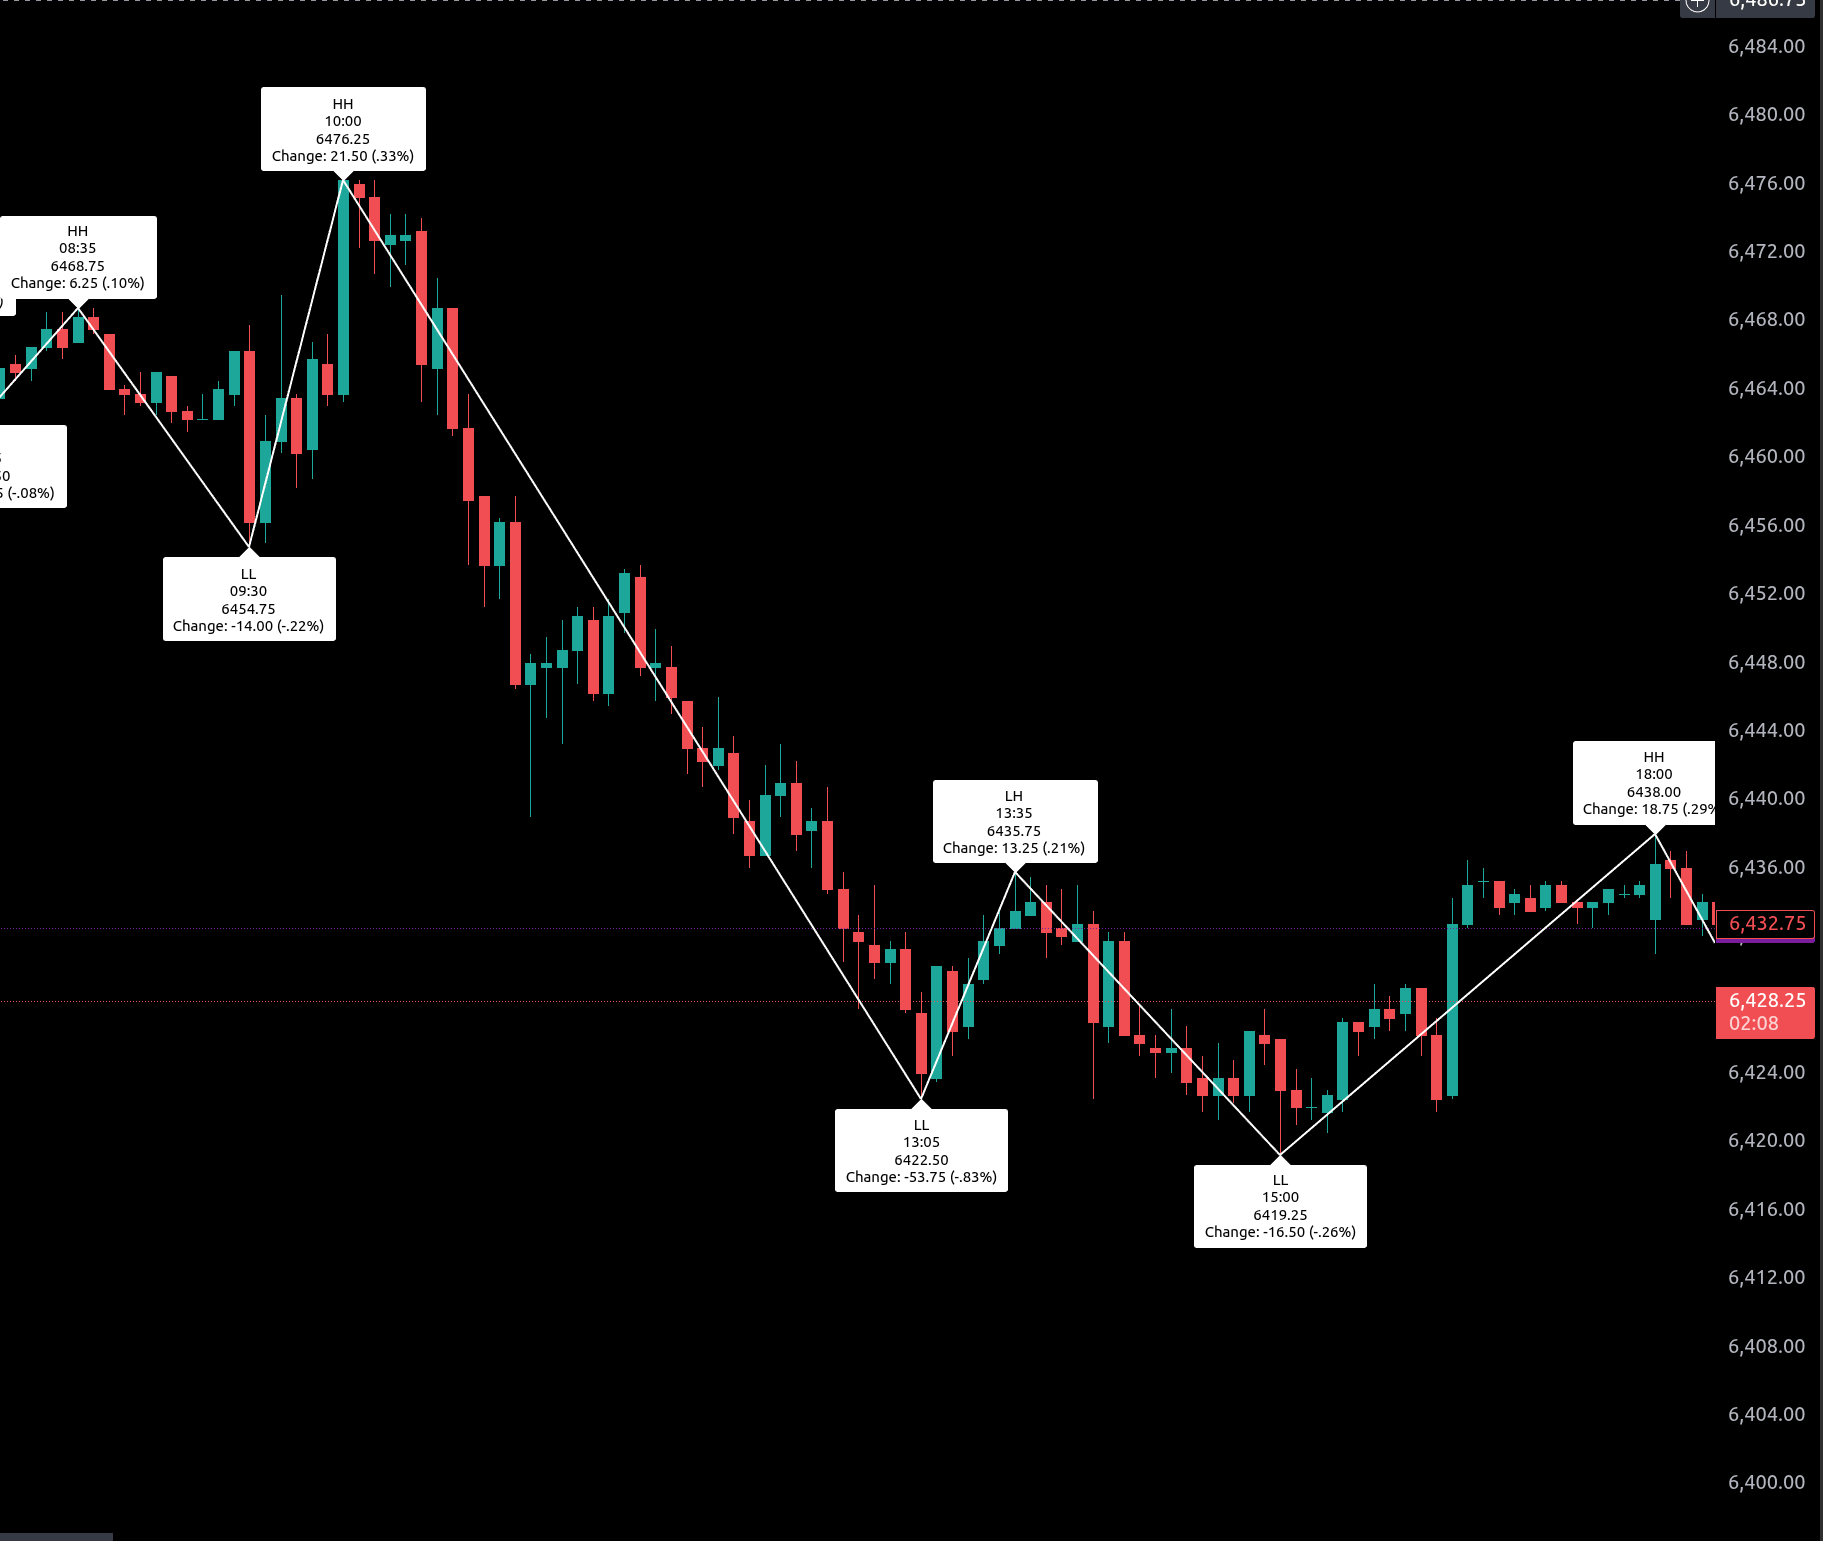
The ES futures opened the overnight Globex session at 6460.25. Early trade saw a sharp drop, with a quick swing down to 6441.00 at 20:00, followed by a deeper low at 6430.75 just 45 minutes later. Sellers pressed the lifting to 6454.75 by 01:45, a 24-point recovery. A pullback carried prices down to 6435.00 at 03:00, before another rebound reached 6453.50 at 06:30. The final dip of the overnight trade occurred at 08:15, when ES printed 6443.00. Globex closed at 6451.00, down 9.25 points or -0.14% from its open and slightly weaker against the prior day’s cash close.
The regular session began with an open at 6450.75 and immediately found support from the Globex low, with a push to 6461.75 by 10:20. After a pullback to 6452.00 at 11:15, buyers regained control, notching a higher high at 6464.75 by 12:20, a 12-point move from the low. Another small advance followed at 13:25, with ES printing 6465.25. The afternoon session experienced a modest retracement to 6453.50 at 13:50, but momentum soon shifted upward. The regular session closed at 6481.00, up 30.25 points or +0.47% from the open.
In the cleanup session, ES extended slightly higher, settling at 6487.00, a gain of 6.25 points from the 16:00 close. For the full session, ES settled at 6487.00, marking a 26.25-point rise from the prior cash close, a gain of 0.41%.
Market Tone & Notable Factors
The overall tone was constructive despite the early overnight weakness. The Globex session showed volatility, with sellers pressing early, but the downside failed to extend, and buyers steadily worked the tape higher into the regular session. Once cash trading began, dips were shallow, and the tape built a sequence of higher highs and higher lows, culminating in a strong late-day rally.
The session’s cash-to-cash change of +26.25 points (+0.41%) underscores a bullish bias. Volume was light, with 829,000 contracts trading during the regular session.
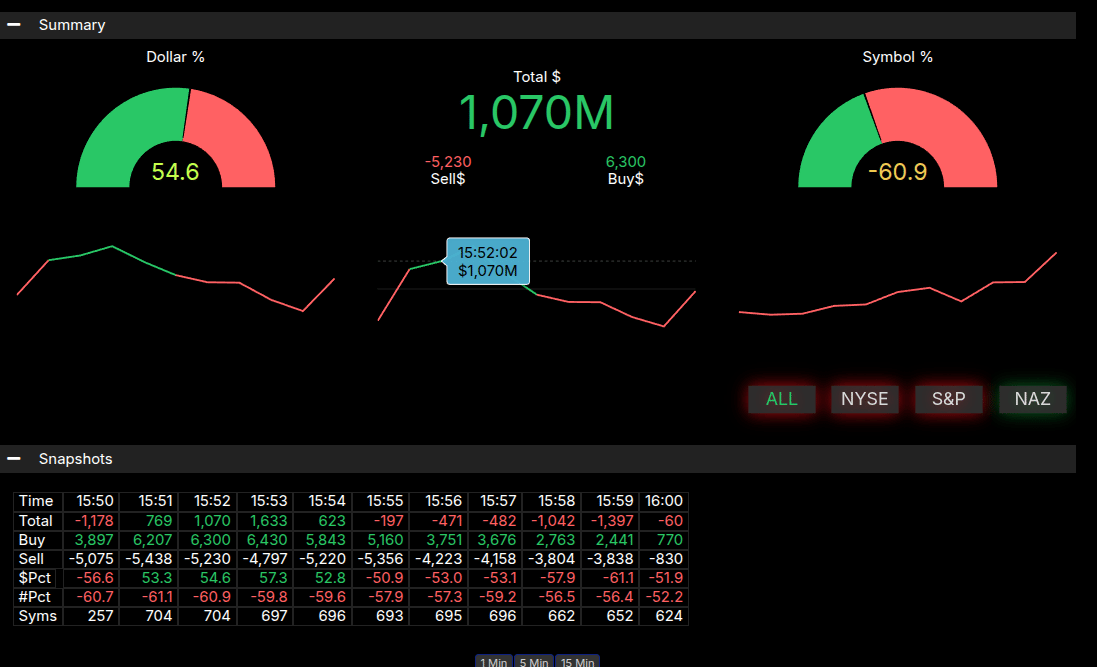
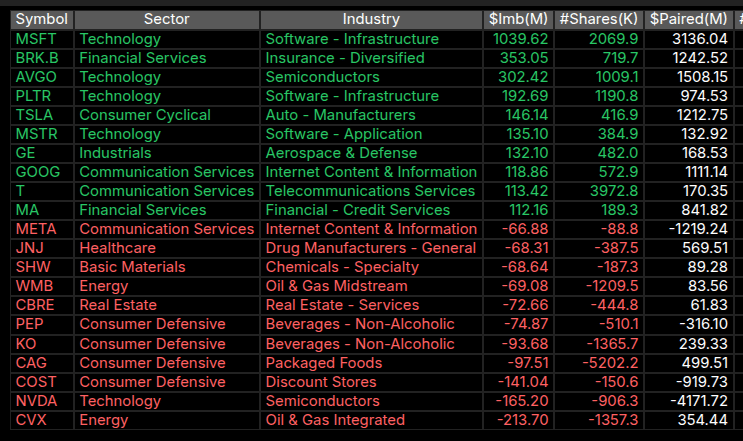
Market-on-Close imbalance data showed a $1.07 billion buy imbalance around 15:52, with 54.6% of dollar flow to the buy side but only 39% of symbols participating. While the imbalance favored buyers, the symbol distribution leaned negative at -60.9%, suggesting selective strength concentrated in large caps rather than broad-based buying. The imbalance contributed to sustaining prices near highs into the final prints.
Overall, the session leaned bullish, with buyers defending levels throughout the day and late momentum carrying ES to its highest point near the close. The contract finished at 6487.00, leaving traders looking for follow-through into the next session.
Technical Edge
Fair Values for August 27, 2025:
-
SP: 14.63
-
NQ: 61.73
-
Dow: 62.85
Daily Market Recap 📊
For Tuesday, August 26, 2025
-
NYSE Breadth: 52% Upside Volume
-
Nasdaq Breadth: 64% Upside Volume
-
Total Breadth: 62% Upside Volume
-
NYSE Advance/Decline: 53% Advance
-
Nasdaq Advance/Decline: 59% Advance
-
Total Advance/Decline: 56% Advance
-
NYSE New Highs/New Lows: 133 / 10
-
Nasdaq New Highs/New Lows: 174 / 70
-
NYSE TRIN: 0.87
-
Nasdaq TRIN: 0.80
Weekly Market 📈
For the week ending Friday, August 22, 2025
-
NYSE Breadth: 60% Upside Volume
-
Nasdaq Breadth: 58% Upside Volume
-
Total Breadth: 59% Upside Volume
-
NYSE Advance/Decline: 79% Advance
-
Nasdaq Advance/Decline: 66% Advance
-
Total Advance/Decline: 71% Advance
-
NYSE New Highs/New Lows: 260 / 57
-
Nasdaq New Highs/New Lows: 490 / 247
-
NYSE TRIN: 2.46
-
Nasdaq TRIN: 1.33
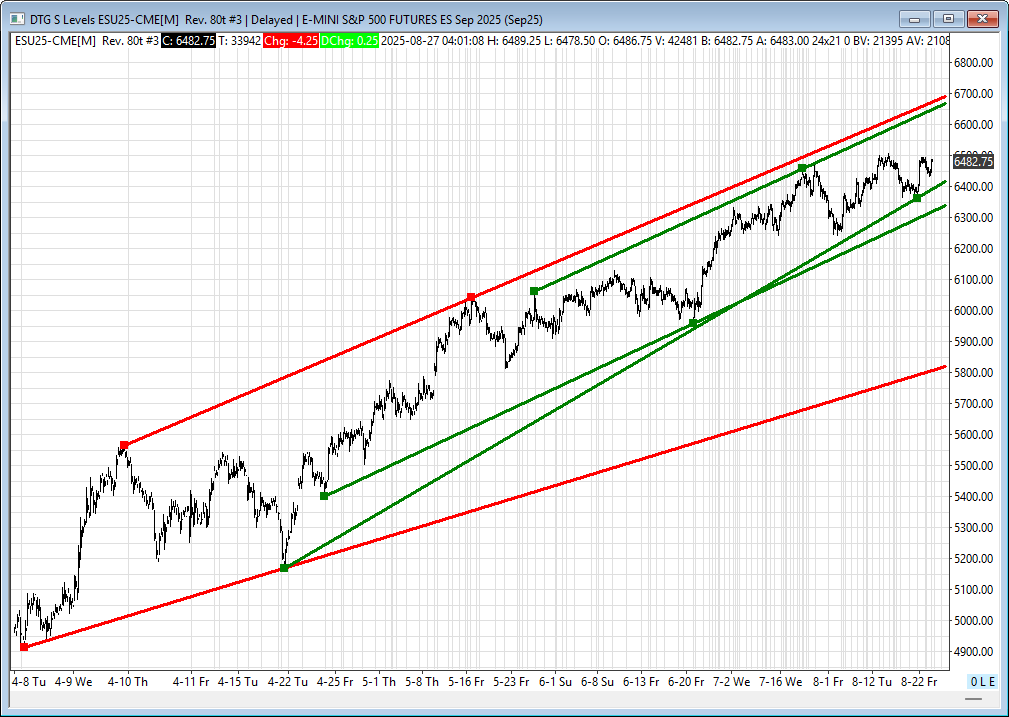
ES Levels
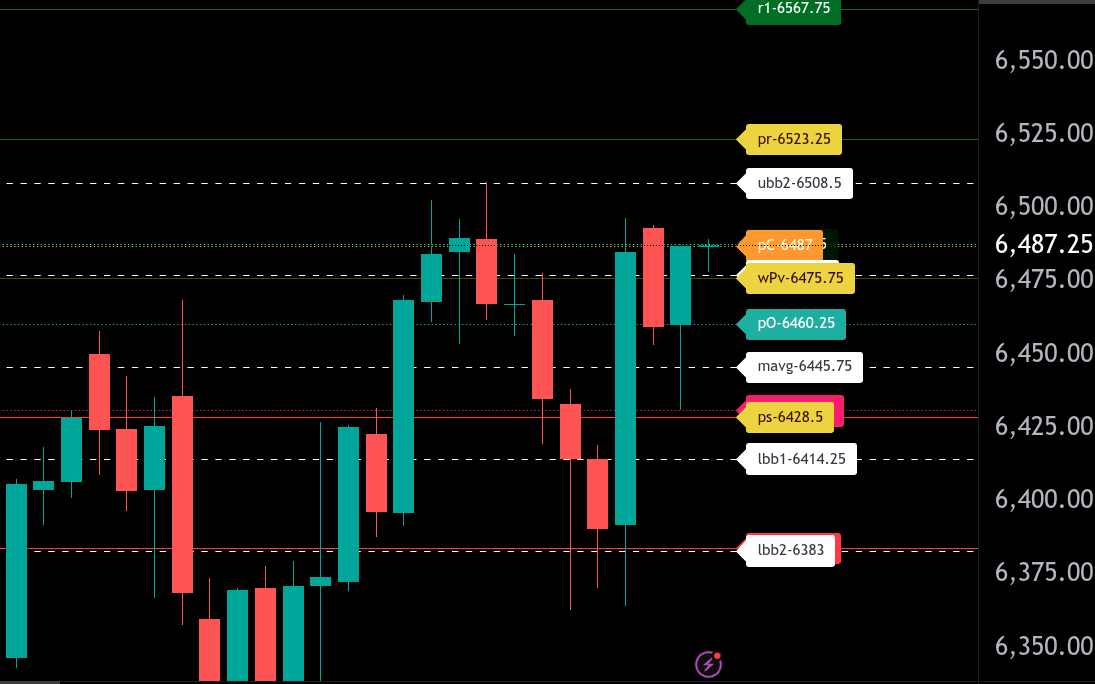
The bull/bear line for the ES is at 6475.75. This is the key pivot for today. Trading above this level favors the bulls, while sustained price action below keeps the market under bearish pressure.
Currently, ES is trading near 6487.50, slightly above the bull/bear line, showing early signs of strength. If buyers can defend this zone, upside targets include 6508.50 and 6523.25, the upper range target for today, and next up resistance sitting at 6567.75. A sustained break above 6567.75 would confirm a stronger bullish continuation.
On the downside, support comes in first at 6460.25 and then 6445.75. The lower range target is at 6428.50, aligned with yesterday’s low at 6430.75. A break below these levels could extend the decline toward deeper support at 6414.25 and 6383.
Overall, the short-term tone is leaning bullish above 6475.75, but traders should remain cautious if price slips back under this key pivot. Reminder, we are still in a long-term bullish trend.
NQ Levels

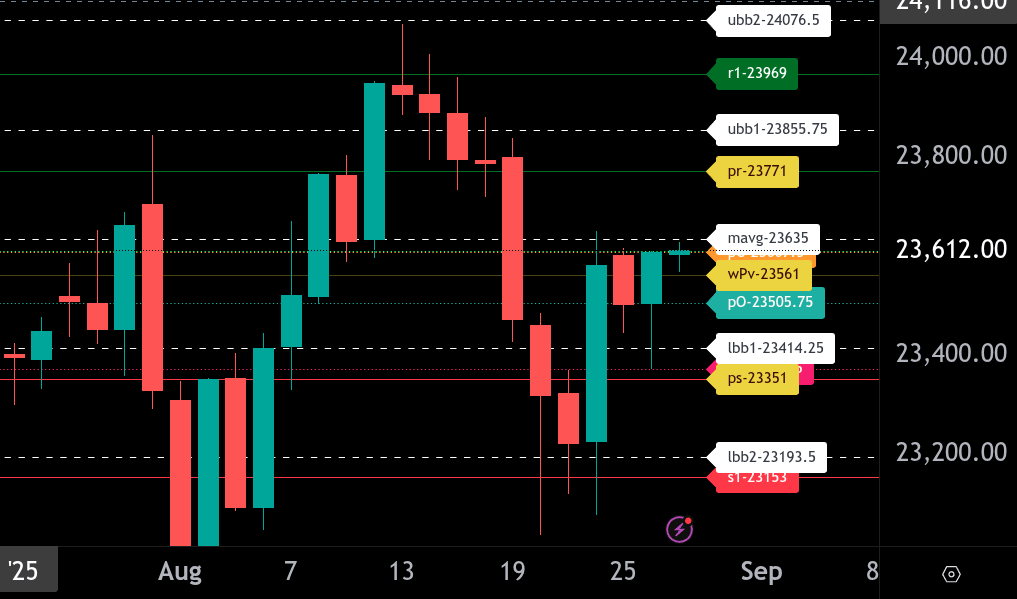
The bull/bear line for the NQ is at 23,561. This is the key pivot level that separates bullish from bearish sentiment. Price action above this level favors buyers, while trading below suggests sellers remain in control.
Currently, NQ is trading around 23,612.00, placing it just above the bull/bear line. Holding above 23,561 keeps the bias slightly bullish, with the potential to target higher levels. The upper range target for today is 23,771, while the lower range target sits at 23,351.
Immediate resistance comes in at 23,635 (moving average) and 23,607.75 (previous close). A sustained push above these opens the path to 23,771 and further up to 23,969. If momentum strengthens, the upper Bollinger band at 23,855.75 is also a level to watch.
On the downside, initial support rests at 23,505.75. A break below the bull/bear line of 23,561 could see price move back toward 23,414.25 and then the lower range target at 23,351. Deeper support lies at 23,153.
Overall, the market is sitting at a pivotal zone. Staying above 23,561 suggests potential continuation to the upside, but a rejection here could invite another test lower.
Calendars
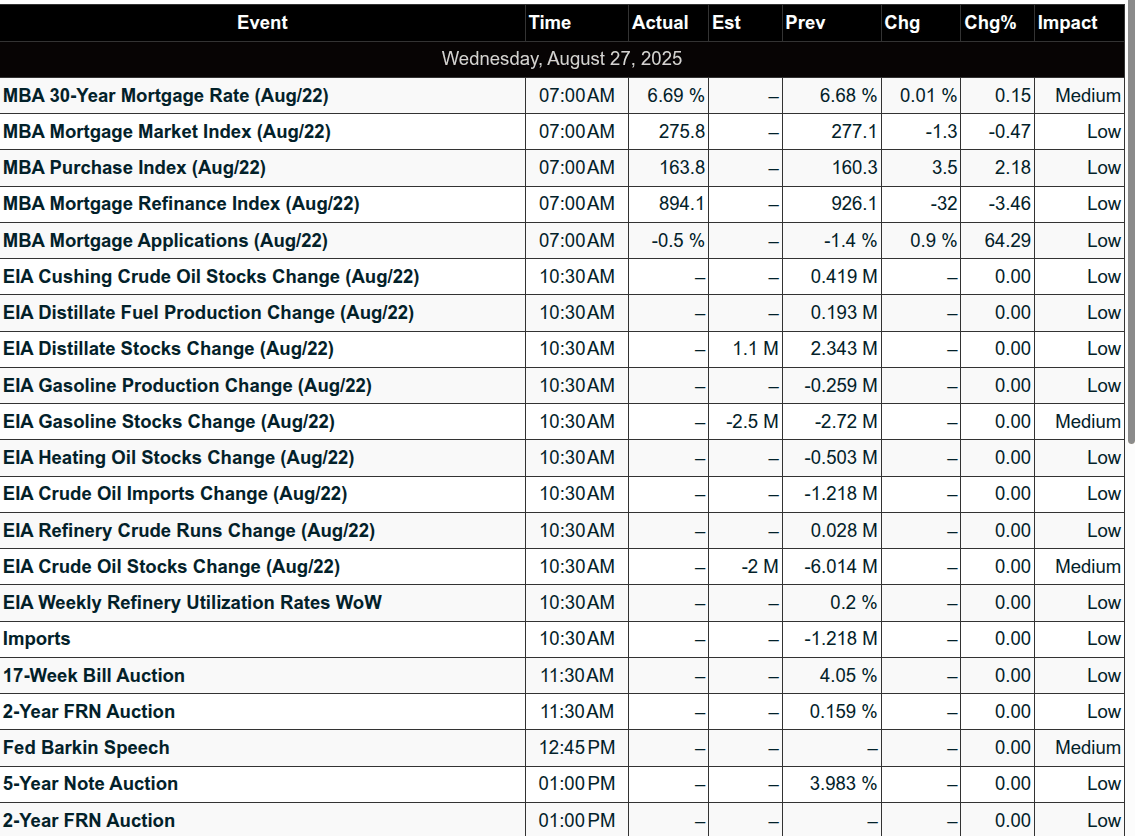
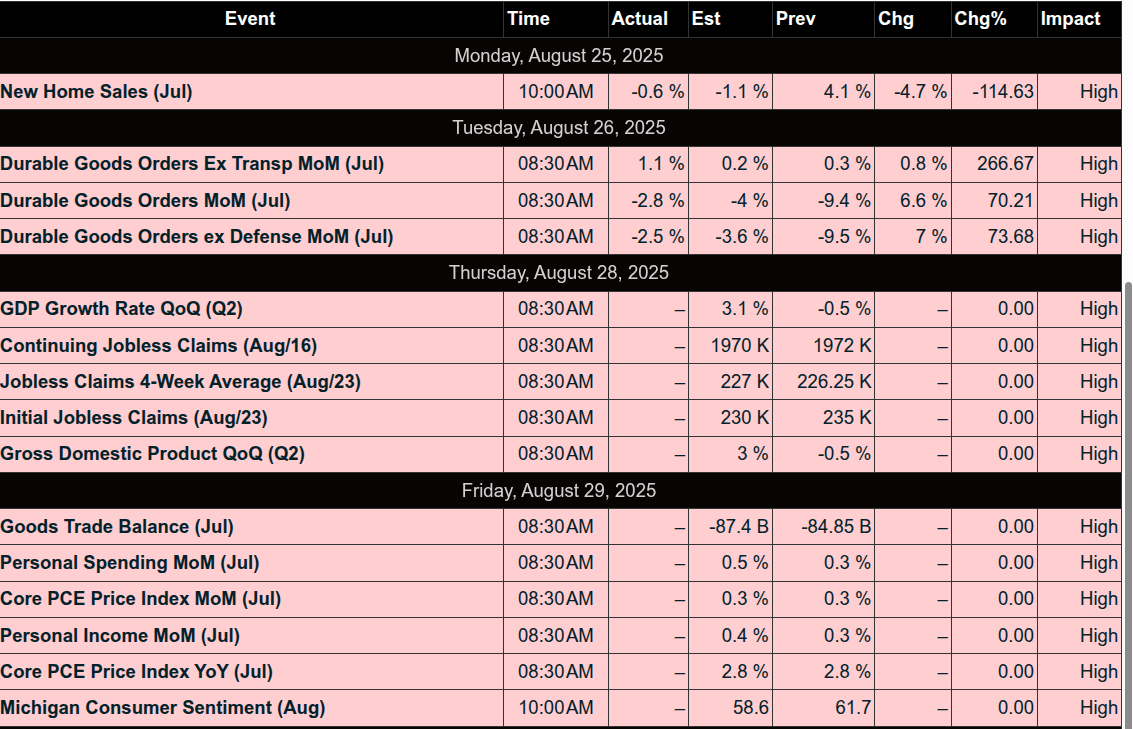
Economic
Today
Important Upcoming / Recent
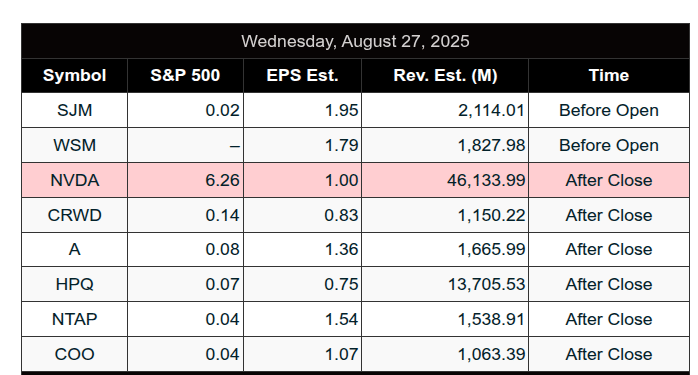
Earnings
Upcoming
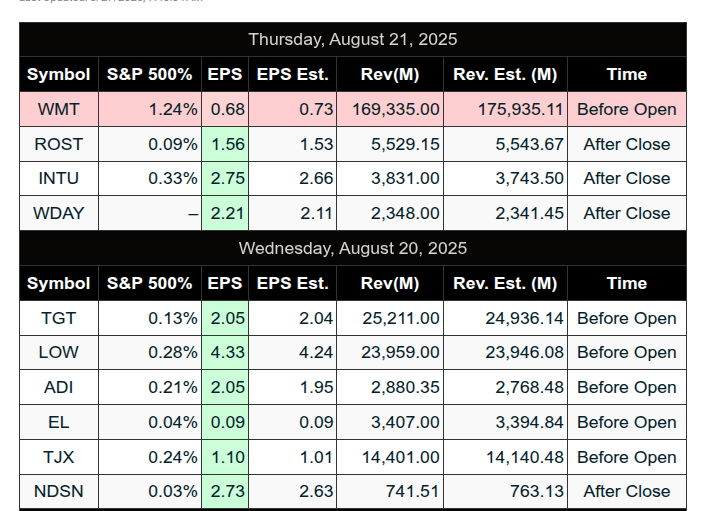
Recent
Trading Room Summaries
Polaris Trading Group Summary – Tuesday, August 26, 2025
Opening Context & Setup
-
The room kicked off with David’s usual resources: daily strategy, range calculator, and a trader wisdom quote:
“I have no control over the trade outcomes. I can only control the orders I enter.” -
Early session highlighted Nvidia news and anticipation of earnings later in the week.
-
Some technical hiccups with chart streaming were resolved early.
Morning Session – Choppy & Cautious
-
The market opened in indecisive chop, with wide-body candles and flat VWAP/EMAs.
PTGDavid described it aptly as: “Chop Salad with no dressing.” -
Key levels discussed:
-
Support: ES 6437
-
Resistance: 6452–6455 zone
-
-
Manny offered detailed trade plans but stayed cautious due to price action, emphasizing patience:
“As the day goes on, the read gets clearer… there will be a good trade in here at some point.”
Midday – LIS Hold & Setup
-
Market tested and held the Line in the Sand (LIS) at 6455, setting up a potential bull scenario:
-
If price held above 6455 → targets were 6465 → 6470
-
-
Into lunch, price consolidated around LIS — no major moves, but groundwork for a stronger afternoon session was laid.
Afternoon Session – Precision Execution & Squeeze
-
Post-lunch, the market executed the bull scenario perfectly:
-
6465 target hit with “ultra precision”
-
6470 target also achieved
-
-
David and others (including Manny) rode the A10 setup beautifully into a strong afternoon rally, described as:
-
“Best rally all day”
-
“Short covering ripper”
-
“Squeeze play complete”
-
Key Wins & Lessons
-
Patience paid off – Traders like Manny wisely held off early in chop and caught the cleaner afternoon setup.
-
A10 trade execution into the squeeze was a highlight.
-
Gamma dynamics explained the afternoon ramp – someone was heavily short 0DTE calls and got squeezed, fueling momentum.
-
Final move into close: 6485 tagged, aided by a $1.7B MOC Buy Imbalance.
Positive Trades Highlight
-
A10 Setup: Clean and rewarding for those who waited for confirmation.
-
Bull Scenario: Played out exactly as planned – 6455 hold → 6470 → extended to 6485.
-
Gamma Squeeze Ride: Multiple traders capitalized on this high-energy move.
Trader Takeaway
“Let someone else’s money figure it out, then follow the winner.” – Manny
This day reinforced the power of discipline, patience, and precise execution. The clean afternoon trade rewarded those who stayed out of the morning chop.
Discovery Trading Group Room Preview – Wednesday, August 27, 2025
-
Nvidia (NVDA) Earnings in Focus
-
Reports after the bell; stock is up 35% YTD and 44% YoY
-
First company to surpass $4T market cap (July)
-
Guidance likely to drive the reaction, which could come in below consensus
-
Bearish earnings reaction in 3 of the last 4 quarters
-
Trump reversed China chip ban; Nvidia now pays 15% of China sales to U.S. government
Political Pressure on the Fed
-
Trump seeks to remove Fed Governor Lisa Cook; Cook is refusing and filing a lawsuit
-
White House examining how to influence selection of Fed’s 12 regional bank presidents
-
Reserve bank presidents are reappointed every five years, next round in February
-
Strategy may involve using loyal Fed governors to shift FOMC composition
-
Senate Banking Committee prepping for hearing on Stephen Miran’s nomination to replace Adriana Kugler
Earnings to Watch
-
Premarket: PSTG, Royal Bank of Canada (RY), SJM, Trip.com (TCOM), Williams-Sonoma (WSM)
-
After-hours: Agilent (A), CrowdStrike (CRWD), HP (HPQ), NetApp (NTAP), Nutanix (NTNXZ), Nvidia (NVDA), Snowflake (SNOW), Cooper (COO), Veeva (VEEV)
Market & Macro Notes
-
Crude Oil Inventories at 10:30 AM ET
-
Richmond Fed President Thomas Barkin speaks at 11:45 AM ET
-
ES 5-day average daily range: 70.75 points
-
Whale bias is bearish into the U.S. session open on significant overnight volume
Key ES Levels
-
Resistance: 6656–6661, 6688–6693
-
Support: 6404–6409, 6333–6339, 5827–5832
-
Affiliate Disclosure: This newsletter may contain affiliate links, which means we may earn a commission if you click through and make a purchase. This comes at no additional cost to you and helps us continue providing valuable content. We only recommend products or services we genuinely believe in. Thank you for your support!
Disclaimer: Charts and analysis are for discussion and education purposes only. I am not a financial advisor, do not give financial advice and am not recommending the buying or selling of any security.
Remember: Not all setups will trigger. Not all setups will be profitable. Not all setups should be taken. These are simply the setups that I have put together for years on my own and what I watch as part of my own “game plan” coming into each day. Good luck!

This post goes out as an email to our subscribers every day and is posted for free here around 2 PM ET. To get your real-time copy, sign up for the free or premium version here: Opening Print Subscribe.
Comments are closed