This post goes out as an email to our subscribers every day and is posted for free here around 2 PM ET. To get your real-time copy, sign up for the free or premium version here: Opening Print Subscribe.
Octoberphobia’s Got Teeth, But the Bulls Still Bite Back
Follow @MrTopStep on Twitter and please share if you find our work valuable!
Our View
Octoberphobia is in full swing. After the NFLX sell-off, the ES rallied up to 6788.75 and opened Wednesday’s regular session at 6776.00. It traded 6779.25, sold off to 6773.00, then rallied up to a lower high at 6768.00 at 9:45. From there, it sold off 28.75 points down to 6739.25.
The ES rallied back up to a lower high at 6756.50 at 11:57, then sold off 58.50 points down to 6698.00. It continued dropping to 6690.75 at 1:54, rallied up to 6712.50, and then dropped again to a higher low at 6695.25 at 2:18.
From there, it rallied 47.25 points up to 6742.50 at 3:40, traded down to 6732.50 at 3:46, and then traded 6738 as the 3:50 cash imbalance showed $2.2 billion to buy.
The ES downticked, traded up to 6742.25, then dropped back down to the 6732.50 level and traded 6737.00 on the 4:00 cash close. After 4:00, the ES traded up to 6744.00 as markets waited for TSLA to report Q3 earnings.
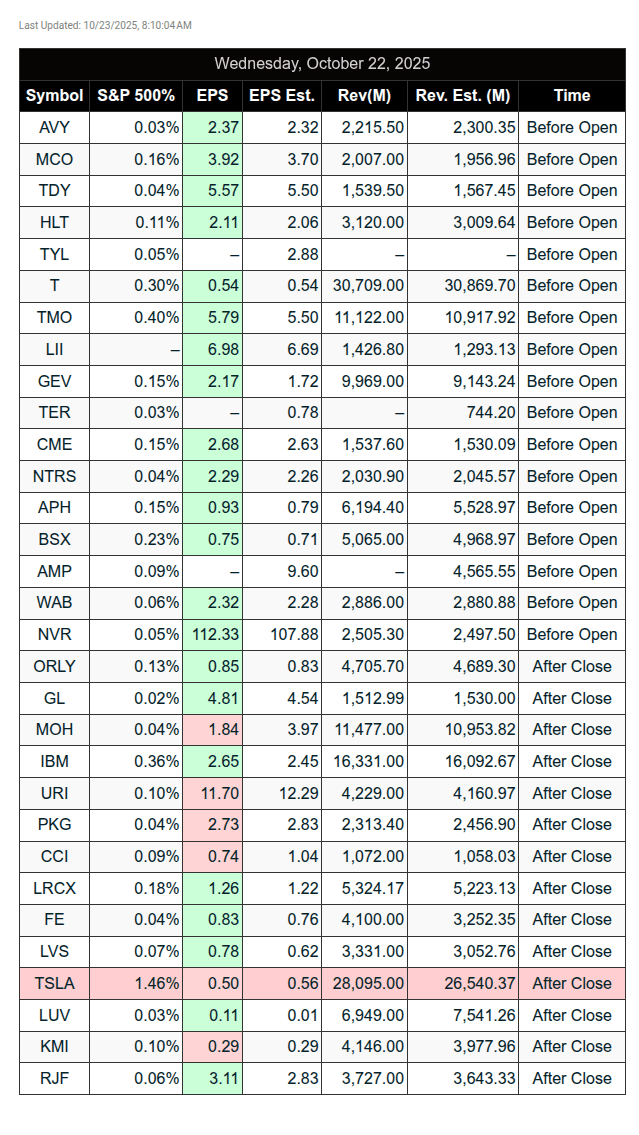
$TSLA Tesla (TSLA) reported mixed third-quarter results on Wednesday after the bell, as the company forges ahead in a post-EV tax credit environment, with investors eyeing robotaxi progress. For the quarter, Tesla reported Q3 revenue of $28.01 billion vs $26.27 billion expected, per Bloomberg, a jump from the $25.18 billion reported a year ago. Tesla posted adjusted earnings per share (EPS) of $0.50 vs $0.54 estimated, translating to EBITDA of $4.23 billion vs $3.78 billion expected.
The ES sold off to the 6731.50 level and settled at 6737.00 on the 5:00 futures close, down 36.25 points or -0.45%, and down 6 out of the last 10 sessions. The NQ settled at 25,039.50, down 255.50 points or -1.01% on the day, and down 7 out of the last 10 sessions.
In the end, it was a shit show of headlines—from the Amazon story, to the government shutdown, to Trump rejecting the Putin summit as a waste of time. In terms of the ES’s and NQ’s overall tone, they both acted okay early but were hit by waves of sell programs. In terms of the ES’s overall trade, volume jumped to 1.9 million contracts—615k contracts higher than Tuesday’s 1.285 million volume.
On Tap
-
12:35 – Fed Governor Michael Barr speaks
-
4:00 – Fed Governor Michael Barr speaks
Our View
Trade fears have been whipping the ES 100 points either side of 6700 for the last several weeks, with most of the uneasiness coming from one source: President Trump. China placed strategic control over exports, particularly through licensing requirements, to send a clear message and secure dominance over a critical supply chain for advanced technologies and defense systems. Even at the risk of disrupting global manufacturing, it puts China in a much better negotiating position.
It really looks like Trump got trumped.
The Chinese state planner knows that by shutting down rare earths to the U.S., it will cause critical shortages of products from cars to semiconductors, paving the way for a period of supply chain upheaval. The China Commerce Ministry said earlier this month that it’s expanding curbs on the export of rare earths and related technologies to prevent the “misuse” of minerals in military and other sensitive sectors.
I have to ask—if you were China, would you supply materials used to make military headwear to the U.S.?
Our Lean
Do you know what CNW means? Crazy, Nuts, and Wild—which is exactly how the markets are acting now and probably for the foreseeable future.
The PitBull said today that he doesn’t think there’s a comparable time frame where headline news moved the S&P around this much. He went on to say he’s been buying GLD the last few days and doesn’t think it’s hit the floor yet. In the ES, he said it’s too whippy to trade and that he’s looking at buying Bitcoin. He has no problem jumping into the most volatile contracts on the board.
When I look at the ES chart, it looks like it’s in a big back-and-fill pattern that should lead to new highs, but the level of headline uncertainty is overshadowing the long side. The real uncertainty is around when Trump will meet Xi at the Asia-Pacific Economic Cooperation (APEC) summit, scheduled to take place in South Korea from October 30 to November 1 in Gyeongju.
The tariff 90-day truce, which began in August 2025, extends the suspension of higher tariff rates until November 10, 2025. None of this is going to be a walk in the park.
Our lean: I think we bounce in the first part of the day, but if the ES starts breaking through the 6730 level, we could see a retest of yesterday’s low. If it can get back above the 6750 level and hold, I think the ES could trade back up to the 6790–6800 level.
From Stock Trader’s Almanac @AlmanacTrader Jeff Hirsch
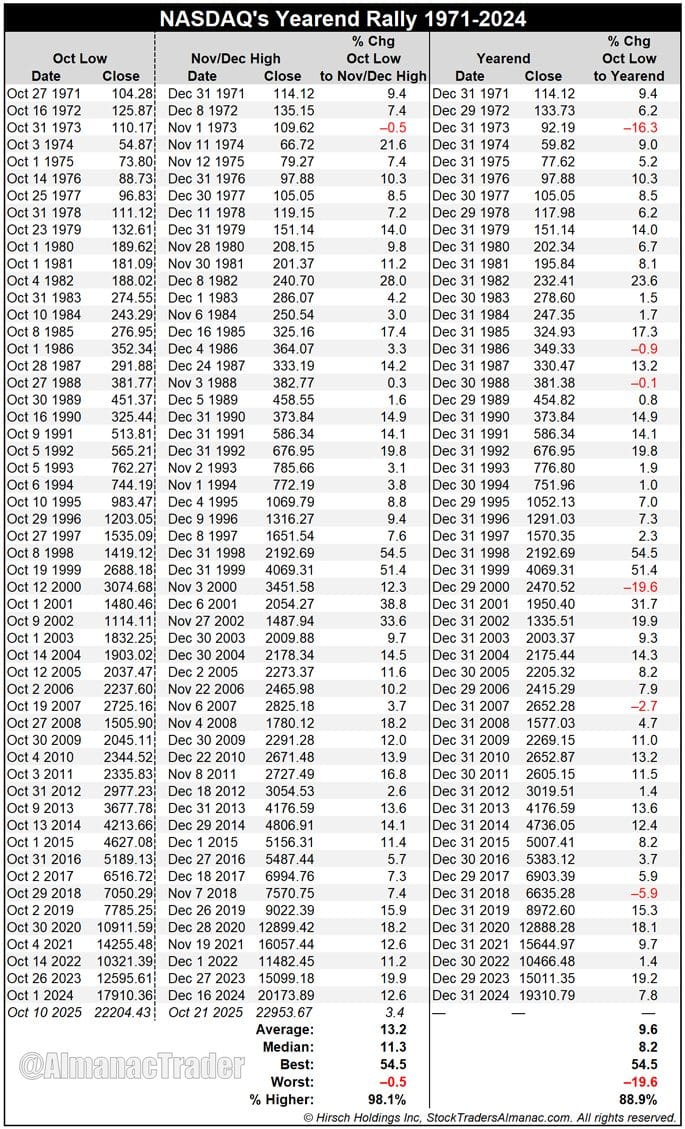
NASDAQ’s Astonishing Year-End Rally
After spiking to nearly 30 last week, the CBOE Vix (aka the fear index) has briskly retreated. This suggests October’s closing lows may have already been set. We define NASDAQ’s Year-End Rally as the gain from NASDAQ’s October closing low through its high close in November or December. Since 1971, there has been a NASDAQ Year-End Rally 98.1% of the time, and its average advance has been a solid 13.2%.
NASDAQ’s best Year-end rally was an amazing 54.5% in 1998, followed by 51.4% in 1999. Even when we review NASDAQ’s performance from the same October low through the last day of the year, NASDAQ has been nearly as strong, advancing 48 of 54 years or 88.9% of the time with an average gain of 9.6%. Only one (1973, Arab oil embargo began October 19.) of the six losses was a post-election year.
Buy in October, and Get Your Portfolio Sober
Octoberphobia has struck again, but fear not. Our Seasonal MACD Buy signal has triggered. Market seasonality has turned bullish, and October has historically been a good time to buy. Our bullish outlook for Q4 remains intact. The market’s pullback has most likely run its course, the seasonal low is likely in, and the market appears to be poised to resume its run to new all-time closing highs.
Don’t delay, click here and subscribe today!

MiM and Daily Recap
Intraday Recap
The ES spent Wednesday under steady pressure as sellers controlled both the overnight and regular sessions, ultimately closing modestly lower for the day.
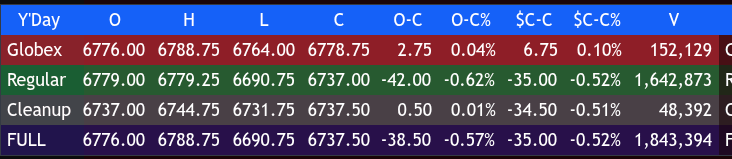
During the Globex session, the futures traded in a range between 6764.00 and 6788.75. The contract climbed early to a high of 6788.75 at 2:48 AM but reversed lower as European trade took hold, dropping to 6756.50 by 7:40 AM. A brief bounce to 6781.75 at 9:10 AM preceded another leg lower into the U.S. open. By the close of the overnight session at 6778.75, ES had gained just 2.75 points from the open, or 0.04%.
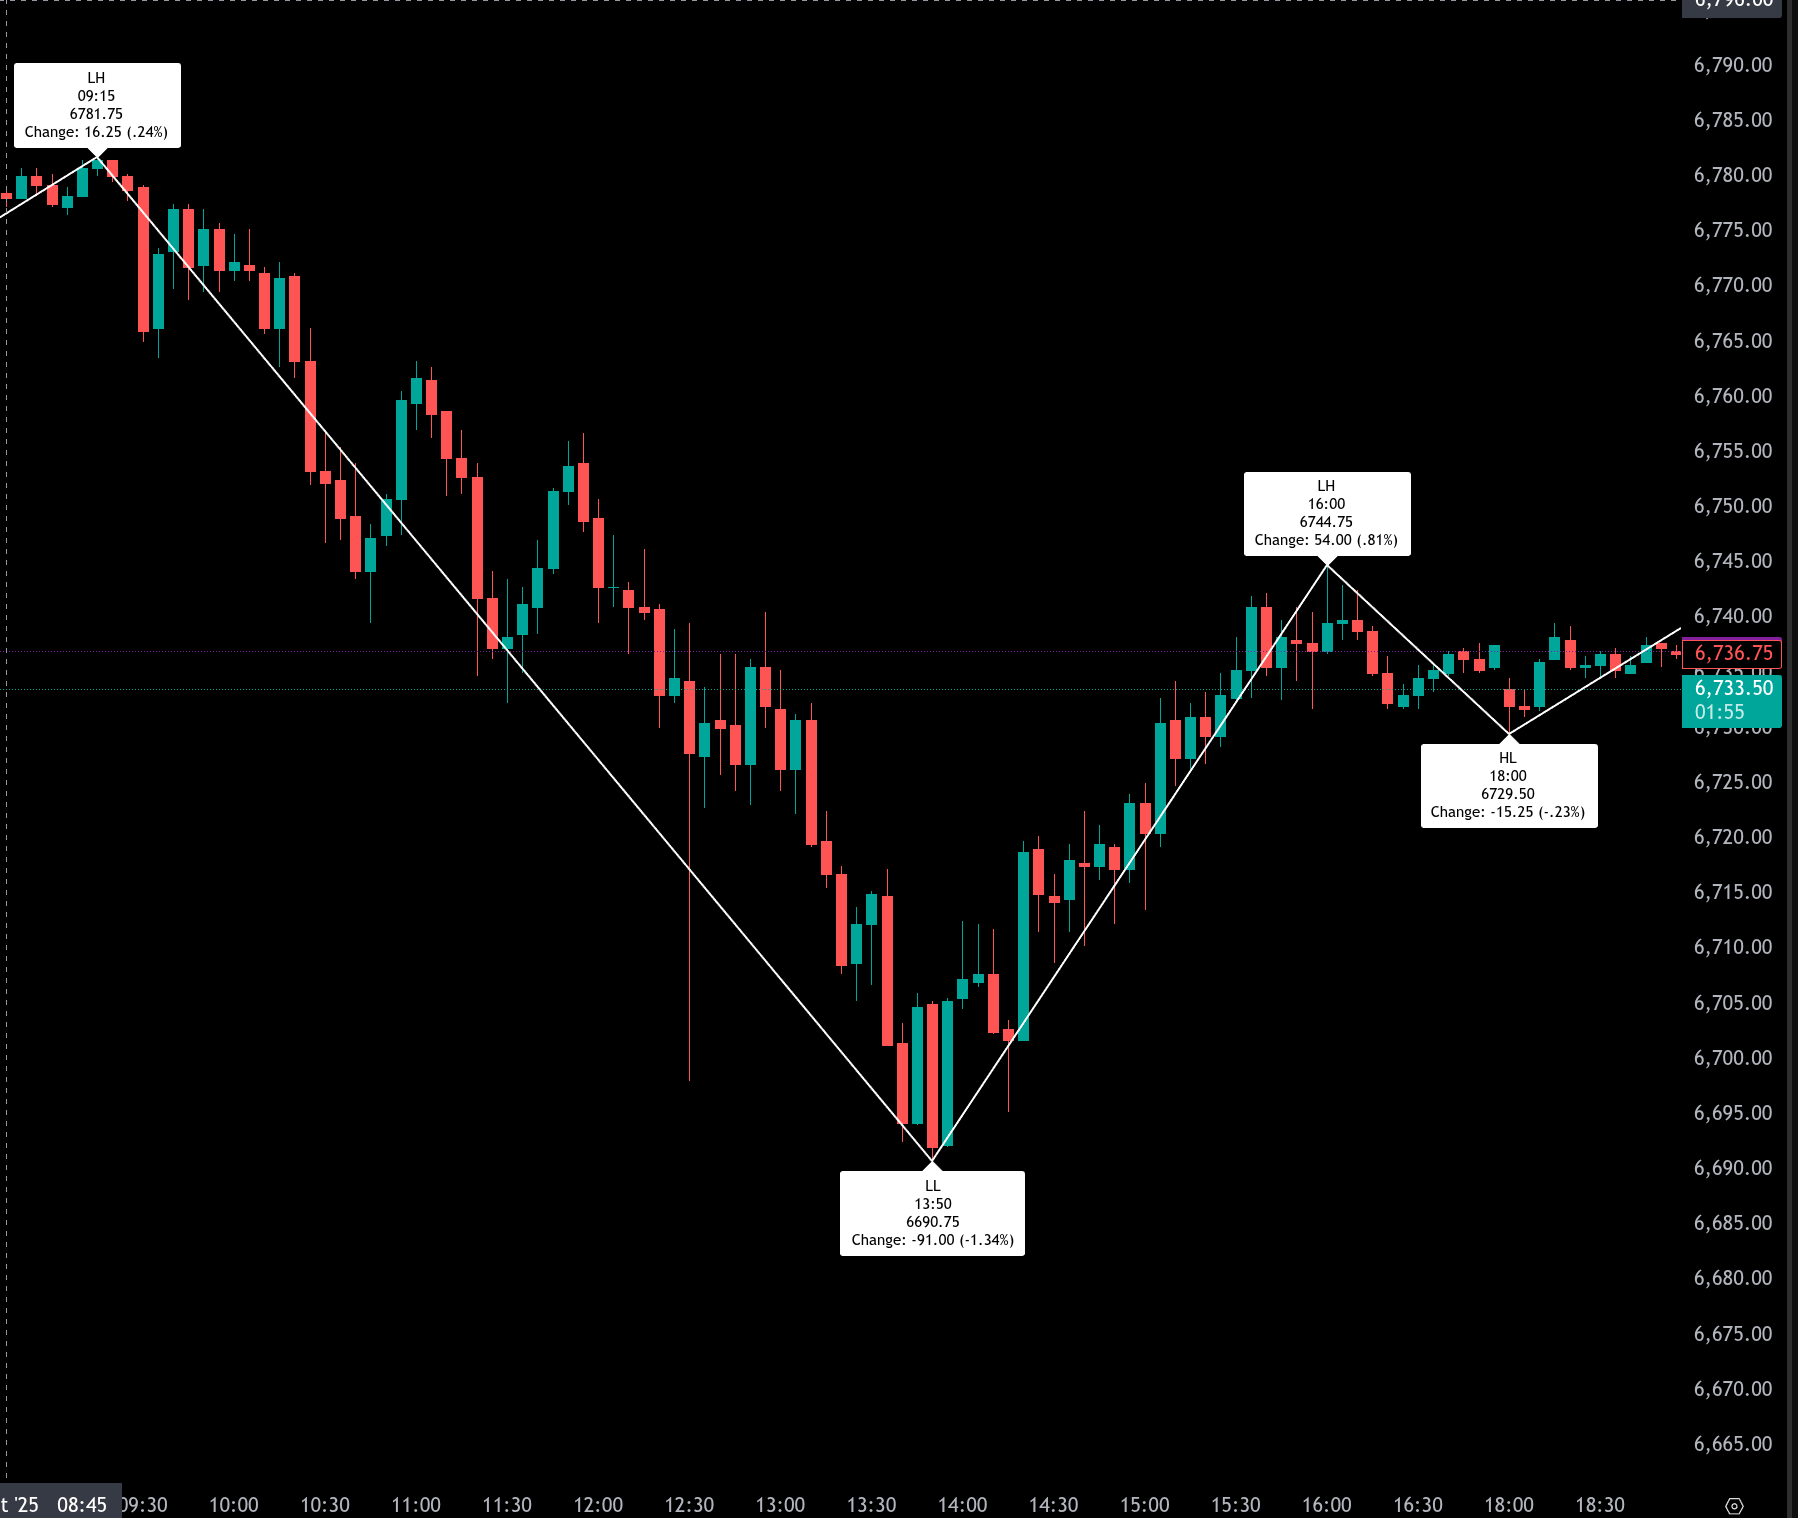
The regular session opened at 6779.00 and immediately struggled to find footing. After a brief uptick to 6779.25 at the open, the index rolled over sharply, establishing a low of 6690.75 at 13:50. That 88.25-point slide from the morning high marked a 1.3% intraday drawdown. Buyers attempted a recovery through the afternoon, lifting ES to 6744.75 at 16:00, but the rebound lost momentum, producing only a lower high. A late pullback to 6729.50 at 18:00 marked the last meaningful move of the day. The regular session closed at 6737.00, down 42.00 points (-0.62%) from the open and 35.00 points (-0.52%) from the prior day’s settlement. Volume was solid at 1.64 million contracts.
After-hours trade was quiet, with the cleanup session seeing a modest 13-point range between 6731.75 and 6744.75. ES settled at 6737.50 for that session, virtually unchanged. Total volume for the full 24-hour cycle reached 1.84 million contracts.
Overall, Wednesday’s trade reflected sustained selling pressure from the prior week’s highs, with each bounce attracting renewed supply. The intraday pattern formed a series of lower highs and lower lows, confirming a short-term downtrend.
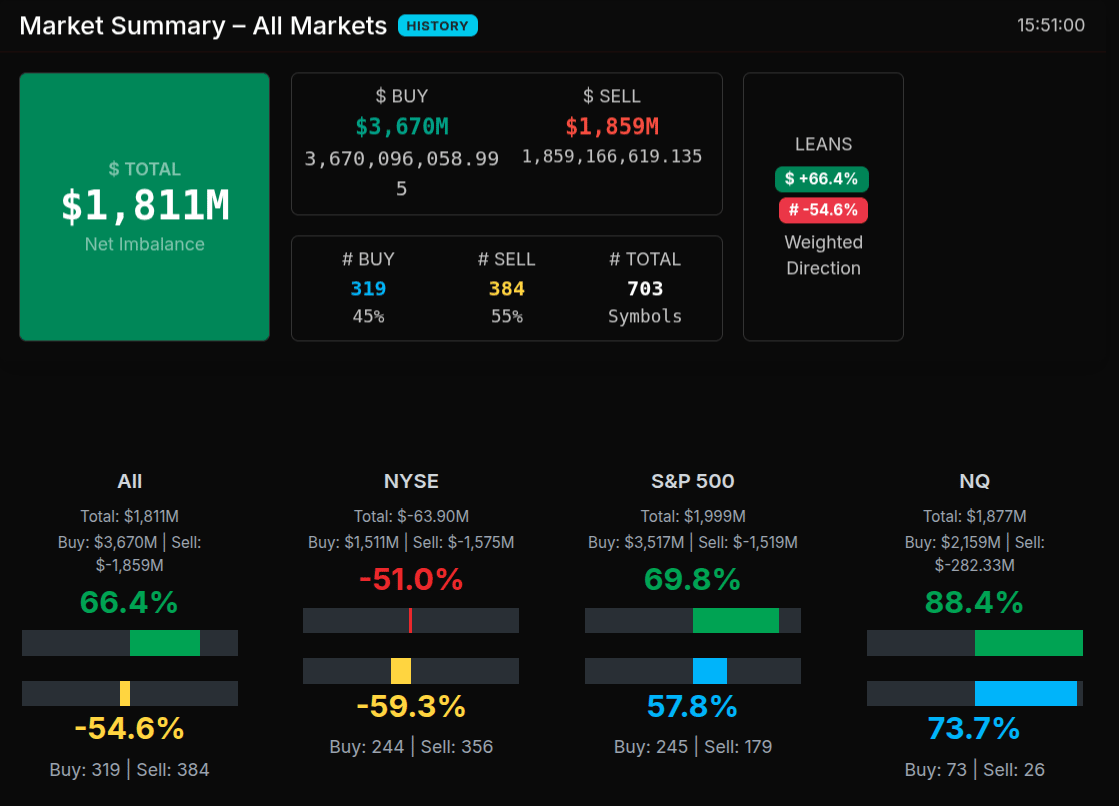
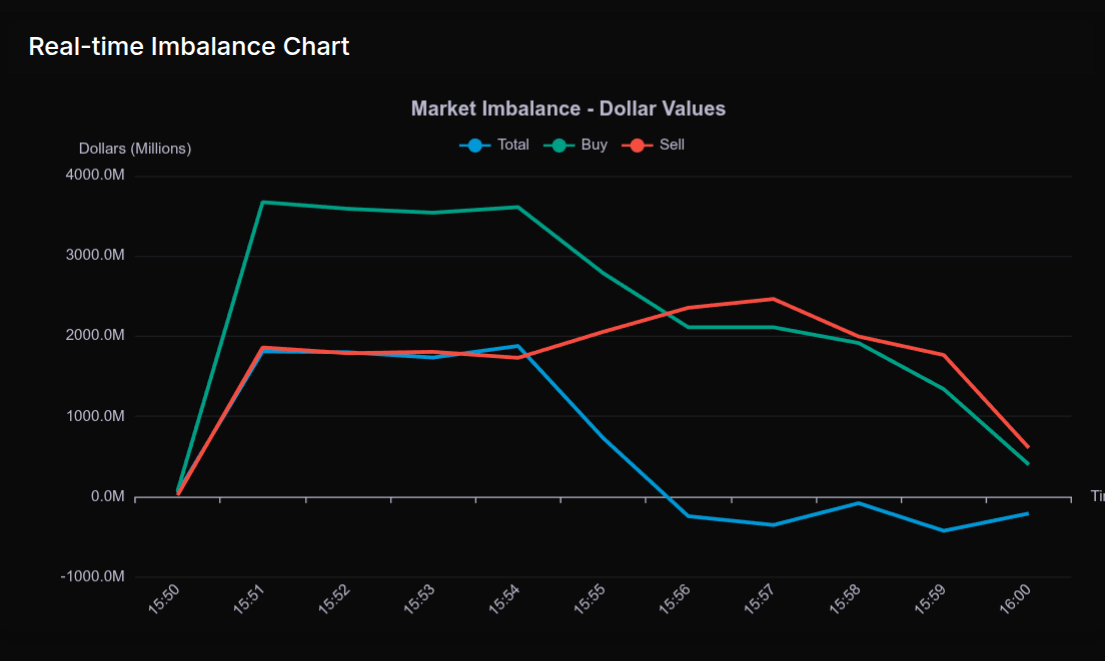
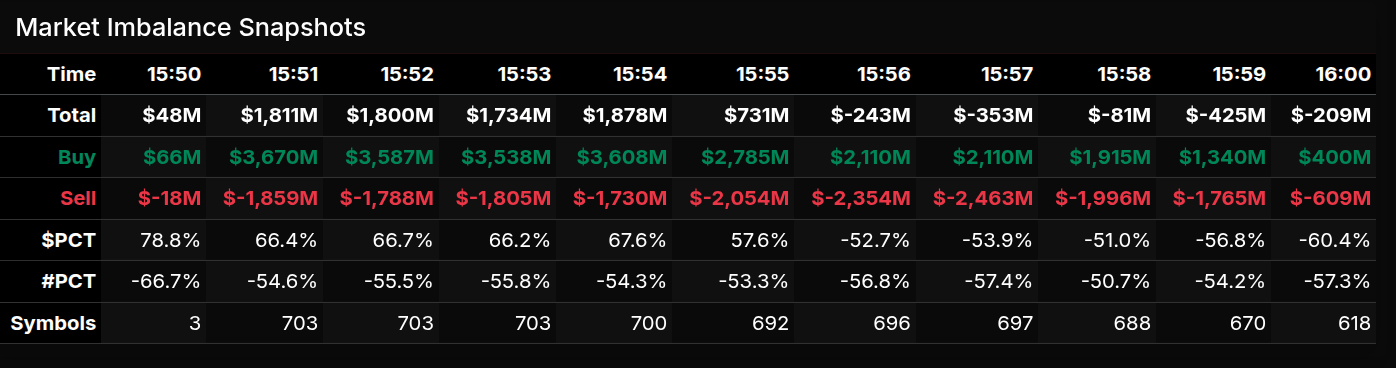
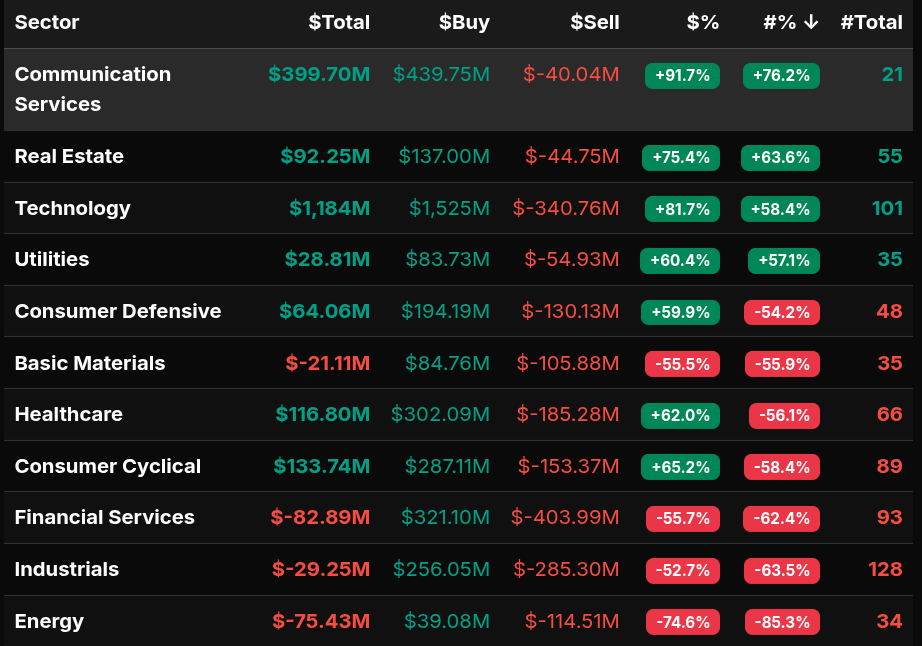
Market tone was bearish throughout the session, with risk appetite fading and buyers unable to hold gains beyond midday. The Market-on-Close (MOC) imbalance data showed a net buy imbalance of $1.81 billion at 3:51 PM, with 66.4% of total flow on the buy side and 54.6% on the sell side by symbol count. Although this leaned marginally bullish on dollar terms, the breadth was still tilted toward sellers, and prices failed to lift into the close.
Sector-wise, strength was concentrated in Communication Services (+91.7%) and Technology (+81.7%), while Energy (-74.6%), Financials (-55.7%), and Basic Materials (-55.5%) showed pronounced sell-side pressure. The Nasdaq futures (NQ) saw a strong 88% buy imbalance, but it had little effect on the ES as selling persisted into the bell.
In summary, Wednesday’s session maintained a defensive tone. The ES lost 0.52% on a cash-to-cash basis, with a clear pattern of lower highs and continued rejection near resistance zones. Buyers showed interest late in the day but failed to reverse the broader decline, leaving the market vulnerable to further downside if overnight demand does not improve.
Guest Posts:
Dan @ GTC Traders
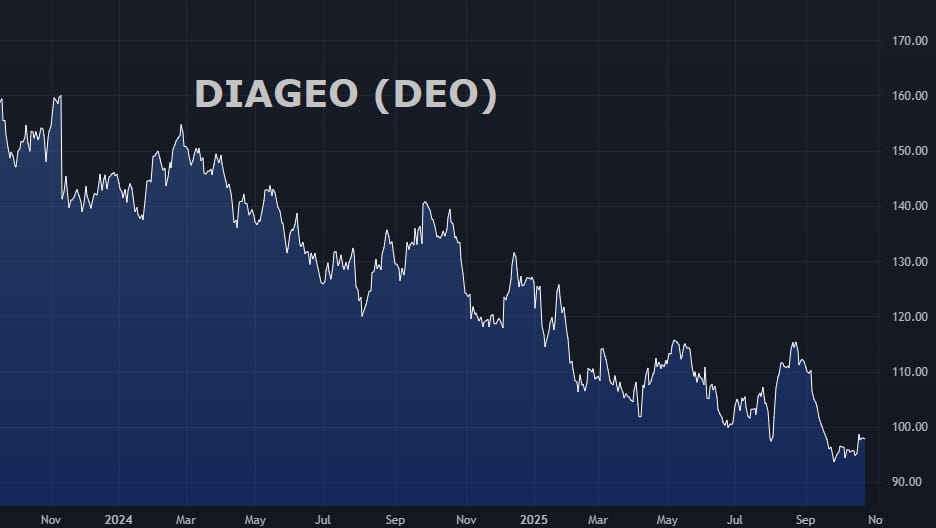
DIAGEO PLC (DEO): A Plan Moving Forward
As we have mentioned as of late? The “Equity Fixed Income” third of the GTC Sample Portfolio is doing rather well …
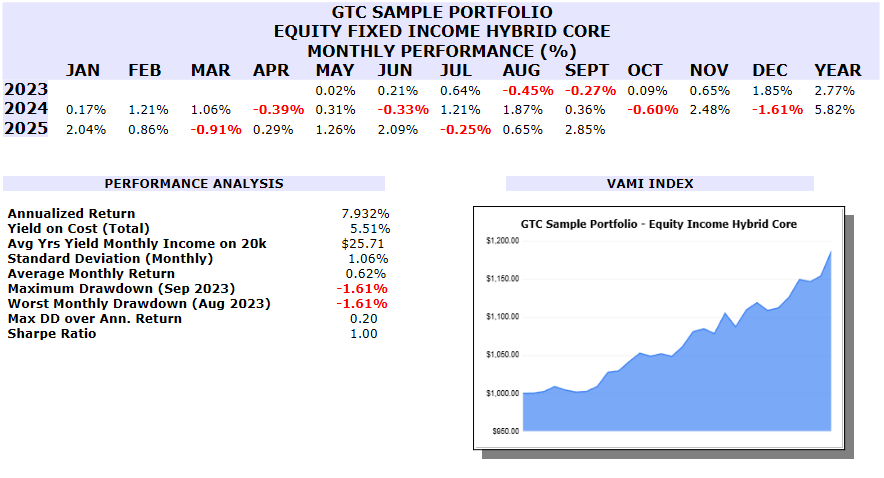
For those of you who are new? The objective of a Fixed Income Account is not large annualized growth, but rather steady income. We accomplish this with this ‘Hybrid’ model of our own invention, as the current assets are yielding 5.51% on cost; while still annualizing 7.932% and a maximum drawdown that is 0.62 times the annualized return, and a Sharpe Ratio of 1.00. ( A usual drawdown is 3x the annualized return )
The return on this small $20,000 sample is currently on average paying about $25.71 per month; far in excess of the cost of the Premium Membership.
Regardless, as we have mentioned in the past? One of our assets here has proven to be a problem child. Diageo PLC (DEO) …
We have mentioned all of this in the past. But we didn’t really have a plan … for moving forward. We simply noted the problem … and have stated we would come up with a plan.
Well … here it is …
DIAGEO (DEO) Below $92.46: If we trade below $92.46 … and the market sells below this overall region with conviction ( that part is the key qualifier ) … then we will say that enough … is enough. We would in this scenario, sell to exit the position. Remember that due to macro considerations? We have made each purchase a half sized position. So this means if the usual full sized position is 6% of available total capital? Our position sizes have been half of that. The beginning account balance was $19,000.00 ( Now at $24,143.99 ). Which means that our beginning half size position size was $570.00 per $19,000.00. So we would view this ‘slot’ for a position open once again, for a $570.00 purchase in the GTC Sample Portfolio, per $19,000.00.
Some may be, and are dealing with much larger accounts. So for larger accounts that have a free cash position opened up of greater than $570.00? But of $50,000.00 per position? 4 Week Treasury Bills could be purchased to replace DIAGEO (DEO).
For small accounts such as the GTC Sample Portfolio? $570.00 worth of a 4 Week, Discount to Yield ETF could be purchased, such as BIL, GSY or SHV.
So to summarize … in this scenario … for the GTC Sample Portfolio? Sell to exit DEO if DEO falls below $92.46 with conviction, and replace with $570.00 per $19,000.00 with one of the discount to yield ETF as mentioned above.
DIAGEO (DEO) Remains $92.46: Simply gives us more time. We have already captured the recent dividend distribution, so our yield on cost will increase slightly. With this time, we can evaluate future earnings, prospects, and determine if this plan needs revised in light of new data.
So at least … as things stand right now? That will be the plan on this particular piece, moving forward.
There is always a problem child somewhere in a portfolio. But it is nice to see the program overall with all of the other pieces, doing so well however.
Until next time, stay safe … and trade well …
Technical Edge
Fair Values for October 23, 2025
-
S&P: 35.49
-
NQ: 152.07
-
Dow: 182.69
Daily Breadth Data 📊
For Wednesday, October 22, 2025
-
• NYSE Breadth: 39% Upside Volume
• Nasdaq Breadth: 41% Upside Volume
• Total Breadth: 41% Upside Volume
• NYSE Advance/Decline: 42% Advance
• Nasdaq Advance/Decline: 30% Advance
• Total Advance/Decline: 34% Advance
• NYSE New Highs/New Lows: 48 / 19
• Nasdaq New Highs/New Lows: 110 / 133
• NYSE TRIN: 1.34
• Nasdaq TRIN: 0.61
Weekly Breadth Data 📈
For the Week Ending Friday, October 17, 2025
-
• NYSE Breadth: 57% Upside Volume
• Nasdaq Breadth: 55% Upside Volume
• Total Breadth: 55% Upside Volume
• NYSE Advance/Decline: 64% Advance
• Nasdaq Advance/Decline: 59% Advance
• Total Advance/Decline: 61% Advance
• NYSE New Highs/New Lows: 230 / 136
• Nasdaq New Highs/New Lows: 564 / 296
• NYSE TRIN: 1.36
• Nasdaq TRIN: 1.15
BTS Levels:
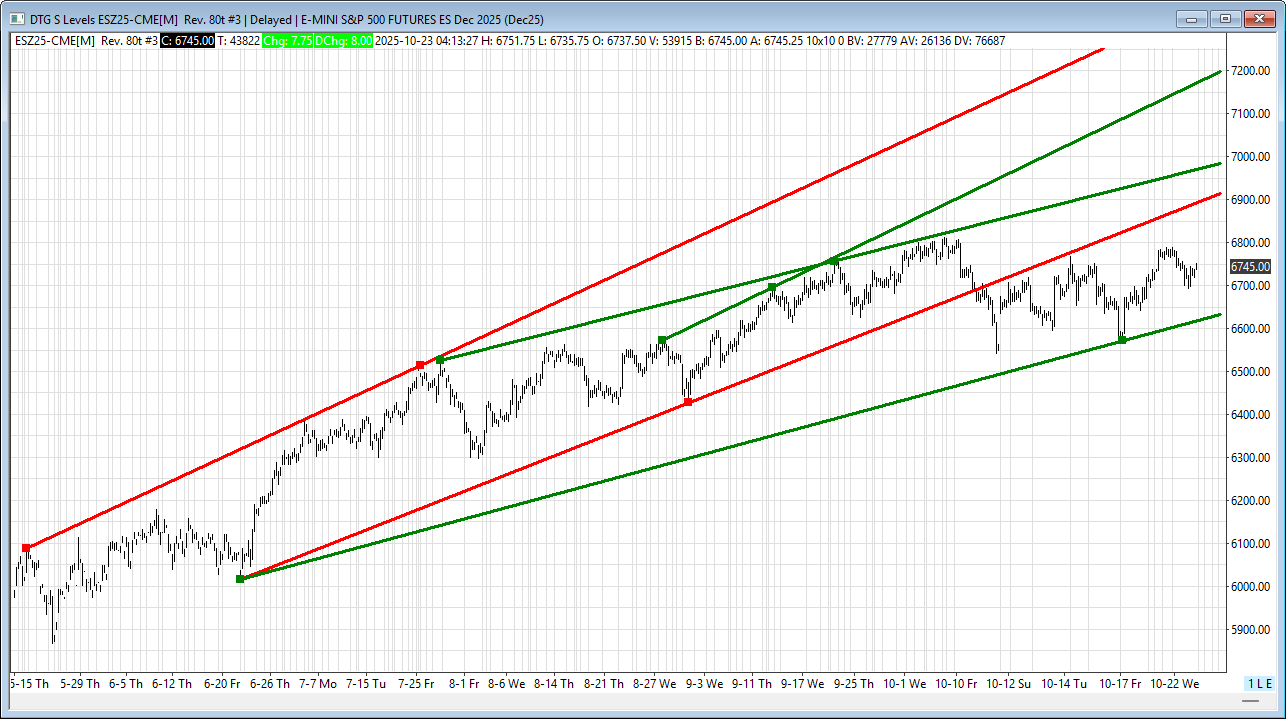
ESZ2025
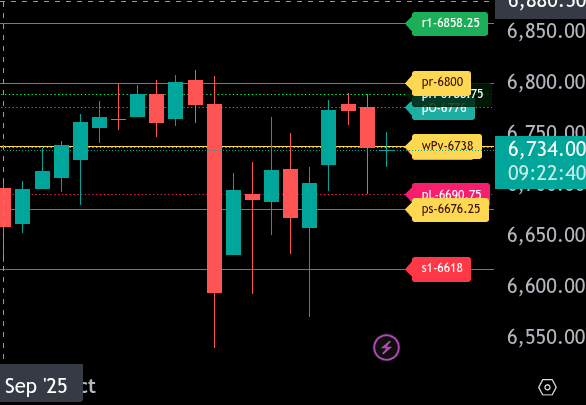
The bull/bear line for the ES is at 6738.00. This is the key pivot that defines today’s bias. Trading above this level favors buyers; remaining below it keeps the tone bearish.
Currently, ES is trading around 6734.25, slightly below the bull/bear line. Continued weakness under 6738.00 opens the door for a test of 6676.25, today’s lower range target. A break below this area could extend losses toward 6618.00, marking deeper support.
If buyers can reclaim 6738.00 and sustain above it, upside momentum targets 6776.00 and 6800.00 as the upper range target. Next higher is 6858.25. Strength through this upper range would signal a potential reversal attempt.
Support zones sit at 6690.75, 6676.25, and 6618.00. Resistance zones are noted at 6776.00, 6800.00, and 6858.25.
Overall, the short-term tone remains cautious while below 6738.00, but reclaiming that level could trigger a push back toward the 6800.00 region.
NQZU2025
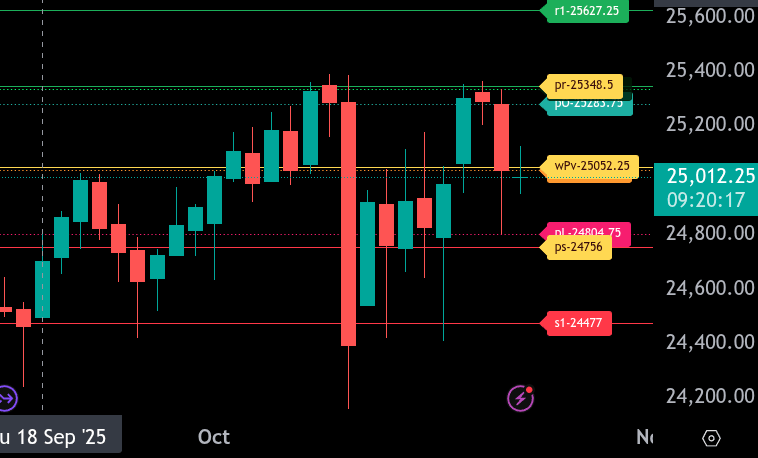
The bull/bear line for the NQ is at 25,052.25. This level defines the intraday bias. Staying above it suggests bullish continuation potential, while remaining below favors sellers.
Currently, NQ is trading near 25,008.00, which is slightly below the bull/bear line, signaling a cautious tone heading into the U.S. session. Sustained trade under 25,052.25 may lead to additional downside toward 24,804.75 and the lower target at 24,756. A decisive break under 24,756 could expose deeper support near 24,477.
On the upside, initial resistance is seen near 25,283.75, followed by 25,348.50 as the upper range target. A strong push through 25,348.50 opens the path toward 25,627.25 and potentially 25,660.25 if momentum accelerates.
Overall, the short-term trend remains neutral-to-bearish below 25,052.25. Bulls need a firm reclaim and hold above that level to shift the tone toward recovery and test the upper resistance zones.
Calendars
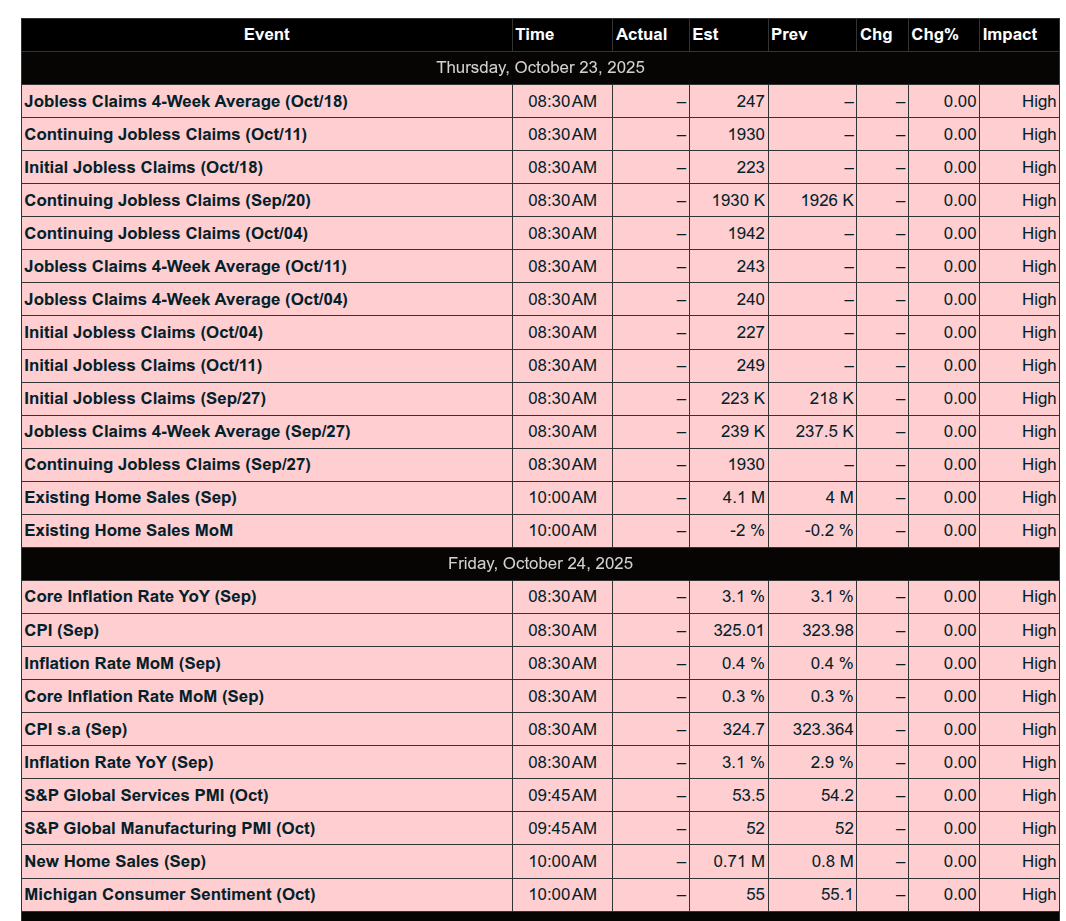
Economic Calendar Today
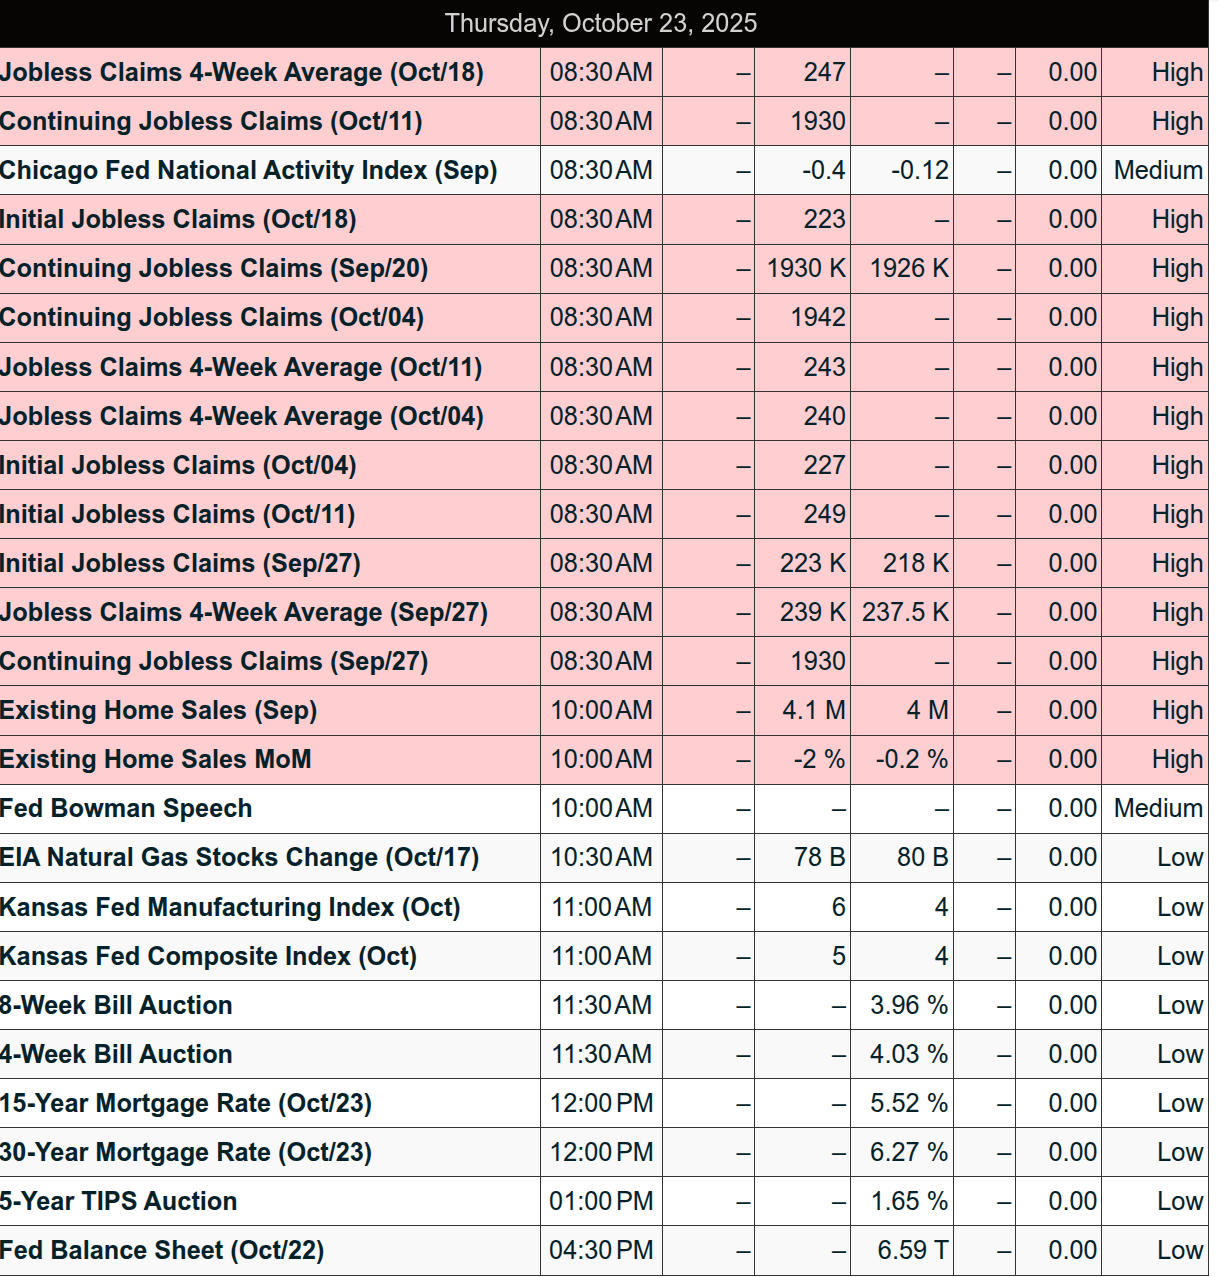
This Week’s High Importance
Earnings:
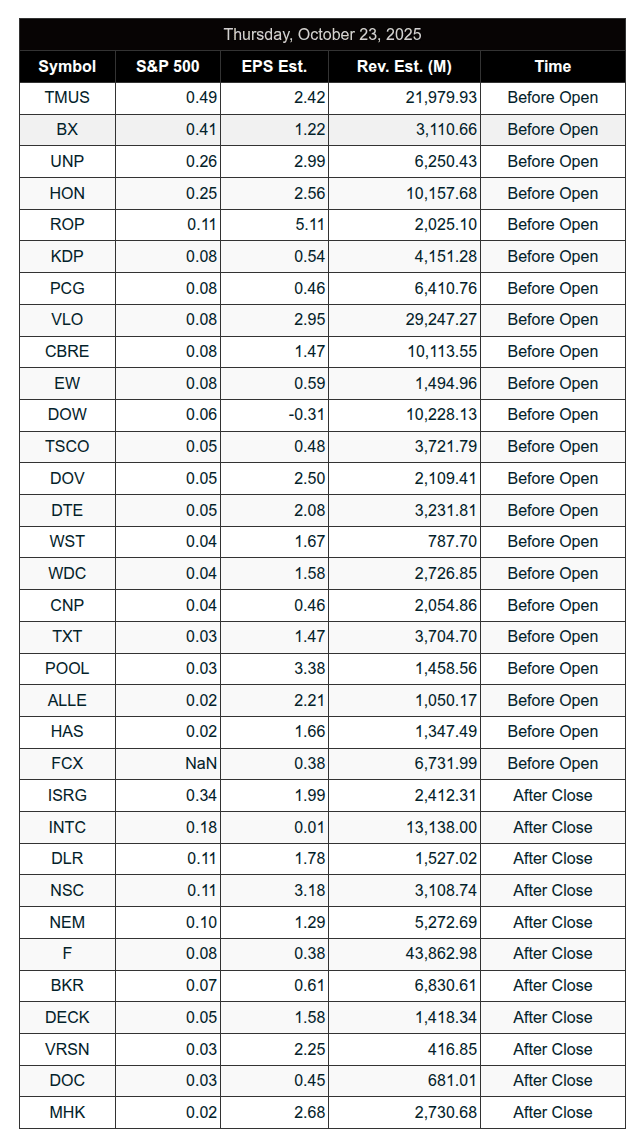
Released
Trading Room News:
Polaris Trading Group Summary: Wednesday, October 22, 2025
The trading day developed as a textbook example of disciplined strategy execution, patience, and adapting to shifting intraday narratives. The room, led by PTGDavid and supported by detailed levels from Manny, navigated a choppy-to-structured market with multiple opportunities on both sides.
Opening Structure & Pre-Market Plans
-
Manny laid out several clear ES setups in the premarket, including key Look Below & Fail (LB&F) levels and continuation long setups. Notably:
-
6756.50 (Support Buy),
-
6766 (LB&F Support),
-
6786.50 (Continuation Long),
-
and 6759 (mid-morning look below & reclaim).
-
-
Emphasis was on statistical intent rather than guesswork – a strong reminder of PTG’s edge-based approach.
Bear Control Early, Breakdowns & Projections
-
The market initially broke to the downside, aligning with PTGDavid’s lean toward shorts under 6765.
-
Key bearish momentum picked up with:
-
Break below 6765, leading to a move toward Cycle Day 1 projected low: 6729.25 (achieved).
-
Confirmation from David: “Bears have ball control.”
-
Traders like Bosier attempted shorts under 68.25, scratching the first attempt but re-engaging below.
-
Key Lesson: Re-engagement on clean breaks and using projected levels (like Cycle Day targets) can keep you on the right side of momentum.
“Money Box” Reversal & Bounce
-
Around 6734, David called out the Zero Gamma Buy Response and “Sweet reversal from Money Box zone.”
-
This marked the pivot of the day – a shift from bearish control to tactical bullish bounces.
-
Traders, including Manny, took the reversal play targeting recovery levels (notably L6701 trade entry).
-
The “Money Box” voodoo delivered again — proving its worth as a high-probability zone.
VWAP Reclaim & The “Whopper”
-
After the bounce, focus shifted to reclaiming the VWAP at 6738, which became the “line in the sand.”
-
David noted building pressure: “Everyone wants the VWAP.”
-
Market finally surged into VWAP and beyond:
-
“Whopper tagged” and “Whopper recovery objective fulfilled” — big win late in the session.
-
Manny: “Best of the week right here – good for 40” — a clear highlight trade.
-
Key Takeaway: Being patient for structural reclaims (VWAP, prior low, gamma zones) provides clean, powerful reversals.
Closing Imbalance & Chop
-
MOC: $2.2B BUY imbalance was ultimately absorbed.
-
Despite the late bid, David predicted a possible “slam session” post-close.
-
Market closed within VWAP zone (as “they wanted”), with some final volatility but no major breakdown.
Highlighted Trades & Wins
-
Manny’s late-day long (6701) off previous day’s setup was a standout — “good for 40.”
-
VWAP reclaim trade yielded the “Whopper” move and showed the power of structure + confirmation.
-
Bear lean early paid off for those following David’s CD1 projection and staying with downside momentum.
Lessons Learned
-
Structure matters: From HIRO put/call imbalance to ATR, gamma, and VWAP zones – the day’s moves aligned closely with defined levels.
-
Reclaim setups (LB&F) continue to offer high-RR trades.
-
Stay flexible: David emphasized “remain flexible to the lean” – critical on reversal days like this.
-
Confirm your data: Bruce’s ATR confusion highlighted the importance of matching instruments (ES vs MES).
Final Thoughts:
A clean example of PTG’s strategic execution. From early short bias to a midday reversal and a textbook VWAP reclaim trade — yesterday rewarded patience, structure, and following plan over prediction.
DTG Room Preview – Thursday, October 23, 2025

Affiliate Disclosure: This newsletter may contain affiliate links, which means we may earn a commission if you click through and make a purchase. This comes at no additional cost to you and helps us continue providing valuable content. We only recommend products or services we genuinely believe in. Thank you for your support!
Disclaimer: Charts and analysis are for discussion and education purposes only. I am not a financial advisor, do not give financial advice and am not recommending the buying or selling of any security.
Remember: Not all setups will trigger. Not all setups will be profitable. Not all setups should be taken. These are simply the setups that I have put together for years on my own and what I watch as part of my own “game plan” coming into each day. Good luck!
This post goes out as an email to our subscribers every day and is posted for free here around 2 PM ET. To get your real-time copy, sign up for the free or premium version here: Opening Print Subscribe.
Comments are closed