Oil Continues to Power Higher. Is the S&P Selloff Over?
We need yields to settle down.
Follow @MrTopStep on Twitter and please share if you find our work valuable.
Our View
I think there is some scary stuff going on and one is crude oil. If the US was to go to war, it would require the use of the US oil reserves. If you recall, crude oil was trading around the $67 level when Trump took office in February of 2017, but after an increase in production during the beginning of the COVID it dropped down to $24.21 a barrel. By April of 2022, crude oil traded up to $110.45 after the Biden administration took office as the Democrats pushed their go-green policy and cut fossil fuel production, pushing prices up dramatically.
Look, the part that bothers me is that the go-green policies totally overlook the geopolitical landscape. First, China is the largest polluter in the world and while they say they are moving away from fossil fuel, I say it’s all BS. They have been buying commodities and oil at any price since Trump took office. A lot has changed since then, the first being the Russian invasion of Ukraine. The other is all the new alliances that the US are not part of, which include the largest oil producers in the world.
I think the two charts by Crescat Capital speak louder than words, US oil reserves are at a historic low and demand is at the highest level in years.


I think there are a lot of other things to be concerned about: higher interest rates, Moody’s bank downgrades, the billions in defaults from commercial real estate, inflation, and the possibility of WWIII. I always said Pitin would not get stepped on forever and with the Black Sea closed and the Saudies cutting production and the US ramping up its military presence in the Persian Gulf and taking on China, should war break out crude oil could easily go to $150 or even $200.
Our Lean
Our lean, while I think we can see higher prices, I also think it’s best to look at the average rally off a new low. Last Friday, the ES rallied 55 points before selling off and on Monday the ES rallied 48 points off its low before reversing 60 points.
At the Globex high of the current session, the ES has rallied 54 points off of yesterday’s low. Is that setting up for a sell?
I’ll admit, I don’t know that it’s a pattern yet, but it looks that way. My guess is any 50 to 60 point rally off a low would be a potential short.
Our Lean: Yesterday, the 4493 to 4503 area finally gave way and the ES traded down to 4482, just below our 4485 support level. It bounced and closed significantly higher, up near 4520. That said, the short-term trend has been lower and while the bounce can continue, the momentum remains with the sellers.
On the upside, let’s see if the ES can push into the 4550 to 4560 area. That has been resistance and would be a reasonable area for sellers to step in. If they push it above this zone, it could put 4576 in play, followed by 4597.50 to 4600.
On the downside, the low-4500s remain support.
MiM and Daily Recap
The ES traded as high as 4541 on Globex, but opened at 4510.75 on Tuesday’s 9:30 open. It up-ticked to 4511.50, then traded straight down and hit 4483.25 at 10:15. From there, the ES bounced 10 points, then traded down to 4482 at 11:05. While the ES did not trade straight up from there, that was the low for the day.
I know I usually do a more prolonged recap, but Tuesday was pretty simple. After the 4482 low, the ES would rally 10-15 points, then give about half of those gains back, then rally 10-15 points and so forth. It was a very steady trend for most of the session. It traded 4519.75 as the 3:50 cash imbalance showed $558 million to buy, traded up to 4522.25 and traded 4517.25 at 4:00. The ES settled at 4517.25 on the 5:00 futures close, down 19.25 points or 0.42% but up 36.50 points off the low.
In the end, the day’s trade fit the “3 parts to the day” rule: down on Globex, sell off after the 9:30 open until about 12:00 and then rallied during the third part of the day. In terms of the ES’s overall tone, it was weak but had a good bounce. In terms of the day’s overall trade, volume was on the high side: 297k ES traded on Globex and 1.33 million contracts traded for a grand total of 1.63 million contracts.

Technical Edge
-
NYSE Breadth: 33.5% Upside Volume
-
Advance/Decline: 36% Advance
-
VIX: ~$15.75
It paid not to panic and freak out yesterday. While the S&P violated last week’s low, that mark was eventually regained and we rallied into the close. Down five of the last six and the bullish momentum has fizzled in the short term.
Yesterday’s pop in bonds is something to watch. The rally let us trim ½ our long position, but if we can continue to get a dip in yields, perhaps there’s a little more juice in bonds (and potentially stocks as well).
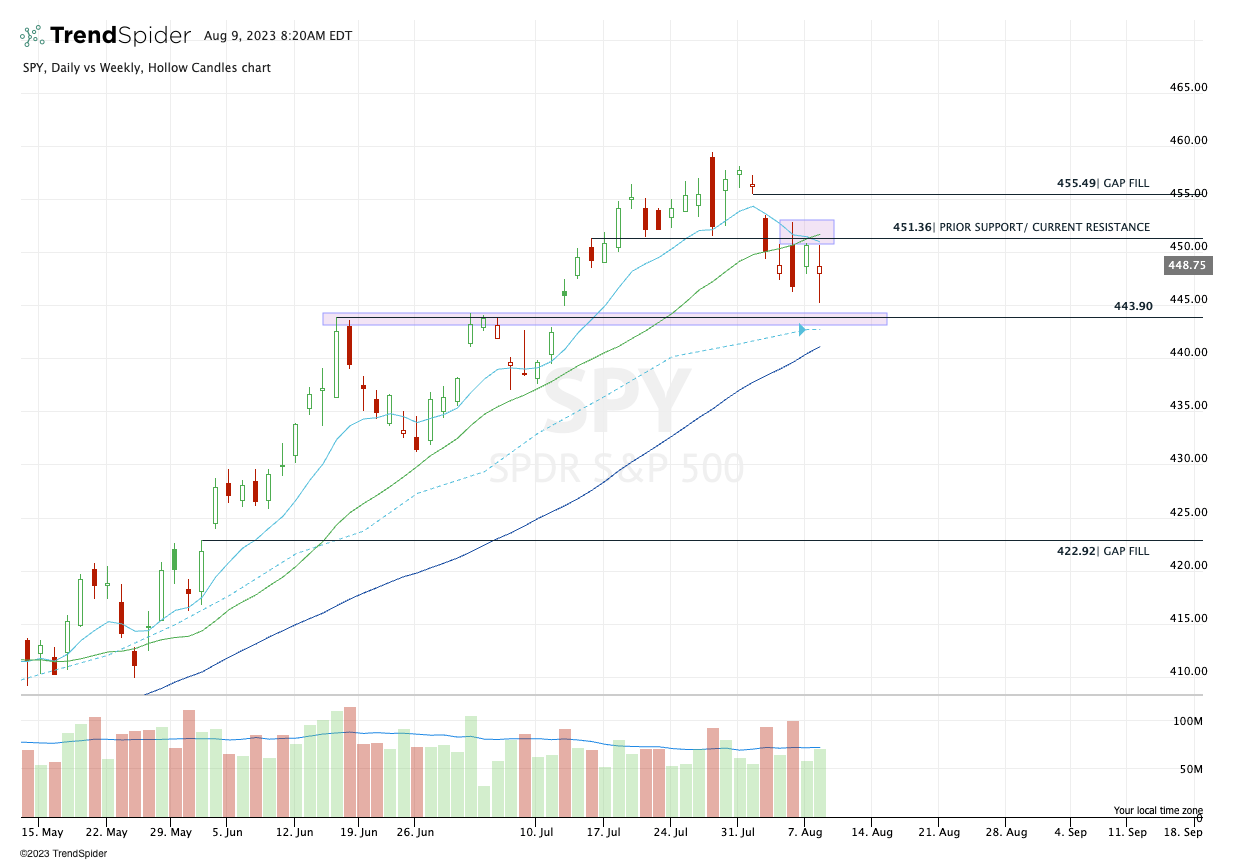
SPY
I would really like to see a back-test of the $443-44 area, along with a test of the 10-week ema and possibly the 50-day sma. That would be healthy price action and give bulls a juicy R/R.
On the flip side, keep an eye on the $451 to $451.50 area. That was prior support and has been stiff resistance for the last four sessions. A close back above the 10-day and 21-day moving averages (and thus $451.50) could open the door to $453, then $455.50 (gap fill).
-
Upside Levels: $451 to $451.50, $453, $455.50
-
Downside Levels: ~$446, $443 to $444
S&P 500 — ES Futures
SPX
-
Upside Levels: 4520, 4535, 4550, 4567
-
Downside Levels: 4475-78, 4464, 4450-55, 4525
S&P 500 — ES Futures
Below is the 1-hour chart of the ES. Keep an eye on the 4535 to 4542 area. A push above this zone puts the much more significant 4550 to 4560 area in play, as well as the 200-sma on the H1.
On the downside, buyers have routinely stepped in around 4505, but overshoots could put ~4495 then ~4485 back in play.

-
Key support: 4493-4503
-
Upside Levels: 4536-42, 4550-60, 4576
-
Downside levels: 4493-4503, 4482-85, 4476, 4450-60
On the 4-hour chart, you can see how the 4490-4500 area is key on the downside, and why a move over 4550-60 could unlock more upside:

NQ
Need to clear 15,425-450 to get a larger push going back to 15,525-550. On the downside, 15,325-340 remains notable, followed by 15,280.

-
Upside Levels: 15,425-450, 15,525-550, 15,610-625
-
Downside levels: 15,325-340, 15,275-80, 15,220, ~15,100
QQQ

I would have loved a test of the 10-week/50-day moving average combo, but what a textbook response from the 61.8% and gap-fill level.
Daily-up over $372.66 could put ~$375 in play. A retest of the low could get us a test of the 10-week/50-day combo.
Guest Post
Topic: Taylor Three-Day Cycle
Author: David D Dube’
Website: https://polaristradinggroup.com/
Prior Session was Cycle Day 3 (CD3): AM Session selling drove price down to CD3 Violation and Range Projection Levels (4485) where responsive bids entered the market and absorbed the supply. Once sellers were “cleaned-up”, initiative buyers took control for the remainder of the session, closing price near highs of the day. Prior range was 59 handles on 1.630M contracts exchanged.
…Transition from Cycle Day 3 to Cycle Day 1
This leads us into Cycle Day 1 (CD1): Having closed near the high of the prior day, bullish momentum may carry price further before the next decline begins. When it does, the Average Decline for CD1 measures 4506 handle. Price is currently near the 5-day Point of Control (POC) balance. As such, scenarios to consider for today’s trading.
Bull Scenario: Price sustains a bid above 4520, initially targets 4530 – 4535 zone.
Bear Scenario: Price sustains an offer below 4520, initially targets 4510 – 4505 zone.
PVA High Edge = 4509 PVA Low Edge = 4485 Prior POC = 4488
*****The 3 Day Cycle has a 91% probability of fulfilling Positive Cycle Statistics covering 12 years of recorded tracking history.
For more detailed information for both bullish and bearish projected targets, please visit: PTG 3 Day Cycle and/or reference the Cycle Spreadsheet below:
Link to access full Cycle Spreadsheet > > Cycle Day 1 (CD1)

Thanks for reading,
PTGDavid
Open Positions
Bold are the trades with recent updates.
Italics show means the trade is closed.
Any positions that get down to ¼ or less (AKA runners) are removed from the list below and left up to you to manage. My only suggestion would be break-even (B/E) or better stops.
** = previously mentioned trade setup we are stalking.
Down to Runners in GE, CAH, LLY, ABBV, AAPL, MCD & BRK.B. Now Add META, AVGO, UBER, CRM, AMZN, CVS, AMD, TLT and YM.
-
JPM — Many are long from $143-145. This is a longer term swing. Trimmed $153s, then $157.50+ on 7/24.
-
Down to ½ position vs. Break-even stop. Can make small, ~10% position trim if we see $160+
-
-
ARKK — Long from ~$46 — trimmed near/at $50. Still carrying ⅔ to ¾ of position. Trim at ~$52
-
Added back about ⅓ of our position around $45.50. Keep in mind, there could be room down to the 50-day moving average.
-
-
WMT — went weekly-up from this week’s play — Trimmed above $157.55 and then $158. Down to ½ position with trim at $160+, Trimmed the add portion above $159 (a high of $161.19 on 8/7)
-
Break-even stop, down to ¼ position or less at $162.50
-
-
** XOM — watch for the monthly-up over $108.50. Is it finally ready to go? If so, $104 is a reasonable stop-loss.
-
TLT — long from $95.63 (daily-up) — Trimmed ~½ at $97+. Looking for $97.50+ for next ¼ trim
-
Break-even stop
-
Go-To Watchlist
Feel free to build your own trades off these relative strength leaders
Relative strength leaders →
(Lack of updates here but these names remain my top focus list!)
-
LLY, CAH
-
Energy stocks — VLO, SLB, EOG
-
AI stocks — NVDA, ADBE, SMCI
-
Mega cap tech — META, GOOGL, AMZN
-
Select retail — ELF, LULU, COST
-
Homebuilders ITB — TOL, KBH, DHI
-
BRK.B (new all-time highs)
-
CAT
-
Cruise stocks — RCL, CCL
-
DAL, DT, AMAT
Relative weakness leaders →
-
DIS
-
CF, MOS
-
PFE
-
EL, FL, DG
Economic Calendar

Disclaimer: Charts and analysis are for discussion and education purposes only. I am not a financial advisor, do not give financial advice and am not recommending the buying or selling of any security.
Remember: Not all setups will trigger. Not all setups will be profitable. Not all setups should be taken. These are simply the setups that I have put together for years on my own and what I watch as part of my own “game plan” coming into each day. Good luck!
Update your email preferences or unsubscribe here
© The Opening Print
228 Park Ave S, #29976, New York, New York 10003, United States
No responses yet