This post goes out as an email to our subscribers every day and is posted for free here around 2 PM ET. To get your real-time copy, sign up for the free or premium version here: Opening Print Subscribe.
Oil Reserves or Not, This War’s Got the Energy Pit Jumpin’ Like It’s ’87
Follow @MrTopStep on Twitter and please share if you find our work valuable!
FREE Two-Week Offer for the Opening Print Premium. Open up the Lean and other premium features for the next Two Weeks!
Our View
Iran is not giving up, and I don’t think it will. The conflict will continue to overshadow the global market until the attacks stop.
The International Energy Agency (IEA) has proposed the largest release of oil reserves in its history to bring down crude prices that have soared amid the U.S.-Israel war with Iran. France’s finance minister said the Group of Seven advanced economies was prepared to release strategic oil reserves to stabilize the global energy market if necessary.
The remarks came after an extraordinary meeting of the group and as Gulf oil producers cut production amid shipping disruptions in the Strait of Hormuz. The Saudi Aramco chief executive cautioned of “catastrophic consequences for oil markets” the longer the disruption to energy flows continues.
Releasing oil reserves may lower oil prices, but I think it will be temporary.
Our Lean
The yield on the 10-year note closed at 4.135%, the dollar moved higher late in the day, and gold jumped 2.7%.
The Middle East geopolitical landscape is front and center despite Trump saying the war is almost over. Our lean remains the same. I can’t rule out a further dead cat bounce, but I still think they will get sold.
Again, I am sorry I can’t add to this, but as I have said many times, this remains very fluid and volatile.
Claude AI ES Levels
Resistance
Support
6903.90
6787.25 CLOSE
6892.46
6784.13
6890.08
6782.50
6877.00
6774.89
6867.85
6759.65
6863.98
6753.51
6863.87
6749.17
6851.00
6743.64
6845.68
6740.45
6838.67
6739.54
6836.80
6728.82
6834.96
6724.21
6830.66
6711.08
6820.99
6704.27
6814.50
6664.35
6813.75
6659.67
6813.75
6584.50
6800.58
6788.63

NOTE DATE CHANGE #####
Market Recap
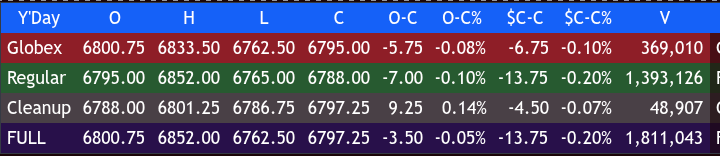
The ES traded down 6762.50 and back up to the resistance at 6833.50 on a bit less volume, with Globex volume of only 520k, and opened Tuesday’s regular session at 6795.00, down 6.75 points or -0.10%.
After the open, the ES traded 6789.25, shot up to 6806.00, then sold off down to 6765.00 at 10:05 and fell into buy program mode. It rallied up to 6835.00 at 11:00, pulled back to 6820.00, and then rallied up to a new high at 6837.50 at 11:40.
The ES then sold off down to 6814.50 at 12:05, rallied up to 6852.25 at 1:35, and quickly sold off down to 6824.50 at 1:39. It rallied up to 6844.00 at 1:50, sold off down to 6791.25 at 2:20, and rallied up to a lower high at 6821.50.
The ES then sold off down to 6782.00 at 3:45 and traded 6785.25 as the 3:50 cash imbalance showed 1.1B. It traded up to 6789.75, sold back off down to 6779.50 at 3:55, and traded 6788.00 on the 4:00 cash close.
After 4:00, the ES traded 6801.50 at 4:10, sold off down to 6795.00, and settled at 6787.25, down 13.75 points or -0.20%. The NQ settled at 24,982.50, down 8.50 points or -0.03%, the YM settled at 47,745, down 24 points or -0.05%, and the RTY settled at 2550.50, down 3.40 points or 0.13% on the day.
In the end, the trade was up, down, and all around. In terms of the ES’s and NQ’s overall tone, they shook off the early sell-off and spent a good portion of the day going up, but when the headlines about Iran striking Abu Dhabi’s fuel storage hit, crude rallied and the index markets sold off. In terms of the ES’s overall trade, volume was lower at 1.84 million contracts traded.
Unintended Consequences
While the ES has been down 6 out of the last 7 sessions, it doesn’t seem like that is the main focus. Clearly, the markets are more focused on the energy markets, specifically crude oil and reports from U.S. intelligence indicating Iran has begun laying naval mines in the Strait of Hormuz, effectively halting or severely disrupting shipping through the strait, and the threat of U.S. Navy escorts.
Crude oil futures (CLJ26) rallied up to 119.48 Sunday night and fell to 76.73 yesterday, down 42.75 from it’s previous level until the headlines hit the tape that the largest oil refinery in the Middle East, located in the United Arab Emirates, was hit by Iranian drones around 12:30 ET, pushing the future up to the $88.00 area just after 2:30.
Iran’s attacks on oil production and shipping are going to be the focal point of the markets until there is a resolution.
BREAKING: UAE’s Abu Dhabi confirms an Iranian drone hit the Ruwais Industrial Complex. Authorities are battling a fire at the scene but report no injuries. Ruwais is the Middle East’s largest refinery complex.
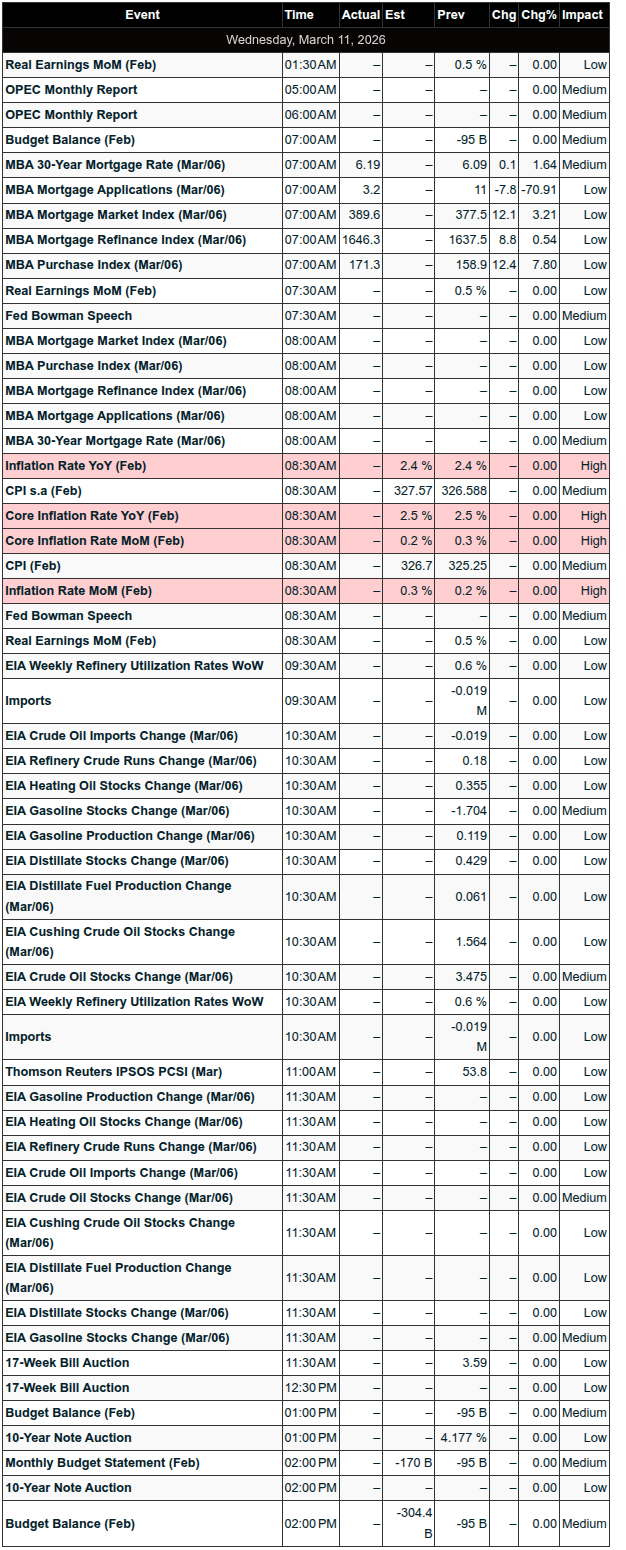
On Tap Today
8:30 am: Consumer Price Index (Feb)
2:00 pm: Monthly U.S. Federal Budget (Feb)
Guest Posts
Polaris Trading Group
Transition: Cycle Day 1 → Cycle Day 2
“The Only Easy Day Was Yesterday”
Cycle Day 1 was the gift.
The market did what it was supposed to do — emotional relief, mechanical responses, opportunistic entries for traders who were patient enough to wait for the decline and disciplined enough to act.
Now that gift is gone.
Cycle Day 2 doesn’t reward hope. It rewards execution.
Just like the SEALs’ mantra, the lesson is simple:
Yesterday’s difficulty is today’s baseline — not today’s challenge.
Cycle Day 2 Mindset
-
Expect harder trade location
-
Expect faster punishment for mistakes
-
Expect fewer, higher-quality opportunities
-
Demand better execution than yesterday
This is where traders either:
-
Lean on process
-
Or get exposed by emotion
Cycle Day 1 rewarded those who waited and executed at the correct time.
Cycle Day 2 rewards those who stay sharp after being right.
Because in markets — just like in elite training —
The only easy day was yesterday.
🎯 Cycle Day 2 — Scenarios in Play
🟢 Bull Case — Buyers Stay in Control
Acceptance north of 6800 ±5
Upside objectives:
• 6840
• 6830
• 6820
Momentum remains constructive as long as price holds above the pivot zone.
🔴 Bear Case — Rotation / Reset
Acceptance south of 6800 ±5
Downside objectives:
• 6780
• 6770
• 6760
Failure to reclaim the pivot opens the door for a controlled reset, not panic.
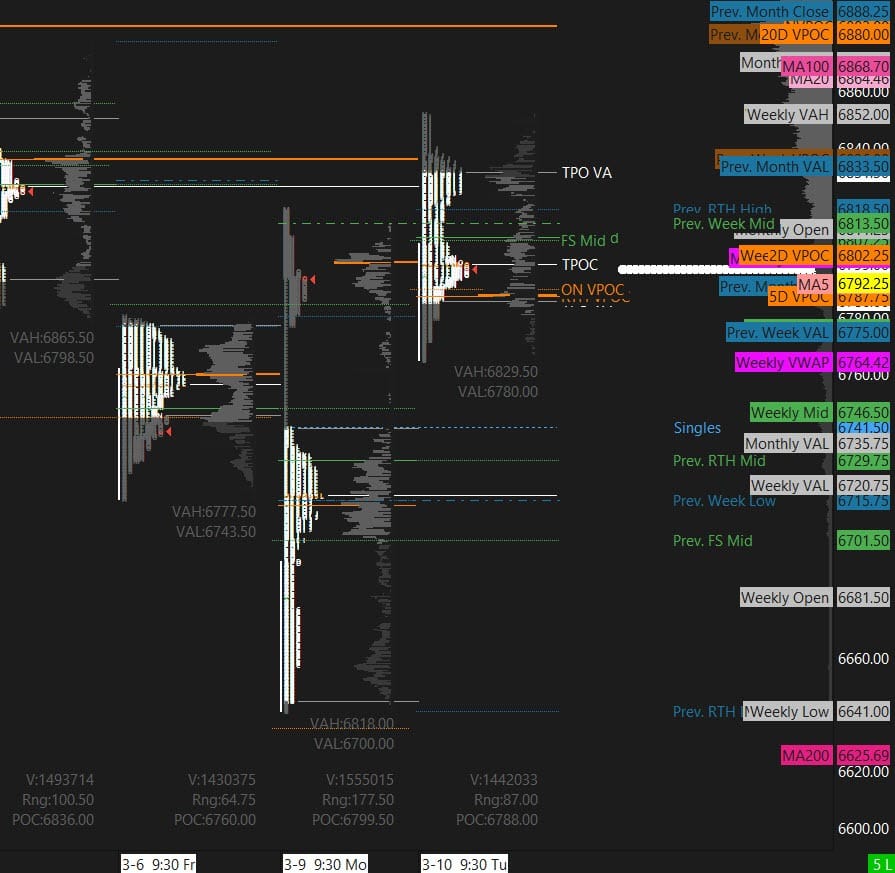
📊 Key Reference Levels
• PVA High Edge: 6830
• PVA Low Edge: 6780
• Prior POC: 6788
— PTG
MOC Recap
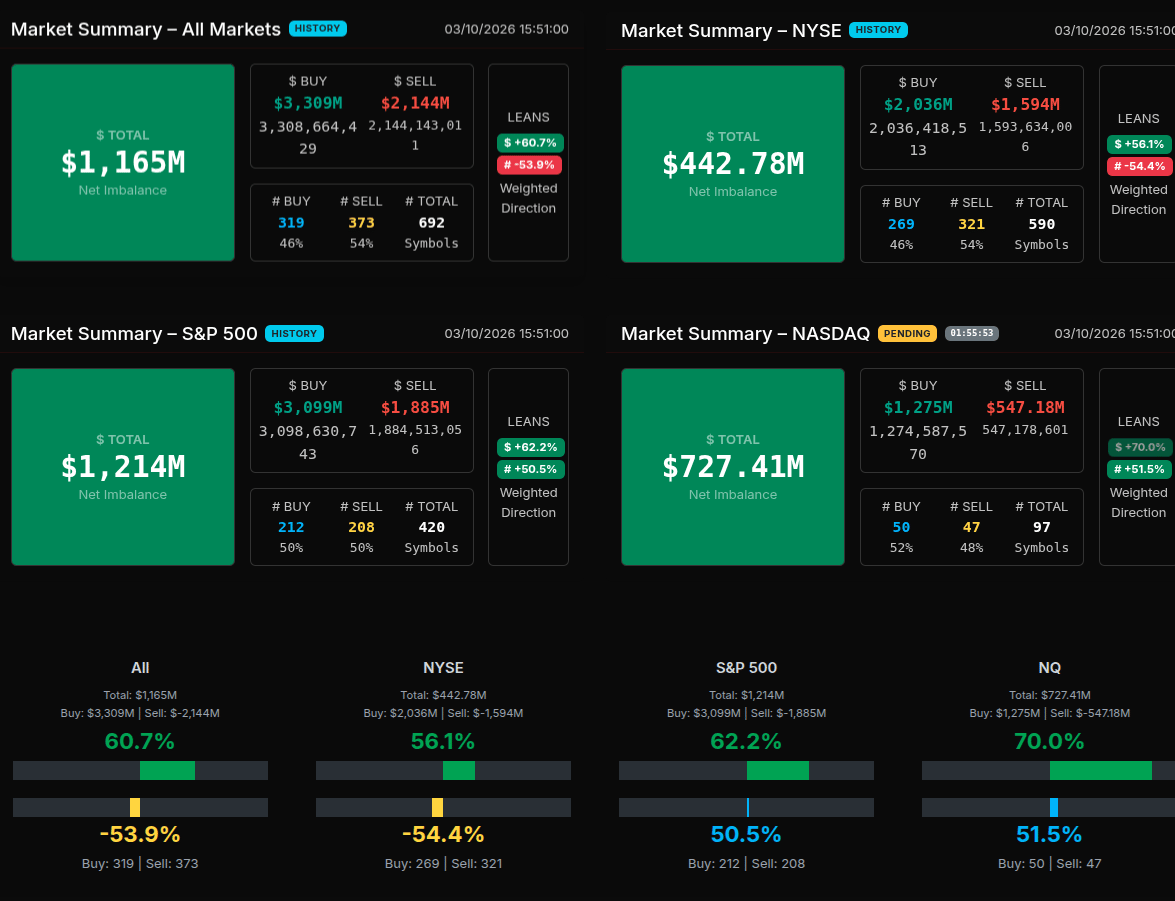
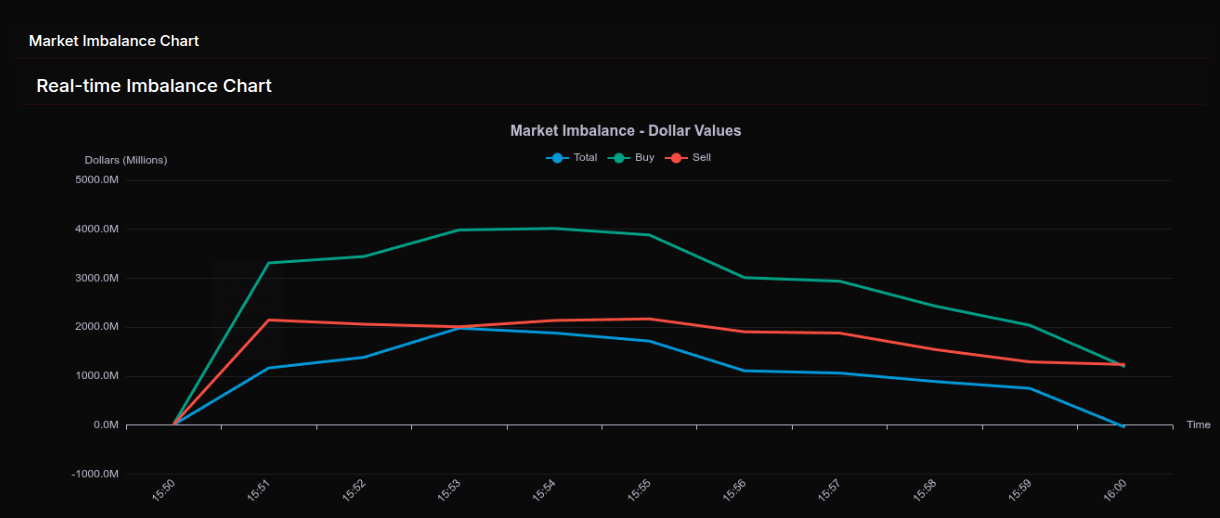
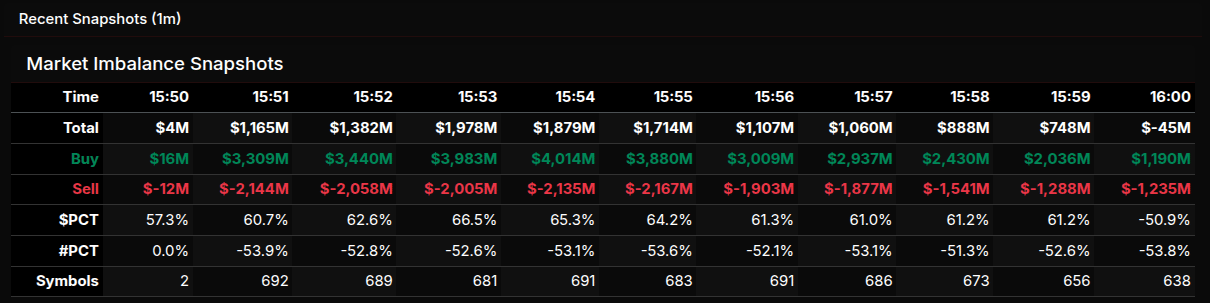
The closing auction on March 10 developed with a clear buy-side bias early in the imbalance window before gradually rotating into a more balanced finish. At 15:50, the market opened with a modest $4M net buy imbalance, but the tone quickly strengthened as buy interest surged. By 15:51, the imbalance expanded sharply to $1.165B with buy orders reaching $3.3B against $2.14B in sells, setting the stage for a buy-leaning close. The imbalance continued to build into 15:53 where it peaked near $1.98B as buy orders approached $4B. During this phase the percentage lean reached roughly 66.5%, signaling a strong directional institutional bid rather than simple rotation.
After that peak, the imbalance began to steadily contract. From 15:55 onward both buy and sell liquidity declined, with buy interest fading faster than earlier in the window. The total imbalance compressed from $1.7B to under $750M by 15:59 before flipping slightly negative into the close at –$45M. This late shift suggests closing cross participation absorbed most of the earlier demand, leaving the auction balanced at the final print.
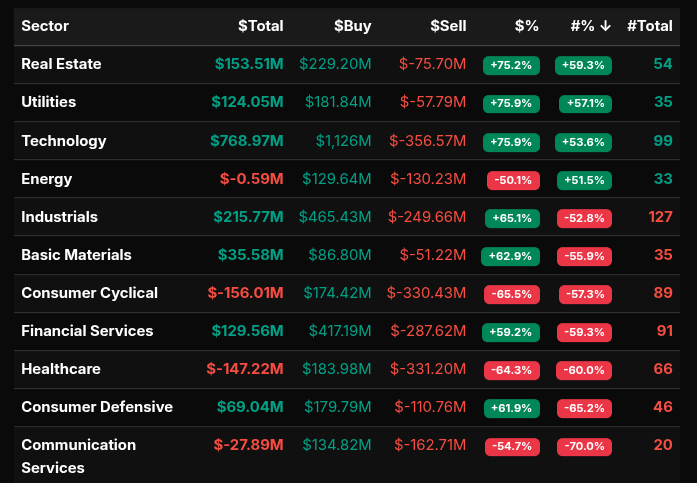
Sector activity revealed where the strongest institutional flows were concentrated. Technology dominated the tape with $768.97M in net imbalance and a 75.9% buy lean, reflecting broad accumulation across large-cap software and semiconductor names. Utilities and Real Estate also showed aggressive buying with 75%+ lean readings, levels that indicate wholesale market-on-close buying rather than rotation. Industrials posted $215M of net demand with a 65% buy lean, just below the wholesale threshold but still reflecting strong institutional participation.
Conversely, several sectors showed distribution. Consumer Cyclical (–65.5%), Healthcare (–64.3%), and Communication Services (–54.7%) leaned toward selling pressure, although these readings were closer to rotational flows rather than outright liquidation.
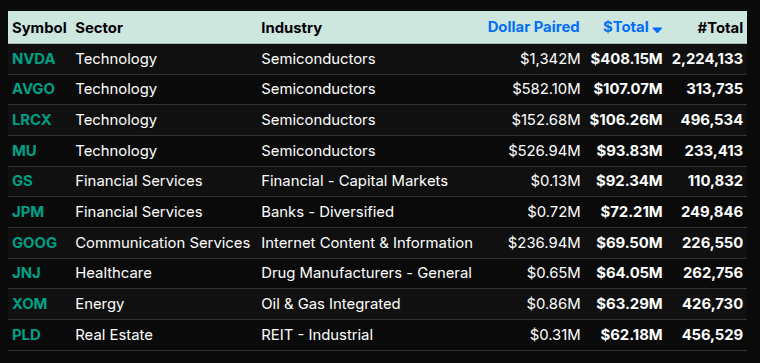
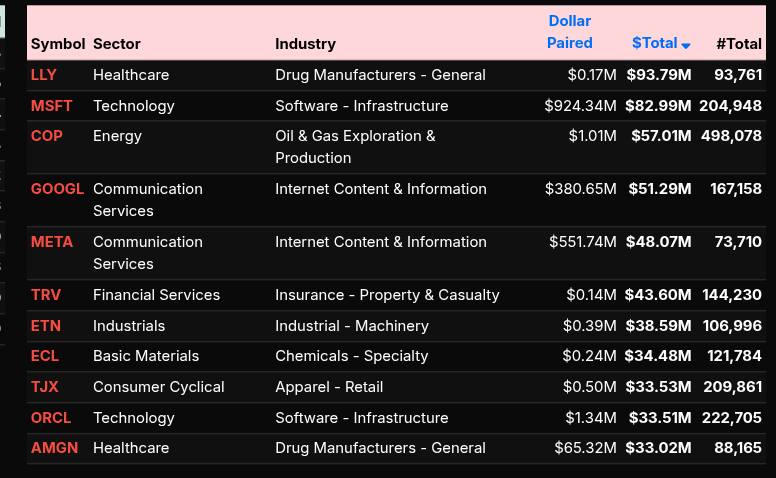
At the symbol level, the largest sell imbalances were concentrated in LLY, MSFT, COP, GOOGL, and META. On the buy side, NVDA led with over $408M paired, followed by AVGO, LRCX, MU, GS, JPM, GOOG, JNJ, XOM, and PLD. The strong presence of semiconductors and financials on the buy list reinforced the broader institutional bid that dominated most of the imbalance window before the final auction balanced out.
Technical Edge
Fair Values for March 11, 2026:
-
SP: 5.15
-
NQ: 24.25
-
Dow: 30.93
Daily Breadth Data 📊
For Tuesday, March 10, 2026
• NYSE Breadth: 43% Upside Volume
• Nasdaq Breadth: 56% Upside Volume
• Total Breadth: 51% Upside Volume
• NYSE Advance/Decline: 47% Advance
• Nasdaq Advance/Decline: 49% Advance
• Total Advance/Decline: 49% Advance
• NYSE New Highs/New Lows: 38 / 39
• Nasdaq New Highs/New Lows: 82 / 118
• NYSE TRIN: 1.18
• Nasdaq TRIN: 0.76
Weekly Breadth Data 📈
For the week ending Friday, March 6, 2026
• NYSE Breadth: 39% Upside Volume
• Nasdaq Breadth: 54% Upside Volume
• Total Breadth: 48% Upside Volume
• NYSE Advance/Decline: 26% Advance
• Nasdaq Advance/Decline: 32% Advance
• Total Advance/Decline: 40% Advance
• NYSE New Highs/New Lows: 320 / 160
• Nasdaq New Highs/New Lows: 318 / 550
• NYSE TRIN: 0.54
• Nasdaq TRIN: 0.39

NOTE DATE CHANGE #####
Trading Room Summaries
Polaris Trading Group Summary – Tuesday, March 10, 2026
The trading day began with overnight price action already achieving the upper 6820 target outlined in the Daily Trade Strategy briefing. The market opened on Cycle Day 1, with the Line in the Sand set at 6775, providing the key structural reference for the session.
Morning Session
-
Early market lean from David was neutral, suggesting opportunity on both sides of the trade ledger.
-
Bears initially held Command & Control with price trading below VWAP and the EMA cluster.
-
Sellers attempted to push the market lower toward the 6765 area.
-
Strong absorption appeared at 6765, signaling that buyers were stepping in aggressively.
-
Once price cleared the 6785 pivot, the structure shifted and bulls regained Command & Control.
-
This triggered a sharp upside reversal and momentum move higher.
-
Tick readings stayed elevated during the advance, confirming strong buying pressure.
-
The early reversal highlighted a key trading lesson:
-
Markets often shake traders out near extremes before making the real move.
-
Avoid the “shoulda, woulda, coulda” mindset and focus on structure and execution.
-
Midday / Cycle Objective
-
The bullish momentum continued once buyers took control.
-
Shallow pullbacks attracted additional buying interest, typical of Cycle Day 1 behavior.
-
Initiative buyers continued bidding price higher throughout the morning.
-
Price ultimately fulfilled the 3-Day Cycle target of 6841.63.
-
The target was achieved almost exactly to the tick, reinforcing the precision of the PTG cycle framework.
-
This move served as another example of:
-
Cycle Day 1 expansion after early absorption.
-
Level-to-level trading using the DTS framework.
-
Afternoon Trade Opportunity
-
Later in the afternoon, a high-probability D-Level setup developed.
-
A PTG trader executed a clean short entry directly at the D-Level.
-
The setup demonstrated textbook execution:
-
Precise entry at resistance.
-
Quick confirmation of rejection.
-
Cover lower as price reverted back toward the mid-VWAP zone.
-
-
David highlighted this as a “Triple-A Trade” and a perfect example of PTG level trading discipline.
Closing Action
-
During the final hour:
-
Price began showing signs of late-day weakness.
-
Momentum slowed as the session moved into the close.
-
-
The closing imbalance showed a $912M MOC Buy Imbalance.
-
Despite the late softness, the day had already completed its primary cycle objective earlier in the session.
Key Lessons from the Day
-
Absorption at key levels can signal major reversals (6765 defense).
-
Reclaiming pivots like 6785 often flips Command & Control quickly.
-
Cycle Day 1 commonly produces shallow pullbacks followed by expansion.
-
D-Level setups continue to provide high-quality trade opportunities.
-
Focus on structure and execution rather than missed trades.
Discovery Trading Group Room Preview – Wednesday, March 11, 2026
-
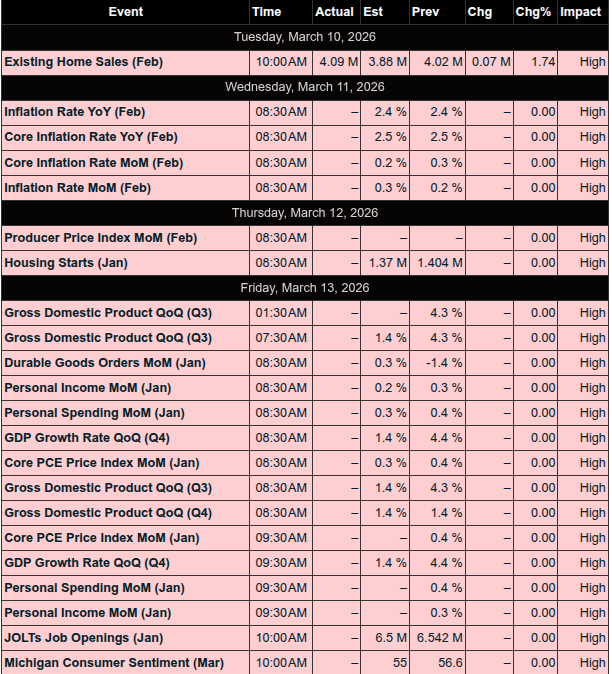
Macro Focus: Markets are watching the Middle East conflict, oil price volatility, and today’s CPI release at 8:30am ET.
-
Oil Market:
-
Oil prices are swinging after reports the IEA may propose a record strategic reserve release (potentially >182M barrels) to offset supply disruptions from the Iran war.
-
Confusion increased after incorrect comments from the U.S. Energy Secretary about a tanker escort in the Strait of Hormuz, later denied by the White House.
-
Diesel markets remain tight, with rising prices posing a larger economic risk than gasoline due to higher transportation and consumer costs.
-
-
Corporate News:
-
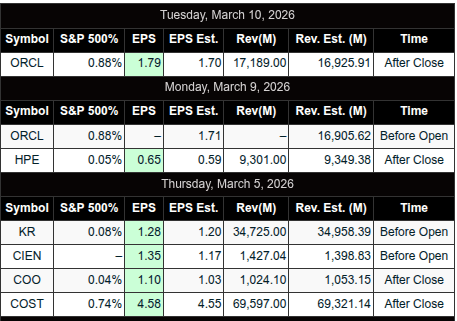
Oracle (ORCL): Shares jumped ~8% after beating earnings and raising 2027 revenue guidance to $90B, driven by AI data center expansion.
-
Nintendo: Shares rose over 10% following strong demand for the new Pokémon Pokopia game on Switch 2, which has sold out at major retailers.
-
-
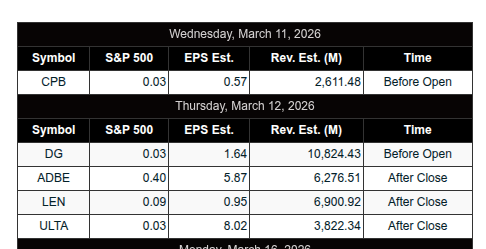
Earnings:
-
Premarket: HMY, KB
-
Thursday: Dollar General (DG), DICK’S Sporting Goods (DKS)
-
-
Economic Calendar:
-
8:30am ET: CPI + Fed Governor Bowman speaking
-
10:30am ET: Crude Oil Inventories
-
2:00pm ET: Federal Budget Balance
-
-
Market Structure / Volatility:
-
Volatility contracted Tuesday as oil eased.
-
ES 5-day average range remains elevated at ~141 points.
-
No clear whale bias overnight; large trader volume was light and mixed.
-
-
Technical Picture:
-
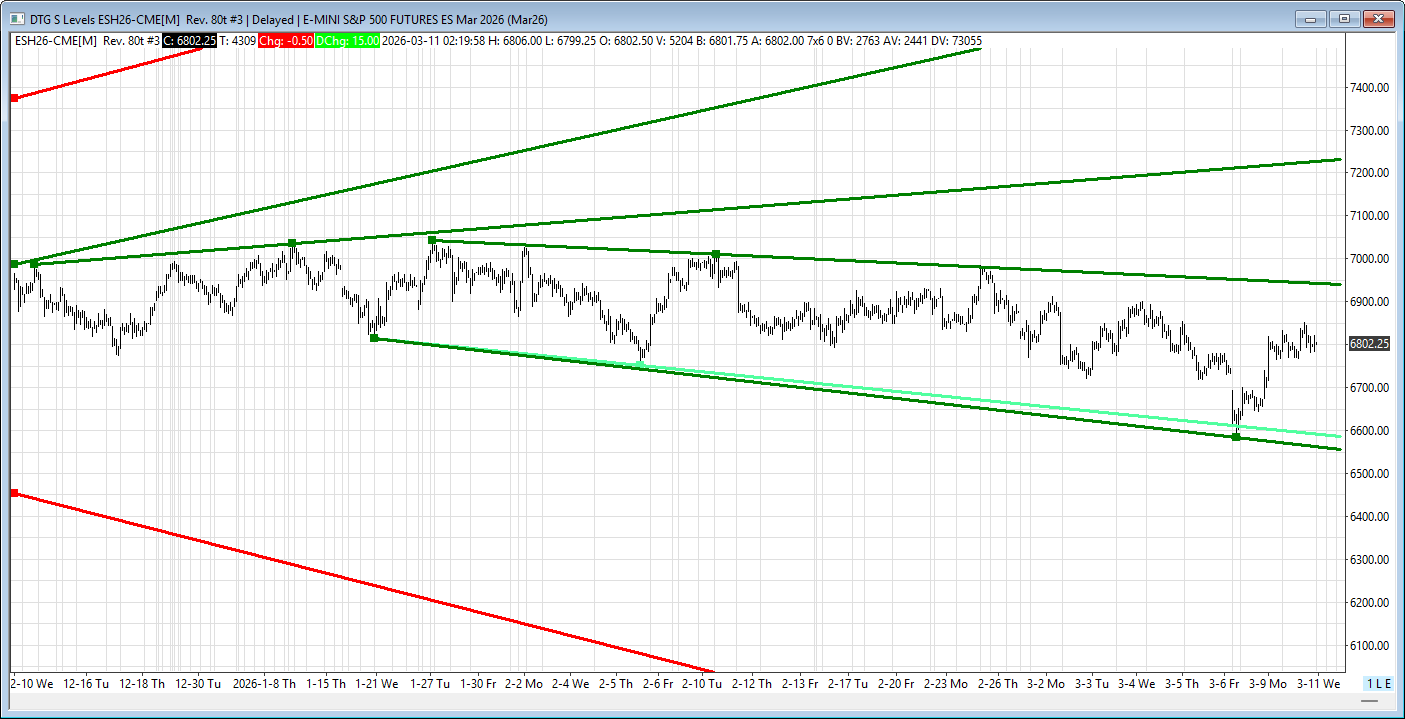
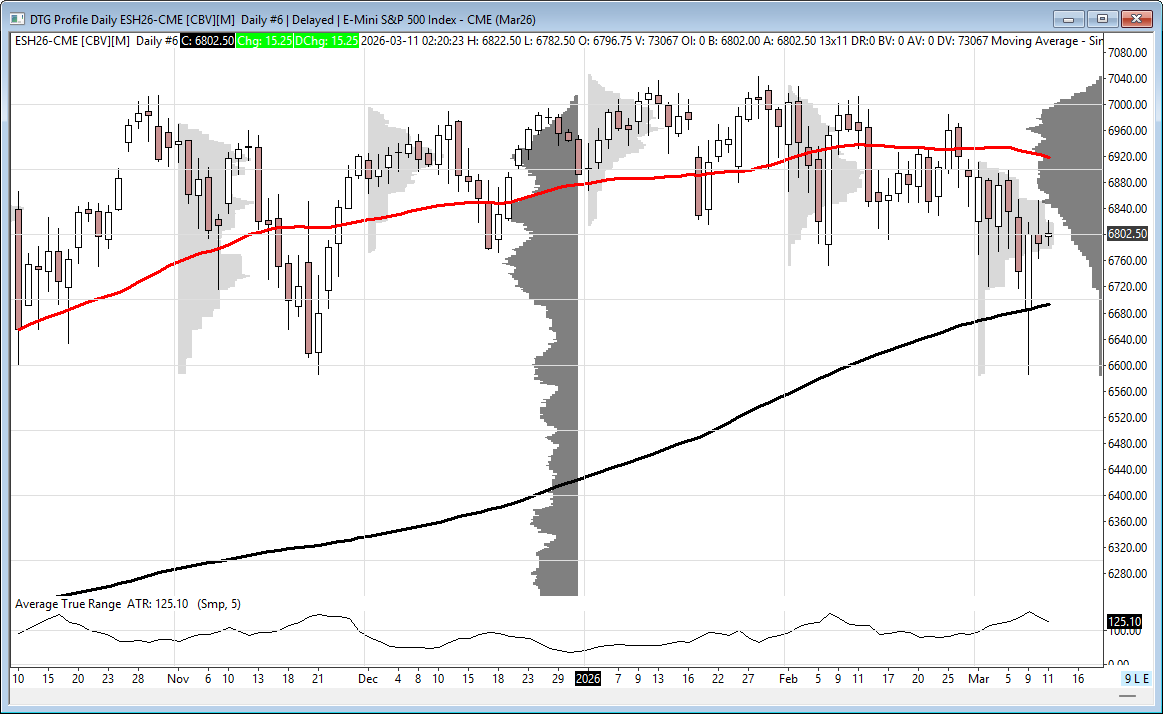
ES remains rangebound between 6600–7000 for ~6 months.
-
50-day MA: 6918 | 200-day MA: 6694, slowly converging.
-
A potential death cross in coming months could trigger bearish algo flows.
-
Despite geopolitical risks, the long consolidation suggests the eventual breakout bias may still be higher.
-
-
Key Levels:
-
Resistance: 6940–6935, 7230–7235
-
Support: 6560–6555
-
Affiliate Disclosure: This newsletter may contain affiliate links, which means we may earn a commission if you click through and make a purchase. This comes at no additional cost to you and helps us continue providing valuable content. We only recommend products or services we genuinely believe in. Thank you for your support!
Disclaimer: Charts and analysis are for discussion and education purposes only. I am not a financial advisor, do not give financial advice and am not recommending the buying or selling of any security.
Remember: Not all setups will trigger. Not all setups will be profitable. Not all setups should be taken. These are simply the setups that I have put together for years on my own and what I watch as part of my own “game plan” coming into each day. Good luck!
This post goes out as an email to our subscribers every day and is posted for free here around 2 PM ET. To get your real-time copy, sign up for the free or premium version here: Opening Print Subscribe.
Comments are closed