This post goes out as an email to our subscribers every day and is posted for free here around 2 PM ET. To get your real-time copy, sign up for the free or premium version here: Opening Print Subscribe.
April 01, 2026 | Read online
One-Day Repair Job — But If the Rockets Keep Flying, Don’t Fall in Love with the Long Side
Follow @MrTopStep on Twitter and please share if you find our work valuable!
FREE Two-Week Offer for the Opening Print Premium. Open up the Lean and other premium features for the next Two Weeks!
Our View
The ES traded up to a Globex high of 6595.00, marking a 241.75-point rally from yesterday’s 6353.25 low. Similarly, the NQ reached 24,048.25, up 1086.75 points from 22,961.50, while the YM hit 46,693, up 1,641 points from Monday’s 45,052 low.
The key tell in all of this—something I missed—was gold, which started signaling strength last Friday.
Today is the first trading day of April and Q2. April is historically one of the strongest months for the S&P 500, positive roughly 72% of the time over the past 68+ years, with an average return of about +1.1% to +1.6%. Early April (the first 5–10 trading days) often captures a large portion of that strength. The first trading day itself has a mild bullish bias, consistent with the turn-of-the-month effect, though it is not as strong as the broader first-half trend.
Our Lean
As of March 31, Iran is still actively launching missile and drone attacks across the Middle East. While the frequency has decreased by roughly 90% since the beginning of the war, Tehran has shifted toward smaller, more precise strikes targeting high-value infrastructure.
The UAE is pushing to force the Strait of Hormuz open and has urged the U.S. and allied powers to form a coalition. An official stated Iran may be willing to choke global supply routes as a strategic lever, while Trump has suggested the U.S. could exit within two to three weeks.
At the same time, Prime Minister Benjamin Netanyahu has stated that Operation Roaring Lion will continue with “uncompromising momentum,” describing the conflict as beyond the halfway point.
The question is simple: Is the war over?
Our lean: I have a trading rule—markets take days or weeks to break down and only one day to repair. Yesterday was a strong start, but if the rockets keep flying, the war isn’t over.
Trump’s claim that Iran’s nuclear threat has been eliminated and would take 15–20 years to rebuild feels overly optimistic. I did say that below 6500 opens the door to 6350–6300, and yesterday’s low was 6353.25—but I have to admit, I didn’t connect all the dots.
I can’t rule out higher prices, but I don’t think the ES and NQ keep going up as they have without some letdowns. If Iran continues to attack the U.S. and Israel and high-value areas in the Middle East, we could go back down, but one thing is for sure: Trump wants out.
*TRUMP TO ADDRESS NATION ON IRAN 9 PM ET WEDNESDAY: LEAVITT
Below is a full spread of my Claude AI ES levels and comments:
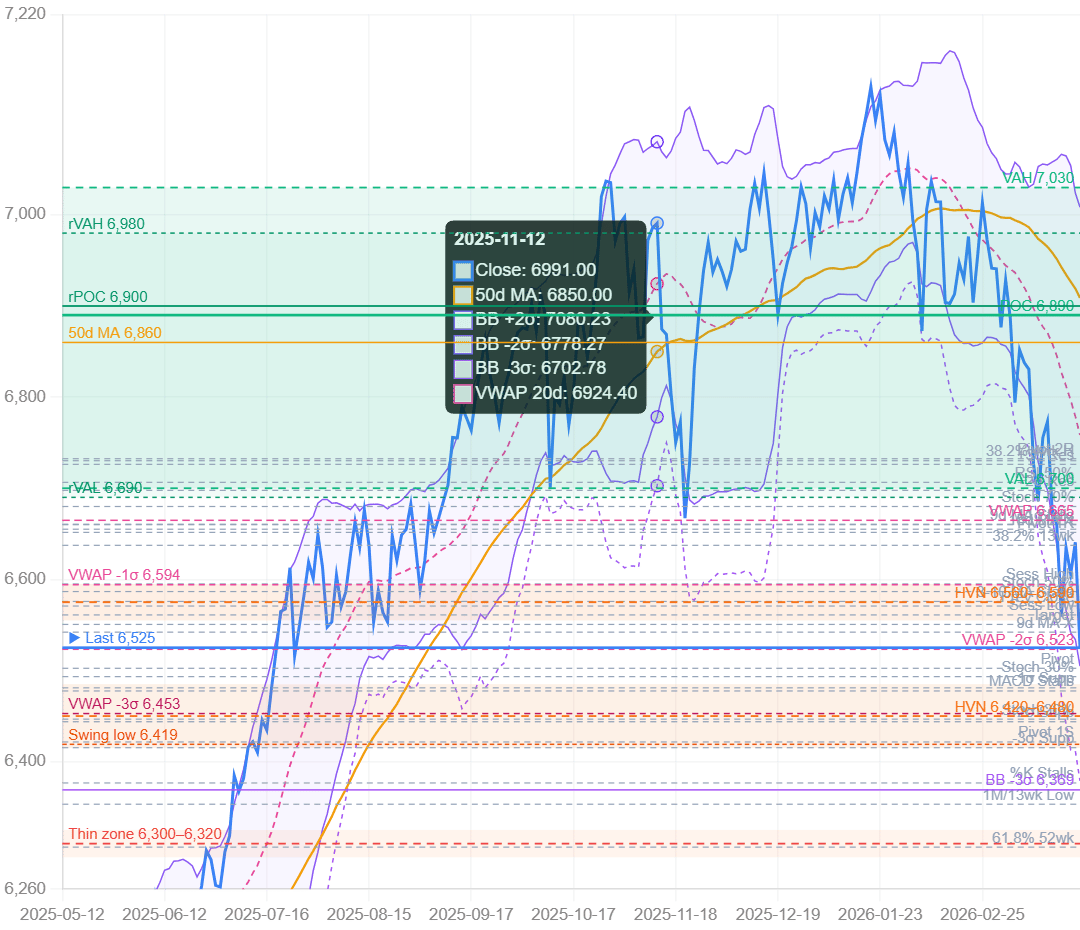
Resistance — Above Current Price (6525.00)
-
7030.00 — Value area high (full dataset): Upper boundary of the 182-session range; major magnet if 6700 is reclaimed
-
7015.00 — Bollinger Band +2σ: Statistically extended; unlikely below mid-band
-
6980.00 — Value area high (30-day): First major upside target on recovery
-
6900.00 — Point of control (30-day): Key resistance; acceptance above signals trend shift
-
6890.00 — Point of control (full dataset): Strongest resistance on the chart
-
6860.24 — 50-day moving average: Downward sloping; bearish overhead resistance
-
6757.00 — Bollinger mid (20-day): First step in trend recovery
-
6732.42 — Pivot resistance (2nd level): Part of 6700–6735 supply cluster
-
6730.23 — 38.2% retracement (4-week): First bounce target; prone to rejection
-
6726.23 — +3σ extension: Extreme level; rally exhaustion zone
-
6725.13 — 50% retracement (13-week): Key equilibrium level
-
6706.49 — RSI (14) at 50: Momentum confirmation if reclaimed
-
6700.00 — Value area low (full): Key pivot; must reclaim to re-enter value
-
6697.70 — +2σ extension: Part of 6695–6700 resistance cluster
-
6690.00 — Value area low (30-day): Reinforces 6700 reclaim zone
-
6679.98 — Stochastic (70): Overbought threshold
-
6665.00 — VWAP (full dataset): Confirms broader seller control below
-
6663.00 — VWAP (20-day): Strong volume anchor
-
6660.52 — +1σ extension: Part of 6655–6665 resistance cluster
-
6660.00 — 9-day MA: Short-term trend pivot
-
6658.25 — 50% retracement (4-week): Cluster resistance
-
6655.06 — 18-day MA: Needs multiple closes above
-
6651.58 — Pivot resistance (1st level): Initial bounce target
-
6637.36 — 38.2% retracement (13-week): First key overhead level
-
6627.47 — Bollinger -1σ: Needs reclaim for short-term strength
-
6595.00 — Session high: First upside reference
-
6594.11 — VWAP -1σ: First recovery signal if reclaimed
-
6586.63 — Stochastic (50): Momentum equilibrium
-
6586.27 — 38.2% retracement (4-week): Near-term bounce level
-
6575.79 — 3–10 MA crossover: Short-term resistance
-
6570.75 — Previous close: Immediate upside pivot
-
6561.00 — Prior session low: Minor reference
-
6550.56 — Target price: Near-term upside objective
-
6542.09 — 9-day MA (cross): Minimum bullish signal level
Current Price
-
6525.00 — Trading below all major indicators; out of value
Support — Below Current Price
-
6523.43 — VWAP -2σ: Key support; mean reversion trigger
-
6502.42 — Pivot point: Breakdown accelerates below
-
6498.30 — Bollinger -2σ: Critical support; breakdown level
-
6493.27 — Stochastic (30): Start of oversold territory
-
6480.98 — -1σ support: Part of 6477–6481 cluster
-
6477.54 — MACD stall: Short-term stabilization zone
-
6453.00 — VWAP -3σ: Extreme mean-reversion level
-
6450.00 — HVN (6420–6480): Strong structural support
-
6446.60 — Stochastic (20): Deep oversold
-
6443.80 — -2σ support: Confirms key support zone
-
6421.58 — Pivot support (1st): Adds confluence to support band
-
6419.00 — Aug 2025 swing low: Proven support
-
6415.27 — -3σ support: Extreme support cluster
-
6376.58 — Stochastic stall: Weak structure below 6415
-
6369.13 — Bollinger -3σ: Rare extreme
-
6353.25 — 1-month / 13-week low: Breakdown trigger
-
6310.00 — Thin zone (6300–6320): Fast-move “air pocket”
-
6306.16 — 61.8% retracement (52-week): Major long-term support
Market Recap
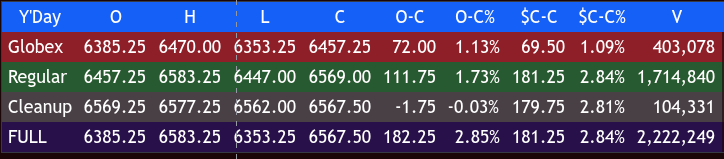
The ES made a low at 6421.50 and traded up to 6470.00 overnight Monday, with 410k ES contracts traded, and last traded 6457.25, up 69.50 (+1.08%).
After the open, the ES rallied to 6465.50, dropped 10 points to 6450.50, then rallied 46.75 points to 6497.25 at 10:00. It sold off 50.25 points to a new low at 6447.00 at 10:55, then rallied 43.50 points to a lower high at 6490.50 at 11:15.
The ES rallied 72 points up to 6562.50 at 12:00. The ES then sold off 46.00 points to 6517.50 at 12:45, rallied 36.50 points to a lower high at 6554.00 at 1:00, and pulled back to 6529.25 at 1:55.
That’s when the end-of-day rebalance started. The ES rallied 49.00 points to a new high at 6578.25 at 3:45 and traded 6576.25 as the 3:50 imbalance showed $3.5 billion to buy, which increased to $6 billion. The ES traded up to 6583.25 and printed 6569.00 on the 4:00 cash close, up 181.25 points (+2.84%).
After 4:00, the ES traded up to 6577.25, sold off to 6565.00, and settled at 6543.50, up 155.25 points (+2.43%). The NQ traded 23,999.75, up 690.75 points (+2.97%); the YM settled at 46,390, up 925 points (+2.04%); and the RTY settled at 2500.10, up 71.90 points (+2.96%) on the day.
In the end, the rally was absolutely stunning and had everything going for it: extremely oversold conditions, quarter-end flows, a massive rebalance, and the JPM collar around the 1:00 ET time frame. The upward move was a combination of several factors: Q1 quarter-end rebalancing, too many shorts, the JPM collar effect, and geopolitically driven relief rallies amid an otherwise choppy, downward-trending month, along with potential war escalation/oil spikes followed by sharp moves on any de-escalation hopes.
In terms of the ES’s overall tone, it was nonstop buying on pullbacks. Volume was elevated, with 2.223 million contracts traded.
Again, everything was moving. GCJ26 (gold futures) closed up 121.60 points (+2.69%). CLJ26 (crude oil futures) made a high at 106.86, sold off to 99.62, and settled at 101.38, down 1.50 (-1.46%). BTCJ26 (bitcoin futures) settled at 68,035, up 1,360 (+2.04%). ZBM26 (bond futures) traded up to 114.06 and settled at 113.28, up 12 points (+0.33%), the highest close in eight sessions. The DXY (dollar index), after being up five sessions in a row, settled at 99.96, down 0.55 (-0.55%), and beans, soybean meal, wheat, and corn all closed higher.
I didn’t predict this yesterday because I 1) underestimated the quarter-end rebalance and 2) underestimated Trump’s “talks are going well with Iran.” Despite a late-day headline stating that Iranian President Masoud Pezeshkian told EU Council President António Costa that Iran has “the necessary will to end this war,” he also said any resolution must guarantee the security and interests of the Iranian people, according to IRNA and regional media.
There was also a Reuters/Bloomberg story titled: “Iran Foreign Minister: Messages, Not Talks Exchanged With U.S.” TEHRAN — Iranian Foreign Minister Abbas Araghchi clarified that while diplomatic messages have been exchanged between Tehran and Washington, the two nations are not engaged in formal negotiations or direct dialogue.
The remarks, broadcast on state television and corroborated by Reuters and Bloomberg, come amid extreme regional volatility and reports of a “15-point peace proposal” delivered via Pakistani intermediaries. Araghchi emphasized that indirect messaging via third parties (primarily Pakistan and Turkey) does not constitute negotiations or dialogue. He reiterated that Iran is seeking a permanent end to the war, not a temporary pause, along with financial compensation for damages from recent escalations.
He also stated that Iran has shown the world that no country can threaten its security following recent U.S.-Israeli strikes and criticized the continued U.S. presence in the Middle East, calling for broader security guarantees, including for Lebanon.
On Tap Today:
-
8:15 am — ADP jobs (March)
-
8:30 am — U.S. retail sales (February, delayed)
-
8:30 am — Retail sales ex-autos (February)
-
9:05 am — St. Louis Fed President Musalem speaks
-
9:10 am — Fed Governor Michael Barr speaks
-
9:45 am — S&P final U.S. manufacturing PMI (March)
-
10:00 am — ISM manufacturing (March)
-
10:00 am — Business inventories (January, delayed)
Guest Posts
MOC Recap
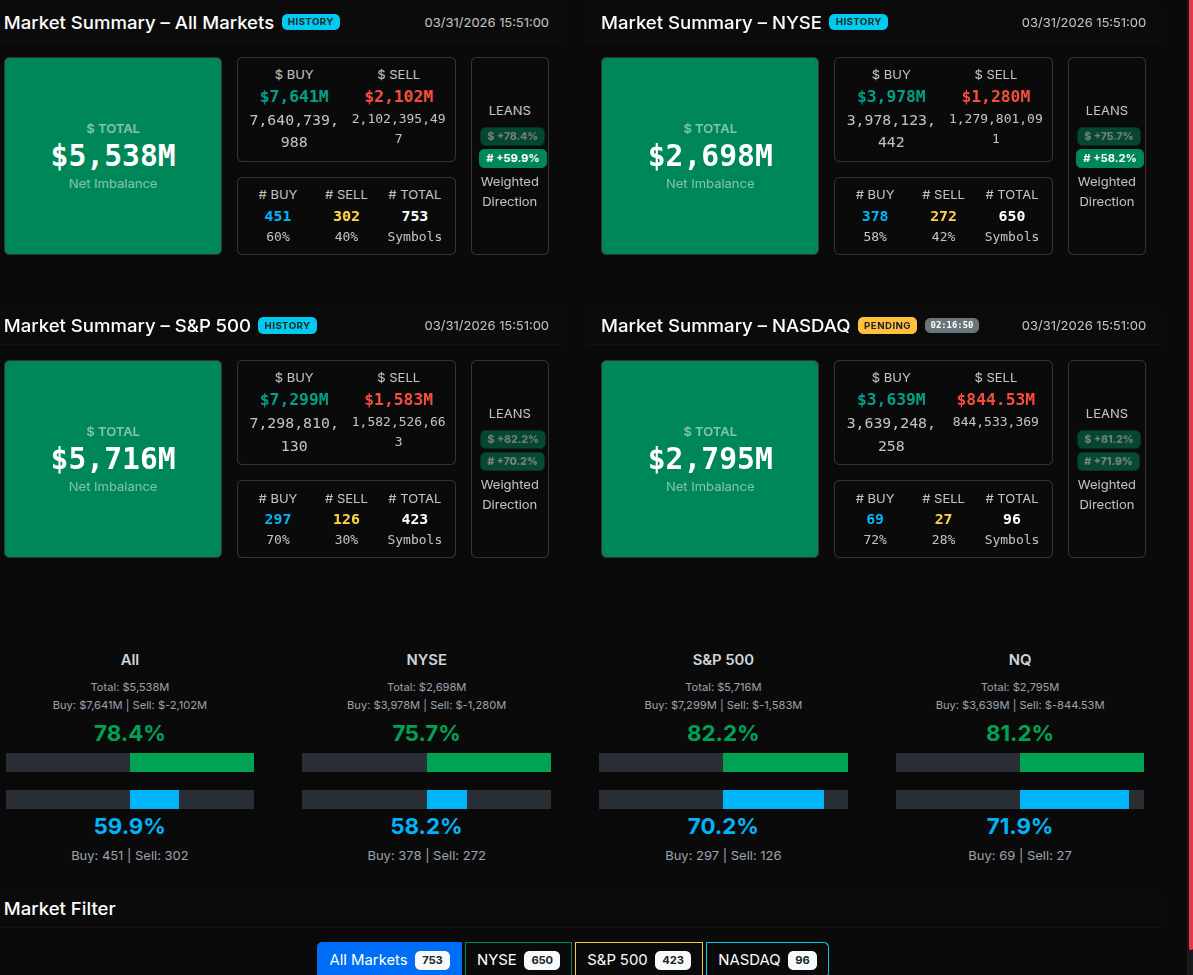
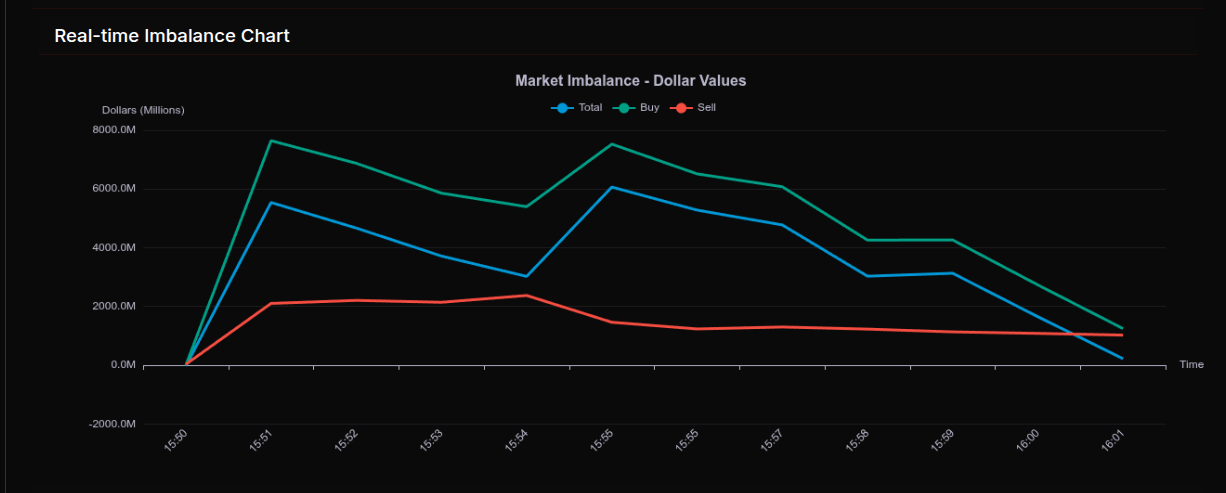
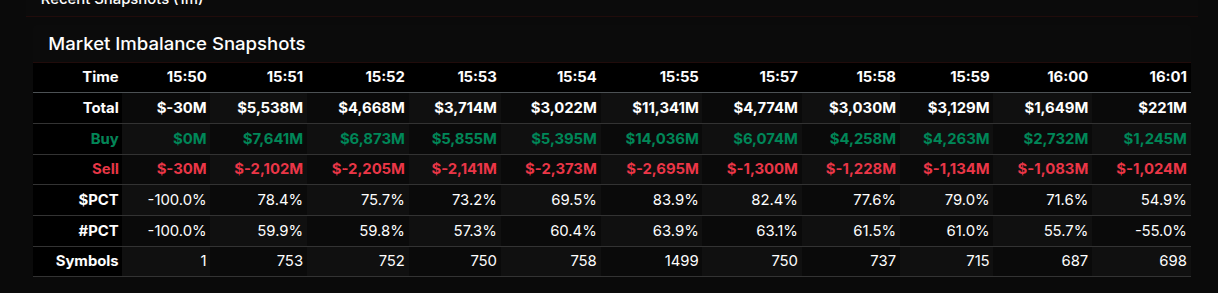
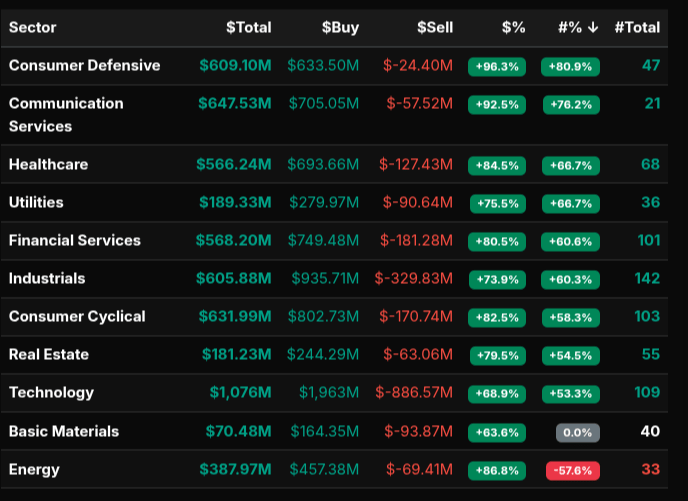
The MOC session unfolded against the backdrop of quarter-end flows, which played a critical role in shaping the strong buy imbalance into the close. The session opened with a sharp shift from an initial -$30M sell imbalance at 15:50 into aggressive institutional buying, quickly expanding to +$5.5B by 15:51 and peaking above $11B at 15:55. This early surge was not random—it reflected systematic end-of-quarter rebalancing, where funds were forced to deploy capital, driving a persistent buy-side skew throughout the auction.
From that peak, imbalances gradually tapered but remained firmly positive, holding above +$3B for much of the session before settling near +$1.6B into the final prints. $PCT readings consistently stayed in the 70–80% range, reinforcing that this was not rotational but rather directional buying. Only into the final minutes did both $PCT and #PCT drift toward the ~50% range, signaling some late-stage matching and distribution, typical of auction completion rather than a change in bias.
Sector participation confirmed broad-based accumulation. Consumer Defensive (+96.3%) and Communication Services (+92.5%) led with extreme leans, well above the 66% threshold, indicating wholesale buying. Energy (+86.8%), Healthcare (+84.5%), and Financials (+80.5%) also saw strong inflows. Technology printed a more moderate +68.9% lean but led in absolute notional flow at over $1B, underscoring its role as the primary destination for deployed capital.
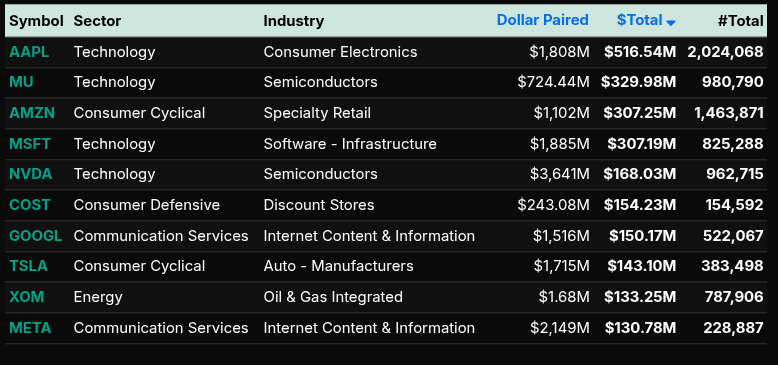
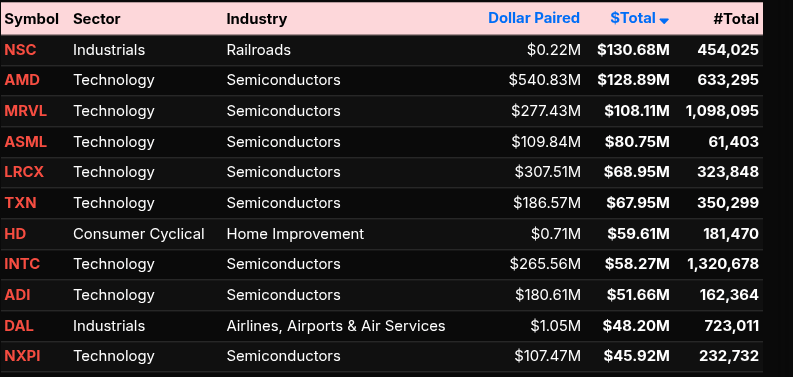
Single-name activity was heavily concentrated in mega-cap and semiconductor names, consistent with institutional allocation behavior. AAPL (+$516M), MU (+$329M), MSFT (+$307M), and AMZN (+$307M) led, alongside NVDA and AMD. The semiconductor complex (AMD, MRVL, ASML, LRCX, TXN) showed coordinated participation, pointing to thematic buying rather than isolated trades.
Overall, this was a textbook quarter-end MOC: forced inflows, broad sector confirmation, and concentrated leadership in large-cap tech. The sustained high buy percentages and absence of meaningful late selling indicate institutional accumulation driven by rebalancing mandates rather than discretionary positioning.
Technical Edge
Fair Values for April 1, 2026:
-
SP: 44.44
-
NQ: 189.47
-
Dow: 242.49
Daily Breadth Data 📊
For Tuesday, March 31, 2026
• NYSE Breadth: 77% Upside Volume
• Nasdaq Breadth: 88% Upside Volume
• Total Breadth: 84% Upside Volume
• NYSE Advance/Decline: 77% Advance
• Nasdaq Advance/Decline: 80% Advance
• Total Advance/Decline: 79% Advance
• NYSE New Highs/New Lows: 56 / 126
• Nasdaq New Highs/New Lows: 70 / 185
• NYSE TRIN: 0.93
• Nasdaq TRIN: 0.53
Weekly Breadth Data 📈
For the week ending Friday, March 27, 2026
• NYSE Breadth: 54% Upside Volume
• Nasdaq Breadth: 46% Upside Volume
• Total Breadth: 49% Upside Volume
• NYSE Advance/Decline: 47% Advance
• Nasdaq Advance/Decline: 39% Advance
• Total Advance/Decline: 42% Advance
• NYSE New Highs/New Lows: 156 / 308
• Nasdaq New Highs/New Lows: 217 / 837
• NYSE TRIN: 0.74
• Nasdaq TRIN: 0.72

Trading Room Summaries
Polaris Trading Group Summary – Tuesday, March 31, 2026
Tuesday unfolded as a high-quality, high-range Cycle Day 1 session, with strong adherence to core PTG principles and several clean, repeatable trade opportunities.
Morning Game Plan & Context
-
The session opened with a clear magnet level at SPX 6475 (JPM Collar), giving directional context.
-
Traders were also focused on Trade Day +2 structure and key levels like the D-Level (~6498 area).
-
Early tone emphasized patience and process, with members already noting improved results from staying disciplined.
Key Trade Action & Wins
-
D-Level Reversal (6496 area) was the standout trade of the morning:
-
Identified as a Cycle Day 1 penetration → reversal setup
-
Executed cleanly by multiple members
-
Highlighted as a textbook REVERSAL PLAY
-
-
This reinforced one of PTG’s core edges: trusting levels and executing without hesitation
-
The room also recognized a “Jam n Slam” pattern, similar to the prior day:
-
Quick directional pushes followed by sharp reversals
-
Rewarded traders who stayed nimble and level-focused
-
Intermarket Insight (Big Theme of the Day)
-
A major teaching focus was the ES vs Crude Oil (CL) negative correlation
-
CL strength → ES weakness
-
CL selloff → ES rally
-
-
This relationship became especially important midday when:
-
News of potential Iran de-escalation triggered a sharp drop in oil
-
Resulted in a strong ES push higher
-
This was a key lesson: understanding intermarket drivers can provide confidence and context for trades
Trader Development & Discipline
-
Strong signs of growth in the room:
-
Traders asking about RSPR setups and proper conditions (MA slope, structure)
-
Increased emphasis on waiting for confirmation instead of forcing trades
-
A notable comment: “my patience has improved and so has the results”
-
-
Reinforcement of methodology:
-
Two Pillars of PTG Trading Method
-
“The Toolbox Matters” → use the right tool at the right time
-
Afternoon Session & Market Dynamics
-
The session evolved into a large range day (~210+ points) driven by:
-
News catalysts
-
Quarter-end positioning
-
-
Late day:
-
EOM/Q (End of Month/Quarter) window dressing took control
-
Market pushed toward highs with institutional buying pressure
-
-
Final push:
-
$6B MOC Buy Imbalance
-
Confirmed strong institutional demand into the close
-
Classic “ramp into the bell”
-
Key Lessons from the Day
-
D-Level remains a cornerstone setup
-
Repeatedly delivers when executed properly
-
“D-Level strikes again”
-
-
Patience = profitability
-
Waiting for structure (RSPR, MA alignment) is paying off
-
-
Intermarket awareness is critical
-
ES/CL relationship provided directional edge multiple times
-
-
Cycle structure matters
-
Failed prior cycle led to a “monster CD1” trend day
-
-
Institutional flows (MOC, EOM/Q) can dominate late
-
Important to recognize when price is being driven by positioning, not just technicals
-
Discovery Trading Group Room Preview – Wednesday, April 1, 2026
-
Macro / Geopolitics: Focus remains on potential de-escalation in Iran; Trump संकेत US exit within 2–3 weeks, claiming core objectives largely achieved
-
Strait of Hormuz: US may step back from securing it, leaving responsibility to other nations; adds uncertainty and keeps oil prices elevated
-
Global Impact: ECB’s Lagarde warns energy disruptions could last into late 2026, with inflation risks rising sharply in Europe
-
Conflicting Signals: US officials say progress is near, but Iran signals no trust and readiness for escalation; timeline credibility remains questionable
-
Markets: Asian equities rebounded after a historically weak month; oil remains supported
-
Volatility: ES volatility surged (5-day ADR ~148) as traders rapidly repriced Middle East risk
-
Positioning: Whale bias slightly bearish into 8:30am ET Unemployment Claims; overnight large trader volume light
-
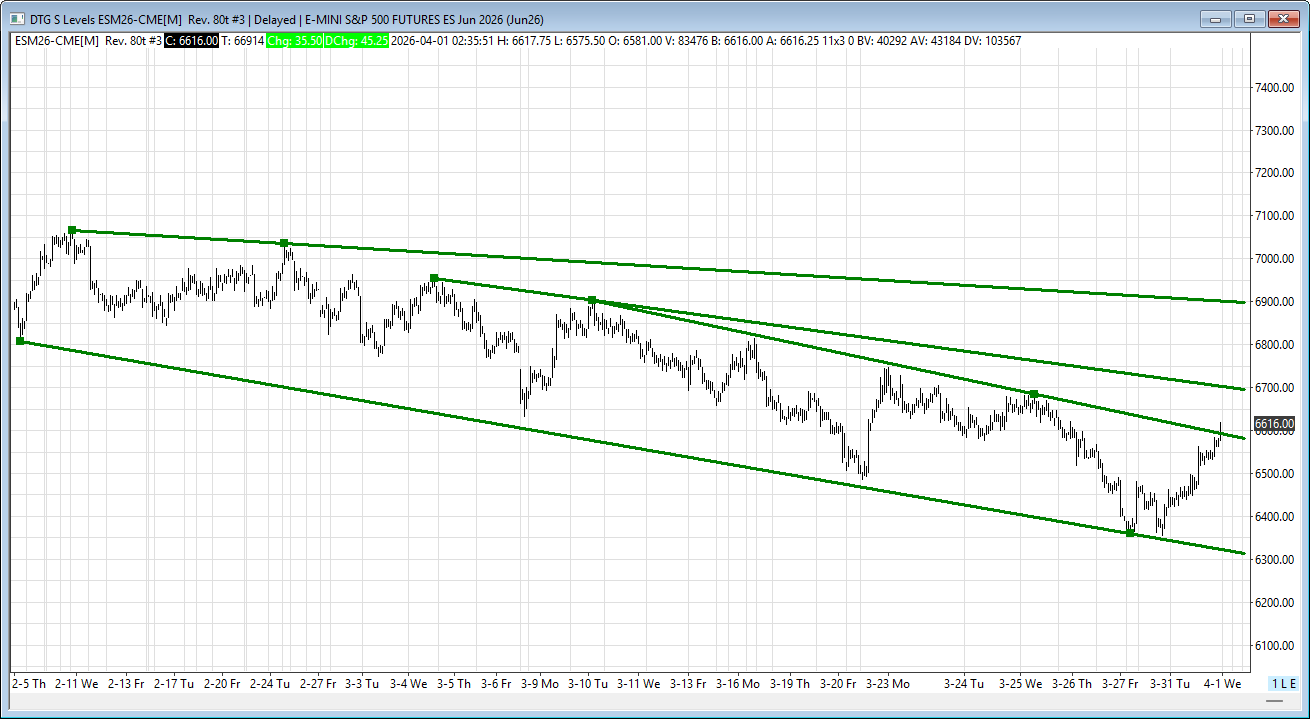
Technical Levels (ES):
-
Downtrend channel resistance: 6593/88
-
Break above opens: 6700/95
-
Major support: 6318/13
-
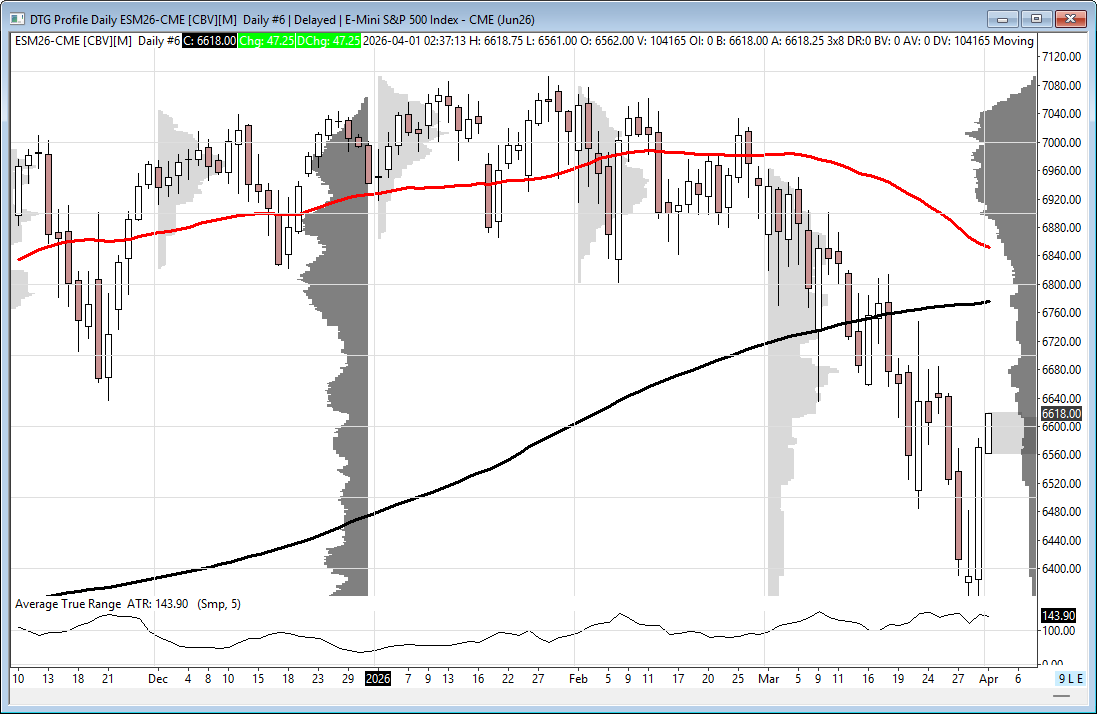
200-day MA: 6776 (unlikely today)
-
50-day MA: 6851 (trending lower)
-
-
Key Data Releases:
-
8:15am ET: ADP Employment
-
8:30am ET: Retail Sales (16-day delay)
-
10:00am ET: ISM Manufacturing PMI
-
-
Additional Data:
-
9:45am ET: S&P Global Manufacturing PMI
-
10:00am ET: Business Inventories (16-day delay)
-
10:30am ET: Crude Oil Inventories
-
-
Fed Speakers:
-
9:05am ET: Musalem
-
9:10am ET: Barr
-
-
Other:
-
9:00pm ET: Trump address on Iran conflict
-
Affiliate Disclosure: This newsletter may contain affiliate links, which means we may earn a commission if you click through and make a purchase. This comes at no additional cost to you and helps us continue providing valuable content. We only recommend products or services we genuinely believe in. Thank you for your support!
Disclaimer: Charts and analysis are for discussion and education purposes only. I am not a financial advisor, do not give financial advice and am not recommending the buying or selling of any security.
Remember: Not all setups will trigger. Not all setups will be profitable. Not all setups should be taken. These are simply the setups that I have put together for years on my own and what I watch as part of my own “game plan” coming into each day. Good luck!
This post goes out as an email to our subscribers every day and is posted for free here around 2 PM ET. To get your real-time copy, sign up for the free or premium version here: Opening Print Subscribe.
Comments are closed